. 2023 Oct 2;83(19):3284-3304.
doi: 10.1158/0008-5472.CAN-23-1711.

Endocrine Therapy Synergizes with SMAC Mimetics to Potentiate Antigen Presentation and Tumor Regression in Hormone Receptor-Positive Breast Cancer

Affiliations

Endocrine Therapy Synergizes with SMAC Mimetics to Potentiate Antigen Presentation and Tumor Regression in Hormone Receptor-Positive Breast Cancer

Francisco Hermida-Prado et al. Cancer Res. .

Abstract

Immunotherapies have yet to demonstrate significant efficacy in the treatment of hormone receptor-positive (HR+) breast cancer. Given that endocrine therapy (ET) is the primary approach for treating HR+ breast cancer, we investigated the effects of ET on the tumor immune microenvironment (TME) in HR+ breast cancer. Spatial proteomics of primary HR+ breast cancer samples obtained at baseline and after ET from patients enrolled in a neoadjuvant clinical trial (NCT02764541) indicated that ET upregulated β2-microglobulin and influenced the TME in a manner that promotes enhanced immunogenicity. To gain a deeper understanding of the underlying mechanisms, the intrinsic effects of ET on cancer cells were explored, which revealed that ET plays a crucial role in facilitating the chromatin binding of RelA, a key component of the NF-κB complex. Consequently, heightened NF-κB signaling enhanced the response to interferon-gamma, leading to the upregulation of β2-microglobulin and other antigen presentation-related genes. Further, modulation of NF-κB signaling using a SMAC mimetic in conjunction with ET augmented T-cell migration and enhanced MHC-I-specific T-cell-mediated cytotoxicity. Remarkably, the combination of ET and SMAC mimetics, which also blocks prosurvival effects of NF-κB signaling through the degradation of inhibitors of apoptosis proteins, elicited tumor regression through cell autonomous mechanisms, providing additional support for their combined use in HR+ breast cancer.

Significance: Adding SMAC mimetics to endocrine therapy enhances tumor regression in a cell autonomous manner while increasing tumor immunogenicity, indicating that this combination could be an effective treatment for HR+ patients with breast cancer.


Figures

None
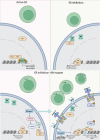
Graphical abstract
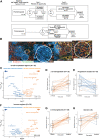
Figure 1. Digital spatial analysis. A, Schema of the endocrine therapy for PELOPS (NCT02764541). Numbers (N) represent the number of tissue samples included in the digital spatial profiling. B, Representative images of immunofluorescence staining for the regions of interest. CD45, cyan; E-cadherin, red; pan-cytokeratin, green. The magnified panels represent two ROIs; immune (#6) and invasive epithelial cells (#2). C–E, Volcano plot of log2-fold changes and adjusted P values of tests for differential protein expression comparing pre and post 24 weeks of endocrine treatment (2 weeks vs. surgical) within invasive epithelial cellular regions (C) and corresponding individual average patient trajectories for β2-microglobulin (D) and PR (E). F–H, Volcano plot of log2-fold changes and adjusted P values of tests for differential protein expression comparing pre and post 24 weeks of endocrine treatment (2 weeks versus surgical) within immune regions (F) and corresponding individual mean patient trajectories for β2-microglobulin (G) and CD4 (H). Horizontal dotted line denotes a 5% FDR threshold.
Figure 1.
Digital spatial analysis. A, Schema of the endocrine therapy for PELOPS (NCT02764541). Numbers (N) represent the number of tissue samples included in the digital spatial profiling. B, Representative images of immunofluorescence staining for the regions of interest. CD45, cyan; E-cadherin, red; pan-cytokeratin, green. The magnified panels represent two ROIs; immune (#6) and invasive epithelial cells (#2). C–E, Volcano plot of log2-fold changes and adjusted P values of tests for differential protein expression comparing pre and post 24 weeks of endocrine treatment (2 weeks vs. surgical) within invasive epithelial cellular regions (C) and corresponding individual average patient trajectories for β2-microglobulin (D) and PR (E). F–H, Volcano plot of log2-fold changes and adjusted P values of tests for differential protein expression comparing pre and post 24 weeks of endocrine treatment (2 weeks versus surgical) within immune regions (F) and corresponding individual mean patient trajectories for β2-microglobulin (G) and CD4 (H). Horizontal dotted line denotes a 5% FDR threshold.
Figure 2. Endocrine treatment shapes tumor immune microenvironment in primary hormone receptor–positive breast cancer. A–F, Digital spatial profiling proteomic levels (log2 expression levels) of immune cell surface markers ranking from highest to lowest expression. A, Baseline levels within the immune regions in tumors from patients who received endocrine therapy [F(11, 312) = 57.1, P < 2e−16, one-way ANOVA]. B, Protein expression levels within the immune regions after 2 weeks of endocrine treatment [F(11, 276) = 41.7, P < 2e−16, one-way ANOVA]. C, Protein expression levels within the immune regions after 24 weeks of endocrine treatment at the time of surgery [F(11, 1212) = 305.2, P < 2e−16, one-way ANOVA]. D, Baseline levels within the invasive epithelial cell regions in tumors from patients who received endocrine therapy [F (11, 732) = 126.3, P < 2e−16, one-way ANOVA]. E, Protein expression levels within the invasive epithelial regions after 2 weeks of endocrine treatment (P < 2e−16, one-way ANOVA). F, Protein expression levels within the invasive epithelial cell regions after 24 weeks of endocrine treatment at the time of surgery (P < 2e−16, one-way ANOVA). Boxplots show median, 25th, and 75th percentiles as boxes, the minimum of the 75th percentile + 1.5 × IQR, and the maximum observation as the upper whisker and the maximum of the 25th percentile −1.5 × IQR and the minimum observation as the lower whisker. G, Trajectory plot of TIL fractions between baseline and 2 weeks. P-val, P value (paired Wilcoxon signed-rank test with continuity correction). H, Trajectory plot of TIL fractions between 2 weeks and surgery for all patients given endocrine treatment that have TIL observations at all three time points. Each trajectory corresponds to a single patient. P-val, P value (paired Wilcoxon signed-rank test with continuity correction). I, GSVA of the T-cell accumulation gene set in primary ER+ breast cancer biopsies from pre- and post-neoadjuvant AI treatment. J, Enrichment plot of the top-ranked gene set (estrogen response) enriched in the ESR1 highest (fourth quartile) versus ESR1 lowest (first quartile) ER–positive breast cancer samples from the TCGA cohort. K–M, GSVA of RNA-seq from the ER–positive breast cancer samples from TCGA divided into quartiles based on ESR1 mRNA levels testing the enrichment score (y-axis) for signatures of immune-checkpoint blockade (ICB) resistance (K), T-regulatory (Treg) accumulation (L), and cytotoxic T-cell accumulation (M). Comparison between the quartiles was done with a t test. N, number of patients included in the corresponding analysis.
Figure 2.
Endocrine treatment shapes tumor immune microenvironment in primary hormone receptor–positive breast cancer. A–F, Digital spatial profiling proteomic levels (log2 expression levels) of immune cell surface markers ranking from highest to lowest expression. A, Baseline levels within the immune regions in tumors from patients who received endocrine therapy [F(, 312) = 57.1, P < 2e−16, one-way ANOVA]. B, Protein expression levels within the immune regions after 2 weeks of endocrine treatment [F(, 276) = 41.7, P < 2e−16, one-way ANOVA]. C, Protein expression levels within the immune regions after 24 weeks of endocrine treatment at the time of surgery [F(11, 1212) = 305.2, P < 2e−16, one-way ANOVA]. D, Baseline levels within the invasive epithelial cell regions in tumors from patients who received endocrine therapy [F (, 732) = 126.3, P < 2e−16, one-way ANOVA]. E, Protein expression levels within the invasive epithelial regions after 2 weeks of endocrine treatment (P < 2e−16, one-way ANOVA). F, Protein expression levels within the invasive epithelial cell regions after 24 weeks of endocrine treatment at the time of surgery (P < 2e−16, one-way ANOVA). Boxplots show median, 25th, and 75th percentiles as boxes, the minimum of the 75th percentile + 1.5 × IQR, and the maximum observation as the upper whisker and the maximum of the 25th percentile −1.5 × IQR and the minimum observation as the lower whisker. G, Trajectory plot of TIL fractions between baseline and 2 weeks. P-val, P value (paired Wilcoxon signed-rank test with continuity correction). H, Trajectory plot of TIL fractions between 2 weeks and surgery for all patients given endocrine treatment that have TIL observations at all three time points. Each trajectory corresponds to a single patient. P-val, P value (paired Wilcoxon signed-rank test with continuity correction). I, GSVA of the T-cell accumulation gene set in primary ER+ breast cancer biopsies from pre- and post-neoadjuvant AI treatment. J, Enrichment plot of the top-ranked gene set (estrogen response) enriched in the ESR1 highest (fourth quartile) versus ESR1 lowest (first quartile) ER–positive breast cancer samples from the TCGA cohort. K–M, GSVA of RNA-seq from the ER–positive breast cancer samples from TCGA divided into quartiles based on ESR1 mRNA levels testing the enrichment score (y-axis) for signatures of immune-checkpoint blockade (ICB) resistance (K), T-regulatory (Treg) accumulation (L), and cytotoxic T-cell accumulation (M). Comparison between the quartiles was done with a t test. N, number of patients included in the corresponding analysis.
Figure 3. E2 modulates response to IFNγ stimulation. A, Histogram of MHC-I levels assessed by flow cytometry following 3 days of E2 stimulation or HD in the presence or absence of IFNγ (10 ng/mL) for the last 24 hours in MCF7 cells. B, Quantification of median fluorescence intensity (MFI) of MHC-I from A. Values are normalized to E2 stimulation with vehicle control (no IFNγ) cells. C–E, MHC-I levels assessed by flow cytometry following 3 days of E2 stimulation or HD in the presence or absence of IFNγ (10 ug/mL) for the last 24 hours in ER+ T47D cells (C), CAMA1 cells (D), and ZR75.1 (E). F and G, Histograms (F) and MFI quantification (G) of MHC-I levels following 3 days of E2 stimulation or HD in the presence or absence of IFNγ (10 ng/mL) for the last 24 hours in MCF7 cells expressing the ESR1 Y537S mutation induced by DOX treatment cells. Two-way ANOVA. H, Histogram of MHC-I levels assessed by flow cytometry following 3 days of vehicle or fulvestrant (10 nmol/L) treatment in the presence or absence of IFNγ (10 ng/mL) for the last 24 hours in MCF7 cells. I, MFI quantification of MHC-I from H. Values are normalized to vehicle control (no IFNγ) cells. Error bars, mean ± SD of at least two replicates. *, P < 0.05, paired t test. J, Histogram of MHC-I levels assessed by flow cytometry following 3 days of E2 stimulation or HD in the presence or absence of IFNγ (10 ng/mL) for the last 24 hours in ER-negative MDA-MB-231 cells. K, MFI quantification of MHC-I from J values is normalized to E2 stimulation (no IFNγ) cells. L, MFI quantification of MHC-I levels assessed by flow cytometry of cells grown in HD, E2 conditions, or treated with fulvestrant or DMSO for 72 hours in the absence of IFNγ (no IFNγ) or with a 15-minute treatment of IFNγ (10 ng/mL) 24 hours prior flow analysis (Pulse) or for the last 24 hours (continuous, cont) prior to flow cytometry analysis. M, PD-L1 levels assessed by flow cytometry following 3 days of E2 stimulation or HD in the presence or absence of IFNγ (10 ng/mL) ×24 hours in MCF7 cells. N, MFI quantification of MHC-I from M. O, PD-L1 levels assessed by flow cytometry following 3 days of vehicle or fulvestrant (10 nmol/L) treatment in the presence or absence of IFNγ (10 ng/mL) ×24 hours in MCF7 cells. P, MFI quantification of MHC-I from O. *, P < 0.05. Q, MFI quantification of PD-L1 levels assessed by flow cytometry after treatment for 72 hours in the absence of IFNγ (no IFNγ), with a 15-minute treatment of IFNγ (10 ng/mL) 24 hours prior to flow cytometry analysis (Pulse) or for the last 24 hours (cont) prior to flow cytometry analysis. Statistics for the panel, if not mentioned differently, are ***, P < 0.001; n.s., not significant. Error bars, mean ± SD of at least two replicates. Two-way ANOVA.
Figure 3.
E2 modulates response to IFNγ stimulation. A, Histogram of MHC-I levels assessed by flow cytometry following 3 days of E2 stimulation or HD in the presence or absence of IFNγ (10 ng/mL) for the last 24 hours in MCF7 cells. B, Quantification of median fluorescence intensity (MFI) of MHC-I from A. Values are normalized to E2 stimulation with vehicle control (no IFNγ) cells. C–E, MHC-I levels assessed by flow cytometry following 3 days of E2 stimulation or HD in the presence or absence of IFNγ (10 ug/mL) for the last 24 hours in ER+ T47D cells (C), CAMA1 cells (D), and ZR75.1 (E). F and G, Histograms (F) and MFI quantification (G) of MHC-I levels following 3 days of E2 stimulation or HD in the presence or absence of IFNγ (10 ng/mL) for the last 24 hours in MCF7 cells expressing the ESR1 Y537S mutation induced by DOX treatment cells. Two-way ANOVA. H, Histogram of MHC-I levels assessed by flow cytometry following 3 days of vehicle or fulvestrant (10 nmol/L) treatment in the presence or absence of IFNγ (10 ng/mL) for the last 24 hours in MCF7 cells. I, MFI quantification of MHC-I from H. Values are normalized to vehicle control (no IFNγ) cells. Error bars, mean ± SD of at least two replicates. *, P < 0.05, paired t test. J, Histogram of MHC-I levels assessed by flow cytometry following 3 days of E2 stimulation or HD in the presence or absence of IFNγ (10 ng/mL) for the last 24 hours in ER-negative MDA-MB-231 cells. K, MFI quantification of MHC-I from J values is normalized to E2 stimulation (no IFNγ) cells. L, MFI quantification of MHC-I levels assessed by flow cytometry of cells grown in HD, E2 conditions, or treated with fulvestrant or DMSO for 72 hours in the absence of IFNγ (no IFNγ) or with a 15-minute treatment of IFNγ (10 ng/mL) 24 hours prior flow analysis (Pulse) or for the last 24 hours (continuous, cont) prior to flow cytometry analysis. M, PD-L1 levels assessed by flow cytometry following 3 days of E2 stimulation or HD in the presence or absence of IFNγ (10 ng/mL) ×24 hours in MCF7 cells. N, MFI quantification of MHC-I from M. O, PD-L1 levels assessed by flow cytometry following 3 days of vehicle or fulvestrant (10 nmol/L) treatment in the presence or absence of IFNγ (10 ng/mL) ×24 hours in MCF7 cells. P, MFI quantification of MHC-I from O. *, P < 0.05. Q, MFI quantification of PD-L1 levels assessed by flow cytometry after treatment for 72 hours in the absence of IFNγ (no IFNγ), with a 15-minute treatment of IFNγ (10 ng/mL) 24 hours prior to flow cytometry analysis (Pulse) or for the last 24 hours (cont) prior to flow cytometry analysis. Statistics for the panel, if not mentioned differently, are ***, P < 0.001; n.s., not significant. Error bars, mean ± SD of at least two replicates. Two-way ANOVA.
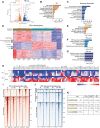
Figure 4. Estrogen deprivation upregulates IFNγ response through NF-κB signaling. A, RNA-seq analysis of MCF-7 cells grown in HD conditions or in the presence of E2 for three days. The volcano plot shows genes differently expressed between HD- and E2-treated conditions (log2FC>1, Padj < 0.01). Number on the top shows the total number of genes differentially expressed for each condition. B, GSEA of upregulated pathways in E2-stimulated cells. C, GSEA of upregulated pathways in the HD condition. D, Three-cluster K-means plot of genes without and with IFNγ stimulation at different time points in cells grown in HD or E2 conditions with and without E2 for three days. E–G, Hallmark pathway analysis of “E2-induced” genes (E), “IFNγ early” (F), and “IFNγ late” (FDR < 0.05; G). H, Supervised heat map of the expression of IFNγ and antigen presentation-related genes in E2-treated and HD condition without and with IFNγ treatment. I–J, ATAC-seq that was performed in MCF7 cells grown in the presence or absence of E2 for 48 hours and followed by ± IFNγ 10 ng/mL stimulation for 24 hours. I, Tornado plots of chromatin accessibility sites based on ATAC-seq showing accessible sites significantly different between E2 and HD conditions showing IFNγ-treated or no IFNγ-treated conditions. J, Tornado plots showing the chromatin sites accessibly induced by IFNγ stimulation in E2 versus HD conditions. K, Motifs enriched in the chromatin accessible sites in J.
Figure 4.
Estrogen deprivation upregulates IFNγ response through NF-κB signaling. A, RNA-seq analysis of MCF-7 cells grown in HD conditions or in the presence of E2 for three days. The volcano plot shows genes differently expressed between HD- and E2-treated conditions (log2FC>1, Padj < 0.01). Number on the top shows the total number of genes differentially expressed for each condition. B, GSEA of upregulated pathways in E2-stimulated cells. C, GSEA of upregulated pathways in the HD condition. D, Three-cluster K-means plot of genes without and with IFNγ stimulation at different time points in cells grown in HD or E2 conditions with and without E2 for three days. E–G, Hallmark pathway analysis of “E2-induced” genes (E), “IFNγ early” (F), and “IFNγ late” (FDR < 0.05; G). H, Supervised heat map of the expression of IFNγ and antigen presentation-related genes in E2-treated and HD condition without and with IFNγ treatment. I–J, ATAC-seq that was performed in MCF7 cells grown in the presence or absence of E2 for 48 hours and followed by ± IFNγ 10 ng/mL stimulation for 24 hours. I, Tornado plots of chromatin accessibility sites based on ATAC-seq showing accessible sites significantly different between E2 and HD conditions showing IFNγ-treated or no IFNγ-treated conditions. J, Tornado plots showing the chromatin sites accessibly induced by IFNγ stimulation in E2 versus HD conditions. K, Motifs enriched in the chromatin accessible sites in J.
Figure 5. NF-κB pathway activation via RelA phosphorylation and binding is enhanced in hormone-deprived conditions. A, Immunoblot of whole-cell lysates for the NF-κB subunits, RelA and RelB, and ER in MCF7 cells grown with E2 10 nmol/L or in HD conditions in response to IFNγ 10 ng/mL stimulation. B, Whole-cell lysate immunoblots of ER, RelA, and phospho-RelA (Ser536) in MCF7 cells. Hormone-deprived cells were stimulated with E2 (10 nmol/L) for 4 days. Protein was extracted every 24 hours. GAPDH was used as a loading control. C, Tornado plots of RelA binding sites in HD cells or treated with 10 nmol/L E2 with or without IFNγ stimulation (10 ng/mL for 1 hour). D, Volcano plot showing differential expression from RNA-seq of MCF7 cells in HD conditions versus E2-treated conditions. Blue dots (True), genes that are differentially expressed based on RNA-seq and predicted to be regulated by RelA based on RelA ChIP-seq and BETA minus analysis. Orange dots (false), genes that are differentially expressed between HD and E2 conditions but not predicted to be regulated by RelA based on the RelA ChIP-seq data. The P value represents the significance of the association between RelA ChIP-seq and RNA-seq up HD (P = 1.9 E−11) or down in HD (P = 0.156) compared with E2-stimulated cells without IFNγ based on BETA basic. E, GSVA of the HD_RelA gene set (541 genes) in primary ER+ breast cancers pre- and post-neoadjuvant treatment with an AI. F and G, RNA-seq differential expression after RelA KO compared with control. Volcano plot highlighting genes differentially expressed between RelA KOs and RelA WT cells grown in HD conditions (F), treated with fulvestrant (10 nmol/L; G), or grown in E2 conditions (H) for 72 hours and stimulated with IFNγ (10 ng/mL) for the last 6 hours (h). n, number of genes differentially expressed. I, RelA ChIP-seq tracks showing examples of RelA peaks at the promoter region of IFNγ-associated genes in MCF7 cells grown in the presence of E2 or in HD conditions and stimulated ± IFNγ (10 ng/mL) for one hour. J, mRNA expression levels of ICAM1, HLA-A, TAP1, B2M, and CXCL10 in E2 and HD conditions without and with RELA silencing KO after 6 hours of IFNγ stimulation. *, P < 0.05; **, P < 0.01; ***, P < 0.001. Error bars, mean ± SD of at least two replicates per each KO. Two-way ANOVA.
Figure 5.
NF-κB pathway activation via RelA phosphorylation and binding is enhanced in hormone-deprived conditions. A, Immunoblot of whole-cell lysates for the NF-κB subunits, RelA and RelB, and ER in MCF7 cells grown with E2 10 nmol/L or in HD conditions in response to IFNγ 10 ng/mL stimulation. B, Whole-cell lysate immunoblots of ER, RelA, and phospho-RelA (Ser536) in MCF7 cells. Hormone-deprived cells were stimulated with E2 (10 nmol/L) for 4 days. Protein was extracted every 24 hours. GAPDH was used as a loading control. C, Tornado plots of RelA binding sites in HD cells or treated with 10 nmol/L E2 with or without IFNγ stimulation (10 ng/mL for 1 hour). D, Volcano plot showing differential expression from RNA-seq of MCF7 cells in HD conditions versus E2-treated conditions. Blue dots (True), genes that are differentially expressed based on RNA-seq and predicted to be regulated by RelA based on RelA ChIP-seq and BETA minus analysis. Orange dots (false), genes that are differentially expressed between HD and E2 conditions but not predicted to be regulated by RelA based on the RelA ChIP-seq data. The P value represents the significance of the association between RelA ChIP-seq and RNA-seq up HD (P = 1.9 E−11) or down in HD (P = 0.156) compared with E2-stimulated cells without IFNγ based on BETA basic. E, GSVA of the HD_RelA gene set (541 genes) in primary ER+ breast cancers pre- and post-neoadjuvant treatment with an AI. F and G, RNA-seq differential expression after RelA KO compared with control. Volcano plot highlighting genes differentially expressed between RelA KOs and RelA WT cells grown in HD conditions (F), treated with fulvestrant (10 nmol/L; G), or grown in E2 conditions (H) for 72 hours and stimulated with IFNγ (10 ng/mL) for the last 6 hours (h). n, number of genes differentially expressed. I, RelA ChIP-seq tracks showing examples of RelA peaks at the promoter region of IFNγ-associated genes in MCF7 cells grown in the presence of E2 or in HD conditions and stimulated ± IFNγ (10 ng/mL) for one hour. J, mRNA expression levels of ICAM1, HLA-A, TAP1, B2M, and CXCL10 in E2 and HD conditions without and with RELA silencing KO after 6 hours of IFNγ stimulation. *, P < 0.05; **, P < 0.01; ***, P < 0.001. Error bars, mean ± SD of at least two replicates per each KO. Two-way ANOVA.
Figure 6. Birinapant potentiates the antitumoral effect of ER blockade. A, Cell growth studies of MCF7 cells treated with vehicle (DMSO), fulvestrant, birinapant, and the combination of fulvestrant and birinapant for 7 days. The number of cells were measured at days 0, 3, 5, and 7. Error bars, SD from four replicates. B, Synergy study of the combination of fulvestrant and birinapant MCF7 cells. Synergy was calculated based on the ZIP reference model using SynergyFinder (www.synergyfinder.org). Deviations between observed and expected responses with positive and negative values denote synergy and antagonism, respectively. C, ER+/HER2− PDX tumor growth study. Error bars, SD (N = 5 mice per group). D, GSEA of genes differentially expressed in MCF7 cells after treatment with fulvestrant (10 nmol/L), birinapant (100 nmol/L), or the combination compared with vehicle (DMSO) control. The size of each circle indicates the q value (genes sets with a q value of <0.25 in at least one condition were included); the color scale indicates the normalized enrichment score (NES). *, P < 0.05; **, P < 0.01; ***, P < 0.001; two-way Anova.
Figure 6.
Birinapant potentiates the antitumoral effect of ER blockade. A, Cell growth studies of MCF7 cells treated with vehicle (DMSO), fulvestrant, birinapant, and the combination of fulvestrant and birinapant for 7 days. The number of cells were measured at days 0, 3, 5, and 7. Error bars, SD from four replicates. B, Synergy study of the combination of fulvestrant and birinapant MCF7 cells. Synergy was calculated based on the ZIP reference model using SynergyFinder (www.synergyfinder.org). Deviations between observed and expected responses with positive and negative values denote synergy and antagonism, respectively. C, ER+/HER2 PDX tumor growth study. Error bars, SD (N = 5 mice per group). D, GSEA of genes differentially expressed in MCF7 cells after treatment with fulvestrant (10 nmol/L), birinapant (100 nmol/L), or the combination compared with vehicle (DMSO) control. The size of each circle indicates the q value (genes sets with a q value of <0.25 in at least one condition were included); the color scale indicates the normalized enrichment score (NES). *, P < 0.05; **, P < 0.01; ***, P < 0.001; two-way Anova.
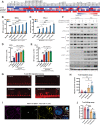
Figure 7. Birinapant and fulvestrant enhance antigen presentation, T-cell migration, and T-cell–mediated cytotoxicity. A, mRNA expression levels of IFNγ and antigen presentation–related genes in MCF7 cells that were treated with vehicle control (DMSO), fulvestrant (10 nmol/L), birinapant (100 nmol/L), and the combination of fulvestrant and birinapant for 3 days and stimulated with IFNγ for the last 24 hours. B–E, Median fluorescence intensity (MFI) quantification of MHC-I and PD-L1 levels assessed by flow cytometry in MCF7 cells grown in HD or in the presence of E2 (B and C) or treated with fulvestrant (10 nmol/L; D and E), and treated with the addition of doses of birinapant for 3 days. Cells were stimulated with IFNγ (10 ng/mL) for the last 24 hours. MFI levels are relative to no-IFNγ conditions (*, P < 0.05; ***, P< 0.001; n.s., not significant). Error bars, mean ± SD of at least two replicates. F, Whole-cell lysates immunoblots of ER, NF-KB subunits, and IFNγ target genes in MCF7 cells grown treated with vehicle control (DMSO), fulvestrant (10 nmol/L), birinapant (100 nmol/L), and the combination with and without IFNγ (10 ng/mL) stimulation for 24 hours. G, Representative immunofluorescence images from T-cell migration assay after treatment with vehicle control (DMSO), fulvestrant (10 nmol/L), birinapant (100 nmol/L), and the combination MCF7 cells were pretreated and seeded in the AIM 3D cell culture chips. Primary CD8+ T cells stained with CellTrace Red Stain were seeded on the lateral channels. H, Quantification of migration to the matrix was measured after 5 days (*, P < 0.05. Error bars are mean ± SD of at least 5 replicates. Two-way ANOVA). I, Representative figures of immunofluorescent stains of cocultured MCF7_NYESO1 and T cells transduced with NYESO1-specific TCR. Immunofluorescent stains include MHC-I (red), granzyme B (green), actin (yellow), DAPI for nuclear staining (blue), and a merged image. J, MCF7 cells expressing specific NYESO1 antigen were pretreated with vehicle (DMSO), fulvestrant (10 nmol/L), birinapant (100 nmol/L), and the combination of both drugs and cocultured with primary NYESO1 TCR+ T cells for 16 hours. The number of cancer cells alive was measured, and data are relative to MCF7_NYESO1 grown without T cells. *, P < 0.05; ***, P < 0.001; n.s., not significant. Error bars are mean ± SD of at least three replicates. Two-way ANOVA.
Figure 7.
Birinapant and fulvestrant enhance antigen presentation, T-cell migration, and T-cell–mediated cytotoxicity. A, mRNA expression levels of IFNγ and antigen presentation–related genes in MCF7 cells that were treated with vehicle control (DMSO), fulvestrant (10 nmol/L), birinapant (100 nmol/L), and the combination of fulvestrant and birinapant for 3 days and stimulated with IFNγ for the last 24 hours. B–E, Median fluorescence intensity (MFI) quantification of MHC-I and PD-L1 levels assessed by flow cytometry in MCF7 cells grown in HD or in the presence of E2 (B and C) or treated with fulvestrant (10 nmol/L; D and E), and treated with the addition of doses of birinapant for 3 days. Cells were stimulated with IFNγ (10 ng/mL) for the last 24 hours. MFI levels are relative to no-IFNγ conditions (*, P < 0.05; ***, P< 0.001; n.s., not significant). Error bars, mean ± SD of at least two replicates. F, Whole-cell lysates immunoblots of ER, NF-KB subunits, and IFNγ target genes in MCF7 cells grown treated with vehicle control (DMSO), fulvestrant (10 nmol/L), birinapant (100 nmol/L), and the combination with and without IFNγ (10 ng/mL) stimulation for 24 hours. G, Representative immunofluorescence images from T-cell migration assay after treatment with vehicle control (DMSO), fulvestrant (10 nmol/L), birinapant (100 nmol/L), and the combination MCF7 cells were pretreated and seeded in the AIM 3D cell culture chips. Primary CD8+ T cells stained with CellTrace Red Stain were seeded on the lateral channels. H, Quantification of migration to the matrix was measured after 5 days (*, P < 0.05. Error bars are mean ± SD of at least 5 replicates. Two-way ANOVA). I, Representative figures of immunofluorescent stains of cocultured MCF7_NYESO1 and T cells transduced with NYESO1-specific TCR. Immunofluorescent stains include MHC-I (red), granzyme B (green), actin (yellow), DAPI for nuclear staining (blue), and a merged image. J, MCF7 cells expressing specific NYESO1 antigen were pretreated with vehicle (DMSO), fulvestrant (10 nmol/L), birinapant (100 nmol/L), and the combination of both drugs and cocultured with primary NYESO1 TCR+ T cells for 16 hours. The number of cancer cells alive was measured, and data are relative to MCF7_NYESO1 grown without T cells. *, P < 0.05; ***, P < 0.001; n.s., not significant. Error bars are mean ± SD of at least three replicates. Two-way ANOVA.

References

    1. Wolchok JD, Kluger H, Callahan MK, Postow MA, Rizvi NA, Lesokhin AM, et al. Nivolumab plus ipilimumab in advanced melanoma. N Engl J Med 2013;369:122–33. - PMC - PubMed
    1. Korde LA, Somerfield MR, Hershman DL; Neoadjuvant Chemotherapy, Endocrine Therapy, and Targeted Therapy for Breast Cancer Guideline Expert Panel. Use of immune checkpoint inhibitor pembrolizumab in the treatment of high-risk, early-stage triple-negative breast cancer: ASCO guideline rapid recommendation update. J Clin Oncol 2022;40:1696–8. - PubMed
    1. Cortes J, Cescon DW, Rugo HS, Nowecki Z, Im SA, Yusof MM, et al. Pembrolizumab plus chemotherapy versus placebo plus chemotherapy for previously untreated locally recurrent inoperable or metastatic triple-negative breast cancer (KEYNOTE-355): a randomised, placebo-controlled, double-blind, phase 3 clinical trial. Lancet 2020;396:1817–28. - PubMed
    1. Zacharakis N, Chinnasamy H, Black M, Xu H, Lu YC, Zheng Z, et al. Immune recognition of somatic mutations leading to complete durable regression in metastatic breast cancer. Nat Med 2018;24:724–30. - PMC - PubMed
    1. Rugo HS, Delord JP, Im SA, Ott PA, Piha-Paul SA, Bedard PL, et al. Safety and antitumor activity of pembrolizumab in patients with estrogen receptor-positive/human epidermal growth factor receptor 2-negative advanced breast cancer. Clin Cancer Res 2018;24:2804–11. - PubMed

Publication types

Substances

Associated data