. 2023 Nov 14;7(21):6608-6623.
doi: 10.1182/bloodadvances.2022008268.

The bone marrow stroma in human myelodysplastic syndrome reveals alterations that regulate disease progression

Affiliations

The bone marrow stroma in human myelodysplastic syndrome reveals alterations that regulate disease progression

Youmna S Kfoury et al. Blood Adv. .

Abstract

Myelodysplastic syndromes (MDSs) are a heterogenous group of diseases affecting the hematopoietic stem cell that are curable only by stem cell transplantation. Both hematopoietic cell intrinsic changes and extrinsic signals from the bone marrow (BM) niche seem to ultimately lead to MDS. Animal models of MDS indicate that alterations in specific mesenchymal progenitor subsets in the BM microenvironment can induce or select for abnormal hematopoietic cells. Here, we identify a subset of human BM mesenchymal cells marked by the expression of CD271, CD146, and CD106. This subset of human mesenchymal cells is comparable with mouse mesenchymal cells that, when perturbed, result in an MDS-like syndrome. Its transcriptional analysis identified Osteopontin (SPP1) as the most overexpressed gene. Selective depletion of Spp1 in the microenvironment of the mouse MDS model, Vav-driven Nup98-HoxD13, resulted in an accelerated progression as demonstrated by increased chimerism, higher mutant myeloid cell burden, and a more pronounced anemia when compared with that in wild-type microenvironment controls. These data indicate that molecular perturbations can occur in specific BM mesenchymal subsets of patients with MDS. However, the niche adaptations to dysplastic clones include Spp1 overexpression that can constrain disease fitness and potentially progression. Therefore, niche changes with malignant disease can also serve to protect the host.


Conflict of interest statement

Conflict-of-interest disclosure: Y.S.K. is currently employed and holds equity at Moderna, Inc (unrelated to this manuscript). E.J. is an employee at Repare therapeutics (unrelated to this manuscript). G.S. is an employee at Tessera Therapeutics (unrelated to this manuscript). D.B.S. is a co-founder and holds equity in Clear Creek Bio (unrelated to this manuscript). O.A.-W. has served as a consultant for H3B Biomedicine, Foundation Medicine Inc, Merck, Prelude Therapeutics, and Janssen, and is on the scientific advisory board of Envisagenics Inc, AIChemy, Harmonic Discovery Inc, and Pfizer Boulder; and has received prior research funding from H3B Biomedicine, Loxo Oncology, and Nurix, unrelated to the current manuscript. D.T.S is founder and shareholder of Fate Therapeutics and Garuda Therapeutics, a founder, shareholder and director of Magenta Therapeutics, Lightning Biotherapeutics and Clear Creek Bio, a director and shareholder of Agios Pharmaceuticals, Editas Medicine and Sonata Therapeutics, a scientific advisory board member to Simcere Pharmaceuticals and VCanBio and previously received research support from Sumitomo Dianippon and Novartis, all unrelated to the current manuscript. The remaining authors declare no competing financial interests.

Figures

None
Graphical abstract
Figure 1.
Figure 1.
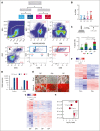
Overlap between a human mesenchymal progenitor subset with murine mesenchymal progenitors whose alteration can promote MDS. (A) Gating strategy for the prospective isolation of mesenchymal subsets in human BM filters. Cells are a mix of BM and digested bone spicules. (B) Frequency of the distinct mesenchymal subsets within the live nonhematopoietic, nonendothelial cells. (C) Frequency of wells testing positive for cell growth of sorted single cells. Wells are scored on a scale from 1 (least confluent) to 3 (most confluent). Data represent 6 independent samples and are presented as mean ± standard deviation (SD). Indicated significance was calculated using 2-way analysis of variance; ∗P < .05; ∗∗P < .01; ∗∗∗P < .001. (D) Relative expression of Col2A1 and ACAN in SP and DP cells differentiated into the chondrogenic lineage. (E) Oil and alizarin red staining for adipogenic and osteogenic differentiation of human BM or spicules mesenchymal subsets. (F) Heatmap of DEGs between Ocn-labeled osteoblasts and Osx-labeled osteoprogenitors; more than twofold change; FDR < 0.05. (G) Heatmap of DEGs between human mesenchymal subsets (3 independent samples for each); more than twofold change; FDR < 0.05. (H) Overlap of DEGs between different human mesenchymal subsets with DEGs between Ocn- and Osx-labeled mouse mesenchymal cells. x-axis shows the statistical significance of the overlap shown as P value on a log scale. Dot size represents the number of overlapping genes.
Figure 2.
Figure 2.
Distinct gene expression signature for mesenchymal subsets in patients with MDS. (A) Gating strategy for sorting distinct mesenchymal subsets from BM of patients undergoing hip replacement therapy or patients with MDS. Red gates indicate populations sorted for sequencing. (B) Frequency of mesenchymal subsets demonstrates no significant differences between patients undergoing hip replacement and patients with MDS. (C) Transcriptome-wide principal component analysis (PCA) of distinct mesenchymal subsets demonstrating the separation between patients undergoing hip replacement surgery and patients with MDS for populations DP, S, DN, and N. (D) Venn diagram demonstrating the overlap in DEGs between patients undergoing hip replacement surgery and those with MDS in the different mesenchymal subsets. (E) Heatmaps of DEGs (more than twofold change; FDR < 0.05) in distinct mesenchymal subsets between patients undergoing hip replacement surgery and patients with MDS. (F) Functional gene categories enriched in DP, DN, and S subsets of patients with MDS. (G) GSEA demonstrating decreased osteogenic differentiation in the S subset of patients with MDS. GO, gene ontology
Figure 2.
Figure 2.
Distinct gene expression signature for mesenchymal subsets in patients with MDS. (A) Gating strategy for sorting distinct mesenchymal subsets from BM of patients undergoing hip replacement therapy or patients with MDS. Red gates indicate populations sorted for sequencing. (B) Frequency of mesenchymal subsets demonstrates no significant differences between patients undergoing hip replacement and patients with MDS. (C) Transcriptome-wide principal component analysis (PCA) of distinct mesenchymal subsets demonstrating the separation between patients undergoing hip replacement surgery and patients with MDS for populations DP, S, DN, and N. (D) Venn diagram demonstrating the overlap in DEGs between patients undergoing hip replacement surgery and those with MDS in the different mesenchymal subsets. (E) Heatmaps of DEGs (more than twofold change; FDR < 0.05) in distinct mesenchymal subsets between patients undergoing hip replacement surgery and patients with MDS. (F) Functional gene categories enriched in DP, DN, and S subsets of patients with MDS. (G) GSEA demonstrating decreased osteogenic differentiation in the S subset of patients with MDS. GO, gene ontology
Figure 3.
Figure 3.
Identification of signaling channels between mesenchymal subsets and MDS-propagating cells. (A) Sorting strategy of CD34+CD38 cells. (B) Transcriptome-wide PCA demonstrating the separation between CD34+CD38 cells in patients undergoing hip replacement surgery and patients with MDS. (C) Heatmap of DEGs (more than twofold change; FDR < 0.05) between CD34+CD38 of patients with MDS and those undergoing hip replacement surgery. (D) Functional gene categories enriched in CD34+CD38 from patients with MDS compared with patients undergoing hip replacement surgery, according to GSEA. (E) Bar plot of ligands with highest frequency of inferred ligand-receptor interactions in the different mesenchymal subsets in which the ligand was differentially expressed in mesenchymal cells of patients with MDS compared with that in cells of the control (more than twofold expression change, with FDR < 0.05), and the receptor was expressed in CD34+CD38 hematopoietic cells. (F-H) Ligand-receptor interactions in the different mesenchymal subsets in which the ligand is differentially expressed in the indicated mesenchymal subset (red: upregulated; blue: downregulated), and the receptor is expressed (RPKM > 1) in CD34+CD38 cells.
Figure 3.
Figure 3.
Identification of signaling channels between mesenchymal subsets and MDS-propagating cells. (A) Sorting strategy of CD34+CD38 cells. (B) Transcriptome-wide PCA demonstrating the separation between CD34+CD38 cells in patients undergoing hip replacement surgery and patients with MDS. (C) Heatmap of DEGs (more than twofold change; FDR < 0.05) between CD34+CD38 of patients with MDS and those undergoing hip replacement surgery. (D) Functional gene categories enriched in CD34+CD38 from patients with MDS compared with patients undergoing hip replacement surgery, according to GSEA. (E) Bar plot of ligands with highest frequency of inferred ligand-receptor interactions in the different mesenchymal subsets in which the ligand was differentially expressed in mesenchymal cells of patients with MDS compared with that in cells of the control (more than twofold expression change, with FDR < 0.05), and the receptor was expressed in CD34+CD38 hematopoietic cells. (F-H) Ligand-receptor interactions in the different mesenchymal subsets in which the ligand is differentially expressed in the indicated mesenchymal subset (red: upregulated; blue: downregulated), and the receptor is expressed (RPKM > 1) in CD34+CD38 cells.
Figure 4.
Figure 4.
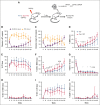
Accelerated progression of NHD13 MDS in Spp1-KO microenvironment. (A) A mix of NHD13STEM:WTCD45.2.STEM BM cells were transplanted in lethally irradiated CD45.2 WT (n = 10) or Spp1-KO (n = 9) mice at a ratio of 3:1. Mice were tracked via monthly peripheral blood analysis. (B-C) Chimerism analysis demonstrating a competitive advantage of WT over NHD13 donor cells in PB in both WT and Spp1-KO recipients. (D) Higher chimerism of NHD13 donor cells in Spp1-KO than in WT recipients. (E) Higher chimerism of WT donor cells in WT than in Spp1-KO recipients. (F) Higher contribution of NHD13 donor cells to peripheral blood myeloid compartment in Spp1-KO recipients. (G) Higher contribution of WT donor cells to peripheral blood myeloid compartment in WT recipients. (H) Very low contribution of NHD13 cells to donor CD3+ cells in WT and Spp1-KO recipients. (I) Competitor WT cells are a major source of donor derived CD3+ cells in WT and Spp1-KO recipients. (J) Very low contribution of NHD13 cells to donor B220+ cells in WT and Spp1-KO recipients. (K) Competitor WT cells are a major source of donor-derived B220+ cells in WT and Spp1-KO recipients. (L) Peripheral blood RBC count, (M) hemoglobin, and (N) mean corpuscular volume (MCV). (O) Survival analysis of WT and Spp1-KO animals that received NHD13 transplant. Data in panels B-N are presented as mean ± SD; ∗P < .05; ∗∗P < .01. Statistical significance was calculated using 2-way analysis of variance; multiple comparisons were corrected for using original FDR method of Benjamini and Hochberg.
Figure 4.
Figure 4.
Accelerated progression of NHD13 MDS in Spp1-KO microenvironment. (A) A mix of NHD13STEM:WTCD45.2.STEM BM cells were transplanted in lethally irradiated CD45.2 WT (n = 10) or Spp1-KO (n = 9) mice at a ratio of 3:1. Mice were tracked via monthly peripheral blood analysis. (B-C) Chimerism analysis demonstrating a competitive advantage of WT over NHD13 donor cells in PB in both WT and Spp1-KO recipients. (D) Higher chimerism of NHD13 donor cells in Spp1-KO than in WT recipients. (E) Higher chimerism of WT donor cells in WT than in Spp1-KO recipients. (F) Higher contribution of NHD13 donor cells to peripheral blood myeloid compartment in Spp1-KO recipients. (G) Higher contribution of WT donor cells to peripheral blood myeloid compartment in WT recipients. (H) Very low contribution of NHD13 cells to donor CD3+ cells in WT and Spp1-KO recipients. (I) Competitor WT cells are a major source of donor derived CD3+ cells in WT and Spp1-KO recipients. (J) Very low contribution of NHD13 cells to donor B220+ cells in WT and Spp1-KO recipients. (K) Competitor WT cells are a major source of donor-derived B220+ cells in WT and Spp1-KO recipients. (L) Peripheral blood RBC count, (M) hemoglobin, and (N) mean corpuscular volume (MCV). (O) Survival analysis of WT and Spp1-KO animals that received NHD13 transplant. Data in panels B-N are presented as mean ± SD; ∗P < .05; ∗∗P < .01. Statistical significance was calculated using 2-way analysis of variance; multiple comparisons were corrected for using original FDR method of Benjamini and Hochberg.
Figure 5.
Figure 5.
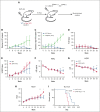
Accelerated progression of NHD13 MDS in SPP1-KO microenvironment uninjured by irradiation. (A) A mix of NHD13CD45.2.1:WTCD45.2 BM cells were transplanted in lethally irradiated CD45.2 WT (n = 5) or Spp1-KO (n = 4) mice at a ratio of 1:1. Mice were tracked via monthly peripheral blood analysis. (B-C) Chimerism analysis of donor cells in WT and SPP1-KO recipients. (D-E) A trend of higher chimerism of NHD13 donor cells in Spp1-KO than in WT recipients. (F) Peripheral blood RBC count, (G) hemoglobin, and (H) MCV. (I) Survival analysis of WT and Spp1-KO animals that received NHD13 transplant. Data in panels F-H are presented as mean ± SD; ∗P < .05; ∗∗P < .01. Statistical analysis was calculated using multiple Student t test.

References

    1. Gangat N, Patnaik MM, Begna K, et al. Survival trends in primary myelodysplastic syndromes: a comparative analysis of 1000 patients by year of diagnosis and treatment. Blood Cancer J. 2016;6(4):e414. - PMC - PubMed
    1. Woll PS, Kjallquist U, Chowdhury O, et al. Myelodysplastic syndromes are propagated by rare and distinct human cancer stem cells in vivo. Cancer Cell. 2014;25(6):794–808. - PubMed
    1. Ogawa S Genetics of MDS Blood. 2019;133(10):1049–1059. - PMC - PubMed
    1. Sperling AS, Gibson CJ. Ebert BL The genetics of myelodysplastic syndrome: from clonal haematopoiesis to secondary leukaemia. Nat Rev Cancer. 2017;17(1):5–19. - PMC - PubMed
    1. Steensma DP, Bejar R, Jaiswal S, et al. Clonal hematopoiesis of indeterminate potential and its distinction from myelodysplastic syndromes. Blood. 2015;126(1):9–16. - PMC - PubMed

Publication types