. 2023 Jul 14;9(28):eadf4766.
doi: 10.1126/sciadv.adf4766. Epub 2023 Jul 14.

RAS-dependent RAF-MAPK hyperactivation by pathogenic RIT1 is a therapeutic target in Noonan syndrome-associated cardiac hypertrophy

Affiliations

RAS-dependent RAF-MAPK hyperactivation by pathogenic RIT1 is a therapeutic target in Noonan syndrome-associated cardiac hypertrophy

Antonio Cuevas-Navarro et al. Sci Adv. .

Abstract

RIT1 is a RAS guanosine triphosphatase (GTPase) that regulates different aspects of signal transduction and is mutated in lung cancer, leukemia, and in the germline of individuals with Noonan syndrome. Pathogenic RIT1 proteins promote mitogen-activated protein kinase (MAPK) hyperactivation; however, this mechanism remains poorly understood. Here, we show that RAF kinases are direct effectors of membrane-bound mutant RIT1 necessary for MAPK activation. We identify critical residues in RIT1 that facilitate interaction with membrane lipids and show that these are necessary for association with RAF kinases and MAPK activation. Although mutant RIT1 binds to RAF kinases directly, it fails to activate MAPK signaling in the absence of classical RAS proteins. Consistent with aberrant RAF/MAPK activation as a driver of disease, we show that pathway inhibition alleviates cardiac hypertrophy in a mouse model of RIT1 mutant Noonan syndrome. These data shed light on the function of pathogenic RIT1 and identify avenues for therapeutic intervention.


Figures

Fig. 1.
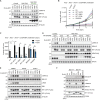
Fig. 1.. RIT1 oncoproteins activate ERK signaling via RAF kinase.
(A) Immunoblot analysis of indicated proteins from HEK293T cells transiently transfected with indicated FLAG-tagged RIT1 constructs or an EV control and treated with 10 μM LY3009120 (RAFi) or DMSO vehicle control for 1 hour. One of two independent experiments is shown. (B) Immunoblot analysis of indicated proteins from HEK293T cells transiently transfected with indicated siRNA and FLAG-tagged RIT1 constructs or EV control. One of two independent experiments is shown. (C) In vitro MEK1 phosphorylation (Ser218/Ser222) by RAF1 or BRAF protein isolated from HEK293T cells coexpressing RIT1A57G, KRASQ61L, or an EV control. a.u., arbitrary units. Data points indicate the means ± SEM of four (RAF1) or three (BRAF) biological replicates (independently isolated RAF protein samples). p, phospho.
Fig. 2.
Fig. 2.. RIT1 associates with the PM through its HVR.
(A) SPR analysis with increasing concentrations of POPS-containing liposomes showing RIT1 (amino acids 17 to 219) association with negatively charged lipids. (B) SPR affinity curves showing relative binding affinity of RIT1 to lipid constructs. (C) RIT1 C-terminal amino acid sequence. PBRs are colored blue. (D) Live-cell confocal images of HeLa cells transiently transfected with indicated GFP-RIT1 constructs. Stable expression of mCherry-KRAS4B was used as a PM marker. Representative images from one of three independent experiments (n = 3). Scale bars, 15 μm. RU, response units.
Fig. 3.
Fig. 3.. RIT1 exhibits preferential binding to RAF1.
(A) Immunoblot analysis of indicated proteins precipitated by GST pull-down assay from HEK293T cell lysates expressing indicated constructs. DNA amounts for WT and mutant RIT1 were adjusted to normalize for protein expression. EV, empty vector; WCL, whole-cell lysate; PD, pulldown. (B) BRET curves show the relative binding affinities of mVenus-RIT1 (acceptor) and RAF-nanoLuc (donor) proteins. Representative BRET curves from three independent experiments are shown. The histogram demonstrates the mean BRET50 values ± SD of three independent experiments. (C) ITC measurements of recombinant RIT1:RAF(RBD) binding affinities. KD values represent an average of three independent experiments (n = 3).
Fig. 4.
Fig. 4.. Characterization of RIT1-RAF RBD interface by NMR.
(A) CSP plots for 15N RAF1-RBD observable in complex with unlabeled WT RIT1 (blue), RIT1A57G (red), and WT KRAS (cyan). Dashed lines represent 1.5σ. (B) CSP shown in (A) and broadened residues were mapped to the 3D-modeled RBD-RIT1 complex and RBD-KRAS structure [Protein Data Bank (PDB): 6VJJ]. (C) The top panel represents the CSP for 15N WT RIT1 (blue) and 15N RIT1A57G (red) in complex with unlabeled RBD. The bottom panel represents CSP for 15N WT KRAS in complex with unlabeled RAF1-RBD. Dashed lines represent 1.5σ. (D) CSP shown in (C) and broadened residues were mapped to the 3D structures as in (B).
Fig. 5.
Fig. 5.. Analysis of the RIT1-RAF RBD structural interface.
(A) Comparison of modeled structures of WT and A57G mutant of RIT1 with the crystal structure of KRAS:RAF1(RBD) complex (PDB: 6VJJ). Top left: Interaction formed by KRAS Ser39 (equivalent to Ala57 in RIT1) and neighboring residues Asp38 and Tyr40 with RAF1-RBD. KRAS and RAF1-RBD are colored green and cyan, respectively. Top right: Superposition of KRAS:RAF1(RBD) complex with the modeled structure of WT RIT1 (colored yellow) in the active state. Bottom left: Superposition of KRAS:RAF1(RBD) complex with the modeled structure of A57G mutant of RIT1 (colored pink) in the active state. Bottom right: Superposition of KRAS:RAF1(RBD) complex with the modeled structures of WT and A57G mutant of RIT1 in the active state. (B and C) Immunoblot analysis of indicated proteins immunoprecipitated from HEK293T cell lysates expressing indicated constructs. (D) Immunoblot analysis of indicated proteins from HEK293T cells transiently transfected with indicated FLAG-tagged RIT1 constructs or an EV. For (B) to (D), one of two independent experiments is shown.
Fig. 6.
Fig. 6.. RIT1 HVR is required for RAF binding.
(A) Immunoblot analysis of indicated proteins immunoprecipitated from HEK293T cell lysates expressing indicated constructs. EV, empty vector; ΔN, amino acid 1 to 18 deletion; ΔC, amino acid 192 to 219 deletion; WCL, whole-cell lysate. (B) BRET assays of indicated C-terminal HVR mutants associated with RAF1-nanLuc. One of three experiments is shown. (C) Histogram of BRET50 values indicating the relative binding affinities of RIT1 C-terminal mutants for RAF1-nanoLuc. Mean BRET50 values ± SD of three independent experiments. (D) Immunoblot analysis of indicated proteins from HEK293T cells transiently transfected with indicated FLAG-tagged RIT1 constructs or an EV. One of two independent experiments is shown.
Fig. 7.
Fig. 7.. Pathogenic RIT1 relies on RAS to potentiate MAPK signaling.
(A) Immunoblot analysis of indicated proteins from Rasless (HRAS/NRAS/KRAS TKO) or control HEK293 cells transiently transfected with indicated FLAG-tagged RIT1 constructs or an EV control and serum-starved for 16 hours. Rasless cells were rescued with ectopic expression of HA-tagged HRAS, NRAS, KRAS4A, and KRAS4B (1:1:1:1 DNA ratio). One of two independent experiments is shown. (B) Proliferation curves of control (−4-OHT) and Rasless (+4-OHT) MEFs stably expressing indicated constructs. Data points indicate the means ± SEM, n = 3. (C) Relative cell growth of control (−4-OHT) and Rasless (+4-OHT) MEFs stably expressing indicated constructs at day 5 of growth assay as in (B). Data points indicate means ± SD (n = 3); two-sided Student’s t test, *P ≤ 0.05, **P ≤ 0.01, and ***P ≤ 0.001; ‡ns, not significant (P > 0.05, versus EV + 4-OHT). (D) Immunoblot analysis of indicated proteins from TKO or control HEK293 cells transiently transfected with indicated FLAG-tagged RIT1 constructs or EV control and serum-starved for 16 hours. TKO cells were rescued with ectopic expression of indicated HA-tagged KRAS4B constructs or an EV control. One of two independent experiments is shown. (E) Immunoblot analysis of indicated proteins from HEK293T cells transiently transfected with indicated FLAG-tagged RIT1 constructs or an EV control and treated with 10 μM RMC-4550 (SHP2i), BI-3406 (SOS1i), or DMSO for 1 hour. GTP-bound RIT1 was precipitated with immobilized RGL3-RBD. One of two independent experiments is shown. (F) Immunoblot analysis of indicated proteins from HEK293 cells transiently transfected with indicated FLAG-tagged constructs and serum-starved for 16 hours. GTP-bound RAS was precipitated with immobilized RAF1-RBD. SOScat (SOS1 amino acids 564 to 1049). One of two independent experiments is shown.
Fig. 8.
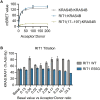
Fig. 8.. Aberrant RIT1 expression promotes RAS:RAF binding.
(A) BRET binding curves show the association of HaloTag-KRAS4B or RIT1 (acceptor) and KRAS4B-nanoLuc (donor) proteins. Representative BRET curves from two independent experiments are shown. Data points indicate the means ± SD of technical triplicates. (B) BRET50 values determined by KRAS4B:RAF1 association in a nanoBRET assay with titration of RIT1 WT or E55G, normalized to basal (no RIT1 cotransfection) level set to 50% (% activity). Data points indicate the means ± SD (n = 3).
Fig. 9.
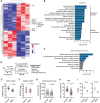
Fig. 9.. MAPK inhibition alleviates RIT1-dependent cardiac hypertrophy.
(A) Heatmap of top differentially expressed genes in primary cardiomyocytes from Rit1LoxP-M90I neonates treated with adenovirus encoding Cre recombinase (AdCre) or GFP (AdGFP). (B and C) GO and KEGG enrichment analysis of differential gene expression elicited by RIT1M90I expression in primary cardiomyocytes (AdCre versus AdGFP). (D) Schema of 20-week trametinib (MEKi) preclinical trial with Rit1M90I/+ mice. q.d., once a day. (E and F) Comparison of normalized heart (E) or spleen (F) weight between MEKi (n = 16) and vehicle control (n = 20) group. Statistical significance was assessed by a two-tailed Mann-Whitney test. Error bars indicate means ± SD. (G and H) Quantification of myocyte area (G) and Ki67+ cells (H) from heart cross sections by immunofluorescence and immunohistochemistry, respectively. Statistical significance was assessed by a two-tailed Mann-Whitney test. Error bars indicate means ± SD. (I) Normalized mRNA transcript levels [Fragments Per Kilobase Million (FPKM)] of indicated genes in hearts (n = 5) isolated from vehicle control or MEKi-treated Rit1M90I/+ mice at 20-week end point. Error bars indicate means ± SEM.
Fig. 10.
Fig. 10.. Model of MAPK pathway activation by mutant RIT1.
Cancer and NS-associated pathogenic RIT1 variants promote MAPK pathway activation in a classical RAS-dependent manner. Mutant RIT1 proteins evade LZTR1-mediated proteasomal degradation and accumulate at the PM residing in close proximity to RAS. Pathogenic RIT1 accumulation drives RAF recruitment to the PM via the RAF-RBD but inefficient CRD engagement limits RAF activation. However, the increased local concentration of RAF promotes its activation by RAS molecules in response to upstream RTK signaling. Inhibition of various RTK-RAS-MAPK signaling components (e.g., SHP2, SOS1, RAF, and MEK) abated aberrant MAPK activation by mutant RIT1. KD, kinase domain.

Similar articles

Cited by

References

    1. P. Castel, K. A. Rauen, F. McCormick, The duality of human oncoproteins: Drivers of cancer and congenital disorders. Nat. Rev. Cancer 20, 383–397 (2020). - PMC - PubMed
    1. D. K. Simanshu, D. V. Nissley, F. McCormick, RAS proteins and their regulators in human disease. Cell 170, 17–33 (2017). - PMC - PubMed
    1. S. J. Leevers, H. F. Paterson, C. J. Marshall, Requirement for Ras in Raf activation is overcome by targeting Raf to the plasma membrane. Nature 369, 411–414 (1994). - PubMed
    1. D. Stokoe, S. G. Macdonald, K. Cadwallader, M. Symons, J. F. Hancock, Activation of Raf as a result of recruitment to the plasma membrane. Science 264, 1463–1467 (1994). - PubMed
    1. K. A. Rauen, The RASopathies. Annu. Rev. Genomics Hum. Genet. 14, 355–369 (2013). - PMC - PubMed

Substances