. 2023 Jul 14;9(28):eadd5479.
doi: 10.1126/sciadv.add5479. Epub 2023 Jul 14.

Overexpression of Nfe2l1 increases proteasome activity and delays vision loss in a preclinical model of human blindness

Affiliations

Overexpression of Nfe2l1 increases proteasome activity and delays vision loss in a preclinical model of human blindness

Yixiao Wang et al. Sci Adv. .

Abstract

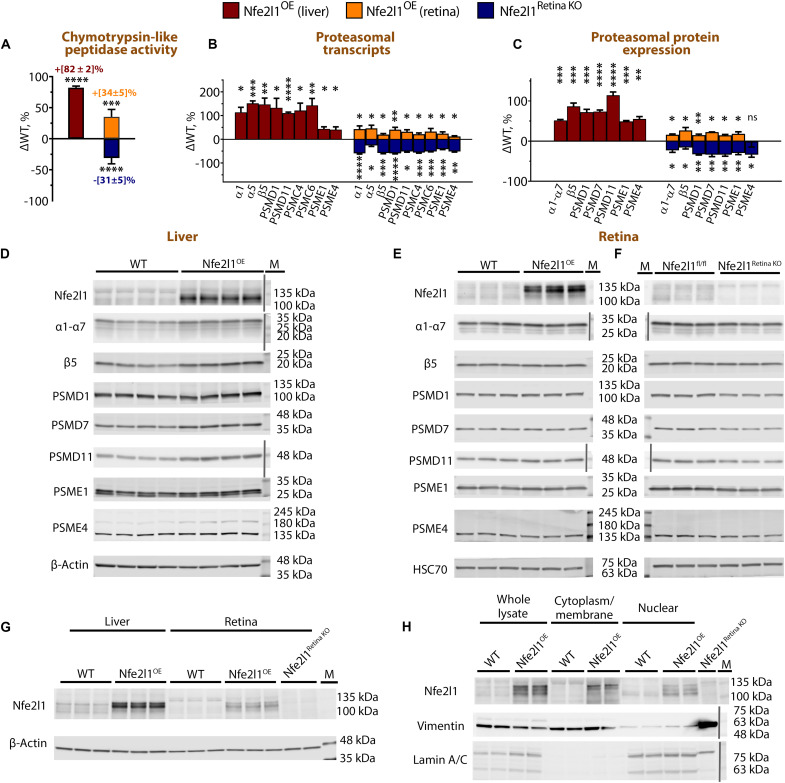
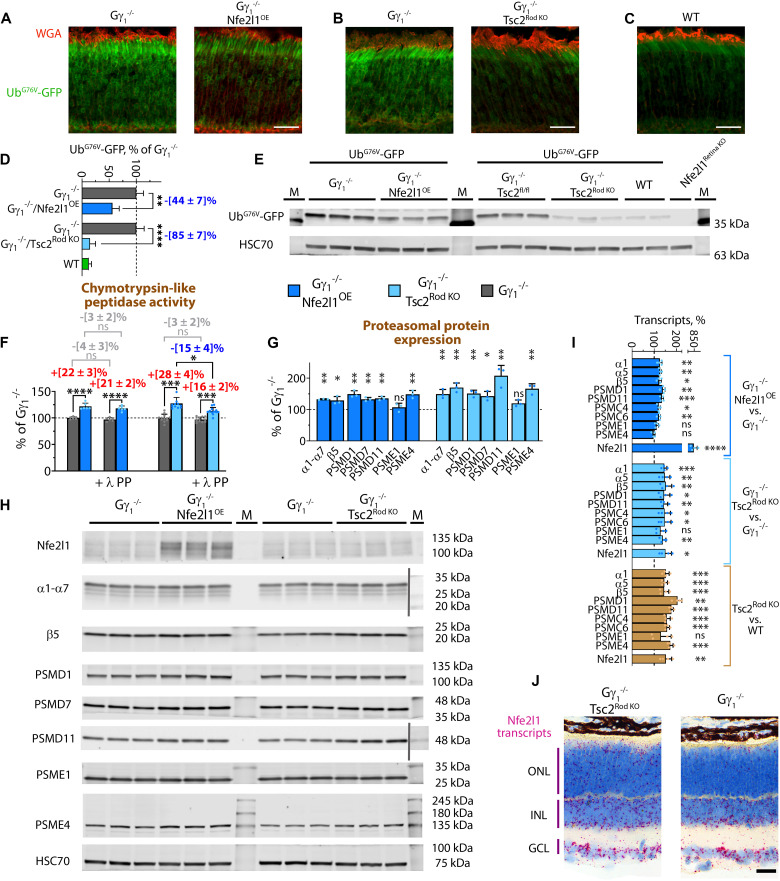
Proteasomes are the central proteolytic machines that are critical for breaking down most of the damaged and abnormal proteins in human cells. Although universally applicable drugs are not yet available, the stimulation of proteasomal activity is being analyzed as a proof-of-principle strategy to increase cellular resistance to a broad range of proteotoxic stressors. These approaches have included the stimulation of proteasomes through the overexpression of individual proteasome subunits, phosphorylation, or conformational changes induced by small molecules or peptides. In contrast to these approaches, we evaluated a transcription-driven increase in the total proteasome pool to enhance the proteolytic capacity of degenerating retinal neurons. We show that overexpression of nuclear factor erythroid-2-like 1 (Nfe2l1) transcription factor stimulated proteasome biogenesis and activity, improved the clearance of the ubiquitin-proteasomal reporter, and delayed photoreceptor neuron loss in a preclinical mouse model of human blindness caused by misfolded proteins. The findings highlight Nfe2l1 as an emerging therapeutic target to treat neurodegenerative diseases linked to protein misfolding.


Figures

Fig. 1.
Fig. 1.. Nfe2l1 levels establish the size of the proteasome pool in retinas.
(A) Chymotrypsin-like peptidase activity measured in the retinal extracts prepared from Nfe2l1OE and Nfe2l1Retina KO mice and liver extracts prepared from Nfe2l1OE mice. (B) Transcriptional analysis of representative proteasome subunits in retinas or livers of the indicated mice performed via RT-qPCR. (C) Quantification graphs and (D to F) Western blots showing proteasomal components detected in (D) livers and (E) and (F) extracts prepared from the retinas of the indicated mice. Changes in proteasome activity, transcript levels, and protein levels were expressed as the percentage of difference (ΔWT) from the average value obtained with WT mice. (G) Comparative Western blots showing the levels of Nfe2l1 in the lysates prepared from the livers and retinas of indicated mice. Retinal lysates of Nfe2l1Retina KO mice were used to control for antibody specificity. (H) Detection of Nfe2l1 in whole lysates and subcellular fractions prepared from the livers of Nfe2l1-overexpressing mice and their WT littermates. All mice were 1 month old. The data are presented as the mean ± SD. All experiments were repeated at least three times. Color-stained protein markers (M) were either detected as nonspecific bands together with proteins of interest during enhanced chemiluminescence and infrared imaging or added from blot photographs (separated with a vertical gray line).
Fig. 2.
Fig. 2.. Nfe2l1 overexpression increases the levels of proteasome transcripts in rod photoreceptors.
(A) Nfe2l1 transcripts detected in the retinas of the indicated mice via RNA in situ hybridization (ISH). ONL, outer nuclear layer (containing photoreceptor nuclei); INL, inner nuclear layer; GCL, ganglion cell layer. Scale bar, 25 μm. See also fig. S1 for retinal cross sections. (B) Uniform manifold approximation and projection (UMAP) plot of cells prepared from Nfe2l1OE and WT mouse retinas. (C) Expression levels of Nfe2l1 and proteasome transcripts in the rod photoreceptor fractions of the indicated mice. Rhodopsin (Rho) transcripts serve as control markers for rods. (D and E) Volcano plots showing differentially expressed genes in (D) retinas and (E) livers of Nfe2l1OE mice as detected with bulk RNAseq. Black dots represent genes with a false discovery rate less than 0.05. (F) Top pathways affected by Nfe2l1 overexpression in livers and identified with Ingenuity Pathway Analysis software (QIAGEN, Hilden, Germany). See also data S1 (retina) and S2 (liver) for complete lists and analysis. (G) Heatmap of changes in proteasome transcripts in livers of Nfe2l1OE and WT mice calculated from raw counts and presented as z scores. FDR, false discovery rate.
Fig. 3.
Fig. 3.. Nfe2l1 overexpression counteracts UPS insufficiency in a RhoP23H/WT mouse model of human blindness.
(A) UbG76V-GFP reporter (green) in retinal cross sections of RhoP23H/WT and RhoP23H/WT/Nfe2l1OE littermates, and UbG76V-GFP/WT control mice. Rod outer segments (red) were stained with wheat germ agglutinin (WGA). Scale bar, 25 μm. (B) Quantification plot and (C) representative Western blot of the UbG76V-GFP reporter in retinas of mice with the indicated genotypes detected with an anti-GFP antibody. Extracts prepared from littermates negative for the UbG76V-GFP transgene were used to control for antibody specificity. The results are shown as a percentage of the average signal in RhoP23H/WT/UbG76V-GFP mice. (D) Chymotrypsin-like peptidase activity was measured in the extracts prepared from retinas of RhoP23H/WT and RhoP23H/WT/Nfe2l1OE littermate mice. (E) Transcription analysis of the representative proteasome subunits in indicated mice was performed with RT-qPCR. Quantification graphs of the Western blot bands for (F) proteasome components and (G) autophagy markers detected in the extracts prepared with retinas from the indicated mice. Images of Western blots quantified to generate the plots are shown in fig. S2. (H to K) Polyubiquitin chains in the extracts prepared from retinas of the indicated mice as detected by Western blotting with (H) FK2 and (J) P4D1 antibodies. (I) and (K) Averaged density profiles of the polyubiquitin staining shown in (H) and (J). All animals were 28 days old. The data are presented as the mean ± SD (B) and (D) to (G) or the mean ± 95% CI (I) and (K).
Fig. 4.
Fig. 4.. Nfe2l1 overexpression delays retinal degeneration in a RhoP23H/WT mouse model of human blindness.
(A) Comparative analysis of age-related thinning of the ONL in RhoP23H/WT and RhoP23H/WT/Nfe2l1OE mice. To generate the plot, the measurements from horizontal optical coherence tomography (OCT)–based spider diagrams built around optic nerve head (ONH) at the indicated ages were summed, normalized to average values of 30-day-old RhoP23H/WT mice, and fitted with an exponent. (B and C) Representative horizontal SD-OCT scans and (D) OCT-based spider diagrams showing ONL thickness at indicated ages. The ONL is marked with a blue quadrilateral. The scale bar for the OCT images is 100 μm. The numbers of eyes analyzed at P30 were as follows: RhoP23H/WT—8, RhoP23H/WT/Nfe2l1OE—5, WT—4, Nfe2l1OE—3; at P45: RhoP23H/WT—14, RhoP23H/WT/Nfe2l1OE—12, WT—8, Nfe2l1OE—8; at P90: RhoP23H/WT—14, RhoP23H/WT/Nfe2l1OE—12, WT—10, Nfe2l1OE—22; at P180: RhoP23H/WT—14, RhoP23H/WT/Nfe2l1OE—12, WT—11, Nfe2l1OE—13. The data are presented as the mean ± SD. Quantification was performed by individuals not aware of genotype.
Fig. 5.
Fig. 5.. Nfe2l1 overexpression improves photoreceptor survival in a RhoP23H/WT mouse model of human blindness.
Morphometric analysis of retinas obtained from 6-month-old mice of the indicated genotypes. (A and D) Images of the representative regions of H&E-stained retinal cross sections from (A) inferior and (D) superior parts of the retinas ~750 μm from the center of the ONH. Scale bar, 25 μm. (B) Spider diagrams show the number of photoreceptor nuclei in 100-μm segments counted along the inferior-superior axis of the mouse eyes and (C) the distance from the outer limiting membrane to the tip of the outer segments (IS/OS length) measured at the indicated distances from the center of the ONH. The representative cross sections cut through an entire retina are shown in fig. S3. The number of eyes analyzed was as follows: RhoP23H/WT—10 and RhoP23H/WT/Nfe2l1OE—13. The data are presented as the mean ± SD. Quantification was performed by individuals not aware of genotype.
Fig. 6.
Fig. 6.. Nfe2l1 overexpression delays vision loss in a RhoP23H/WT mouse model of human blindness.
Response amplitudes of electroretinography (ERG) a- and b-waves evoked by light flashes of increasing intensity in the mice with the indicated genotypes as determined at (A to D) 3 and (E to H) 6 months of age. The number of eyes analyzed at 3 months was as follows: RhoP23H/WT—13, RhoP23H/WT/Nfe2l1OE—12, WT—7 eyes, and Nfe2l1OE—7. The number of eyes analyzed at 6 months was as follows: RhoP23H/WT—12, RhoP23H/WT/Nfe2l1OE—12, WT—6, Nfe2l1OE—12. (C), (D), (G), and (H) Representative ERG recordings evoked by flashes of indicated light intensities. The data are presented as the mean ± SEM.
Fig. 7.
Fig. 7.. Nfe2l1 overexpression and Tsc2 knockout counteract UPS insufficiency in a Gγ1−/− mouse model of photoreceptor degeneration.
(A to C) Fluorescence signal of UbG76V-GFP reporter (green) in retinal cross-sections of (A) Gγ1−/−/Nfe2l1OE and (B) Gγ1−/−/Tsc2Rod KO mice shown along with their Gγ1−/− littermates and (C) UbG76V-GFP/WT control mice. The outer rod segments (red) are stained with WGA. Scale bar, 25 μm. (D) Quantification plot and (E) representative Western blot of the UbG76V-GFP reporter in lysates prepared from the retinas of indicated mice as detected with an anti-GFP antibody. (F) Chymotrypsin-like proteasome activity was measured in retinal extracts with or without lambda protein phosphatase treatment (λ PP). (G) Quantification plot and (H) Western blots showing representative proteasome subunits in the retinal extracts of the indicated mice. The protein markers (M) were detected as nonspecific bands together with proteins of interest or added from blot photographs and separated with a vertical gray line. (I) Transcript analysis of Nfe2l1 and representative proteasome subunits in retinas from the indicated mice performed with RT-qPCR and shown as a percentage of the average values for Gγ1−/− or WT littermates. (J) Nfe2l1 transcripts in the retinas of indicated mice as detected with RNA ISH. See also fig. S4. Scale bar, 25 μm. All animals were 1 month old. The data are shown as the mean ± SD.

Similar articles

Cited by

References

    1. C. L. Klaips, G. G. Jayaraj, F. U. Hartl, Pathways of cellular proteostasis in aging and disease. J. Cell Biol. 217, 51–63 (2018). - PMC - PubMed
    1. N. P. Dantuma, L. C. Bott, The ubiquitin-proteasome system in neurodegenerative diseases: Precipitating factor, yet part of the solution. Front. Mol. Neurosci. 7, 70 (2014). - PMC - PubMed
    1. M. S. Hipp, P. Kasturi, F. U. Hartl, The proteostasis network and its decline in ageing. Nat. Rev. Mol. Cell Biol. 20, 421–435 (2019). - PubMed
    1. A. L. Goldberg, H. T. Kim, D. Lee, G. A. Collins, Mechanisms that activate 26S proteasomes and enhance protein degradation. Biomolecules 11, 779 (2021). - PMC - PubMed
    1. B. M. Stadtmueller, C. P. Hill, Proteasome activators. Mol. Cell 41, 8–19 (2011). - PMC - PubMed