. 2023 Jul 14;9(28):eadf7084.
doi: 10.1126/sciadv.adf7084. Epub 2023 Jul 14.

Glyoxal fixation: An approach to solve immunohistochemical problem in neuroscience research

Affiliations

Glyoxal fixation: An approach to solve immunohistochemical problem in neuroscience research

Kohtarou Konno et al. Sci Adv. .

Abstract

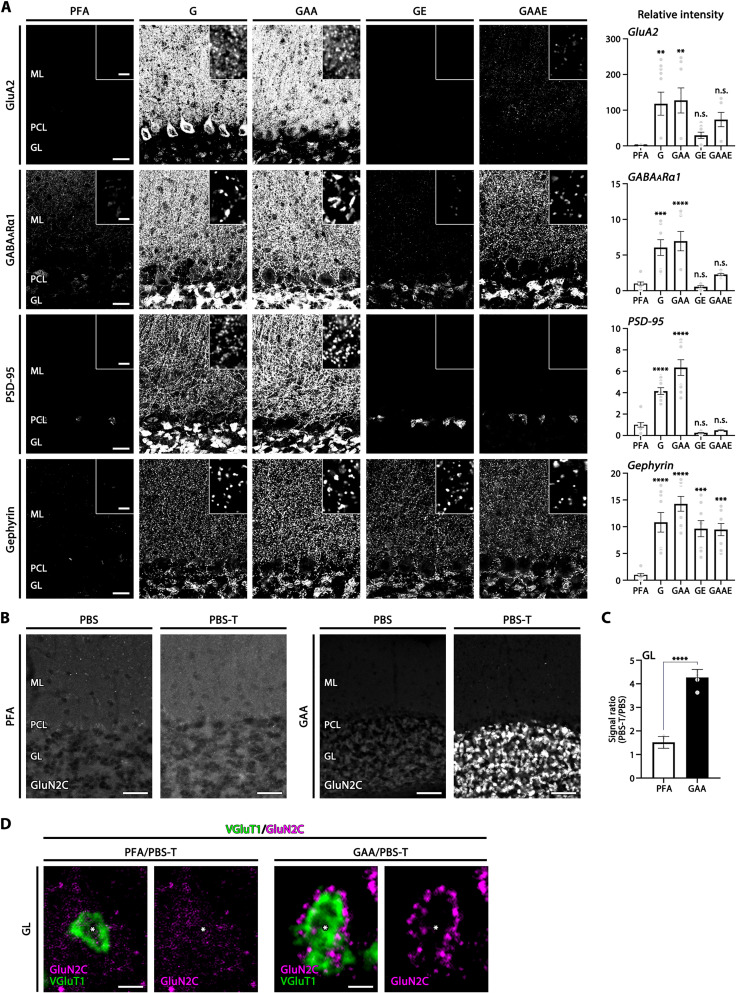
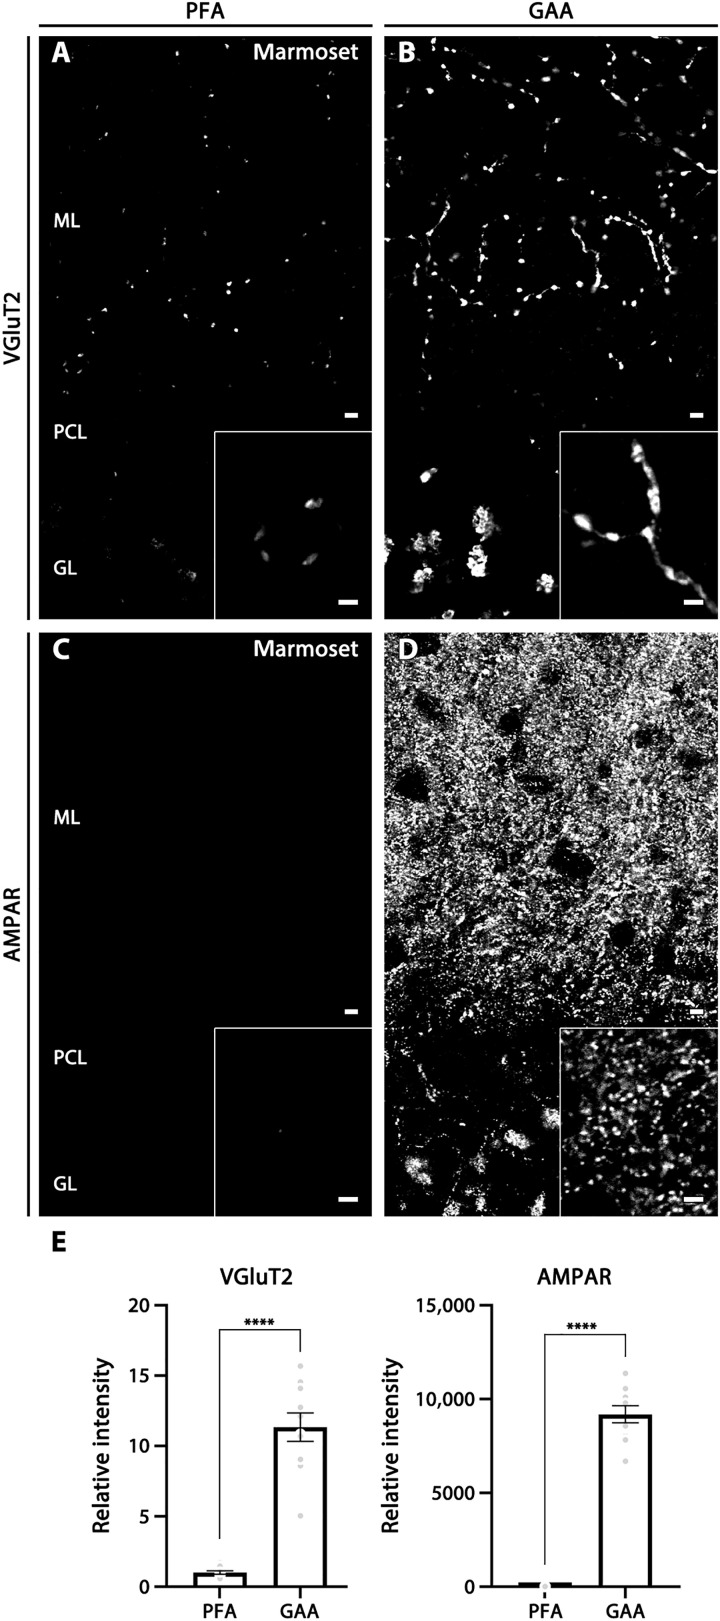
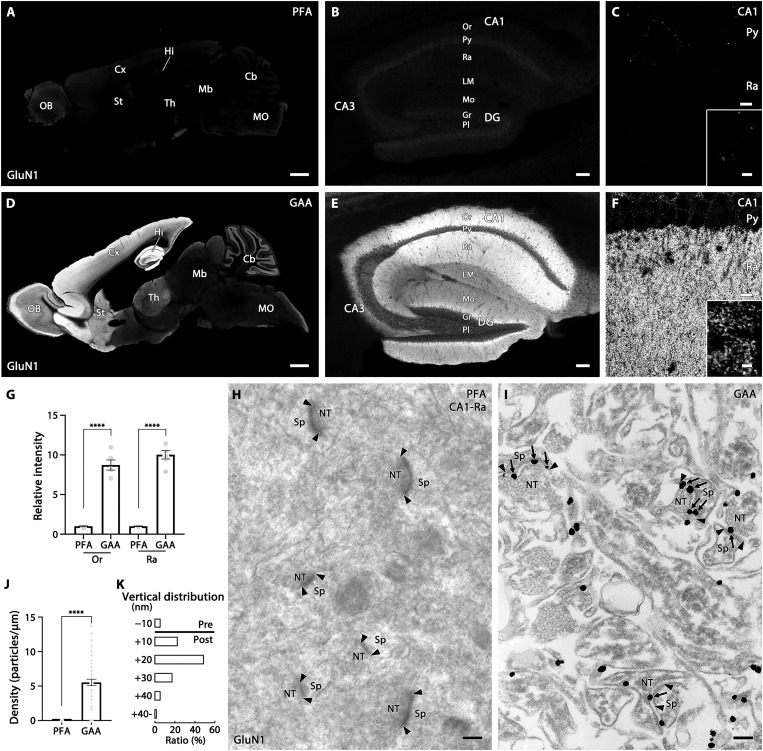
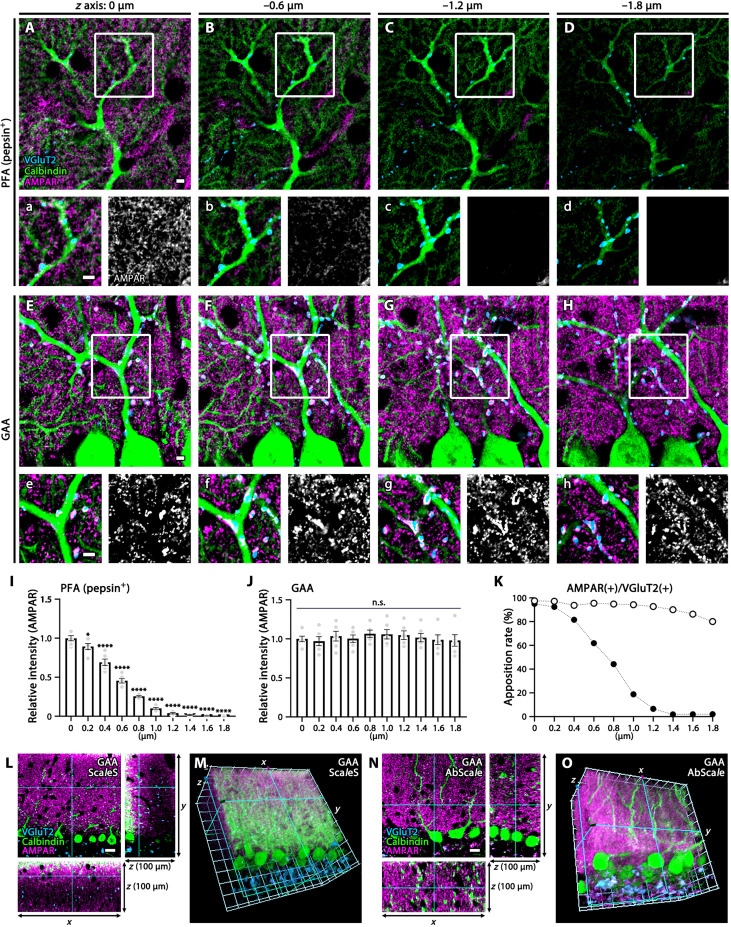
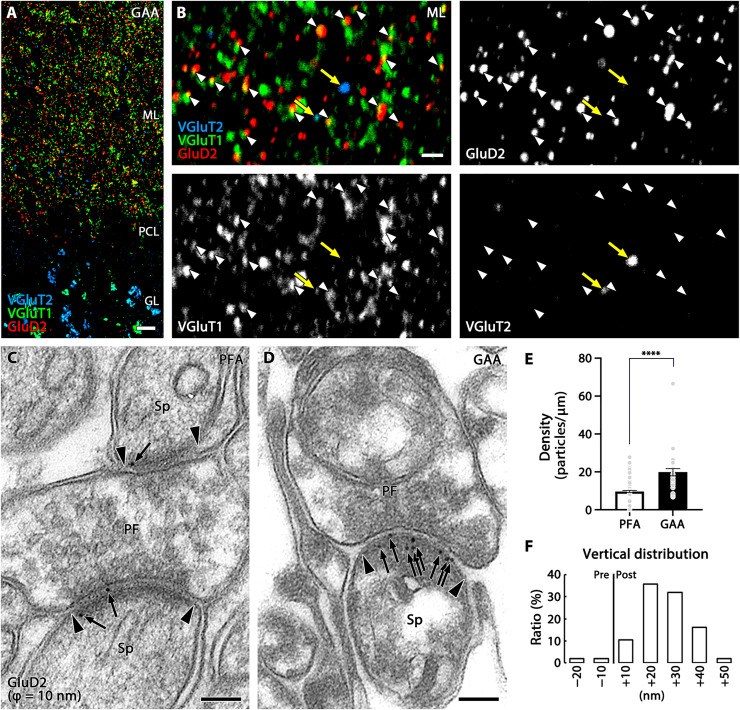
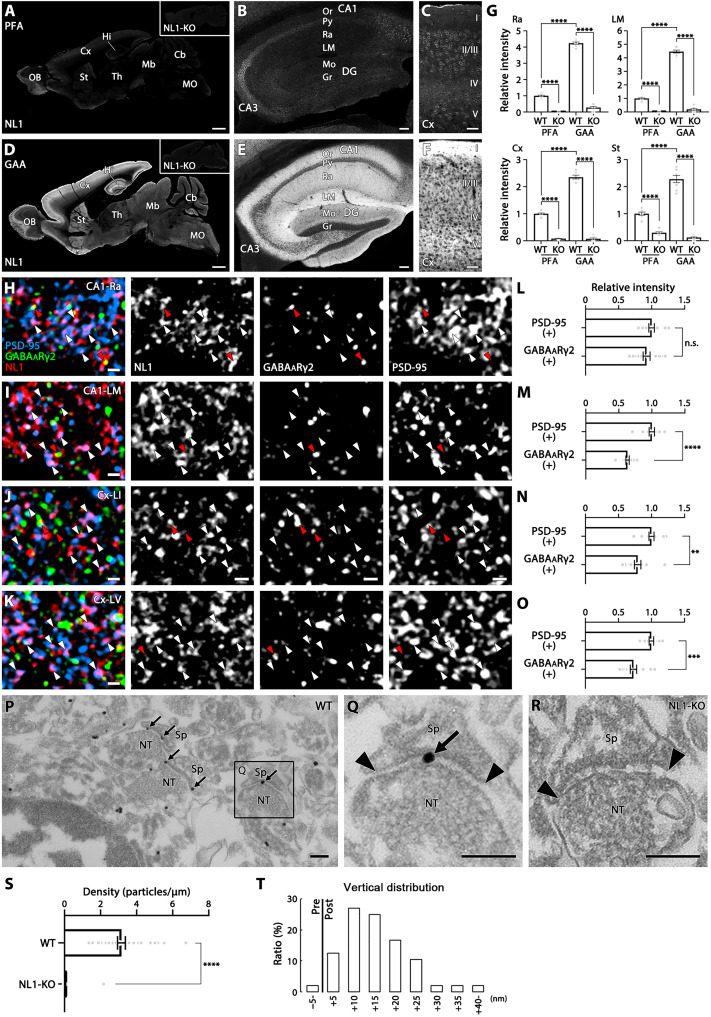
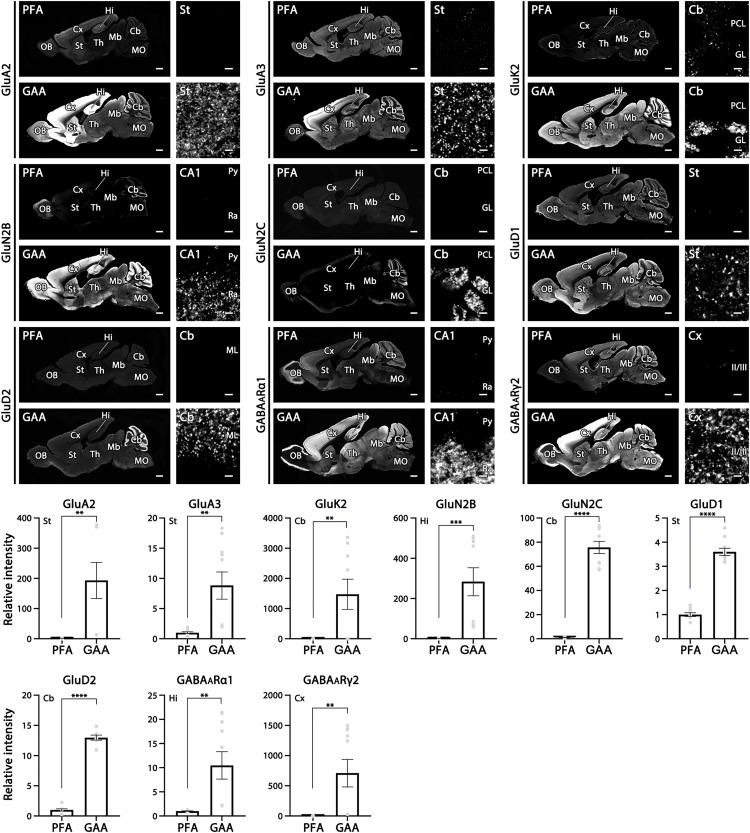
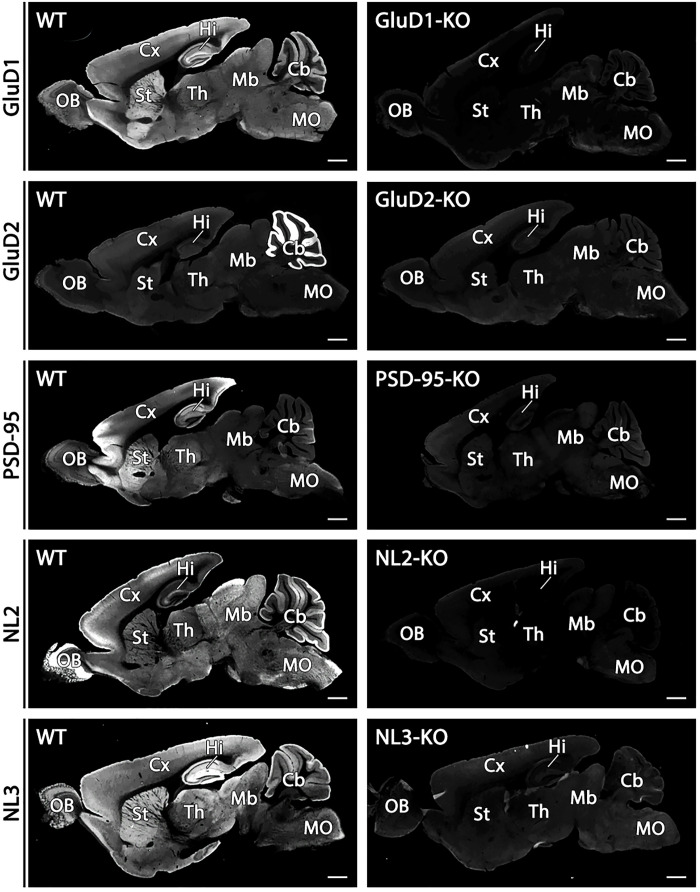
The gold-standard fixative for immunohistochemistry is 4% formaldehyde; however, it limits antibody access to target molecules that are buried within specialized neuronal components, such as ionotropic receptors at the postsynapse and voltage-gated ion channels at the axon initial segment, often requiring additional antigen-exposing techniques to detect their authentic signals. To solve this problem, we used glyoxal, a two-carbon atom di-aldehyde. We found that glyoxal fixation greatly improved antibody penetration and immunoreactivity, uncovering signals for buried molecules by conventional immunohistochemical procedures at light and electron microscopic levels. It also enhanced immunosignals of most other molecules, which are known to be detectable in formaldehyde-fixed sections. Furthermore, we unearthed several specific primary antibodies that were once judged to be unusable in formaldehyde-fixed tissues, allowing us to successfully localize so far controversial synaptic adhesion molecule Neuroligin 1. Thus, glyoxal is a highly effective fixative for immunostaining, and a side-by-side comparison of glyoxal and formaldehyde fixation is recommended for routine immunostaining in neuroscience research.


Figures

Fig. 1.
Fig. 1.. Intensified immunofluorescence signals for postsynaptic molecules in glyoxal-fixed cerebellar cortex.
(A) Immunofluorescence for AMPA receptor GluA2, GABAARα1, excitatory postsynaptic scaffold protein PSD-95, and inhibitory postsynaptic scaffold protein gephyrin in tissues fixed by 4% PFA or glyoxal with different composition (see text). Insets indicate high-magnification images in the molecular layer. Histograms showing the mean relative fluorescent intensity in each glyoxal fixative normalized to that in 4% PFA. Each data point was calculated from 10 images per mouse (n = 2 mice). (B) Marked improvement of NMDAR GluN2C immunofluorescence detection in cerebellar glomeruli of glyoxal-fixed mouse sections by adding 0.1% Triton X-100 to PBS (PBS-T). In 4% PFA (PFA)–fixed sections, no specific signals are observed in the granular layer with the use of PBS or PBS-T. In 9% glyoxal/8% acetic acid (GAA)–fixed sections, use of PBS-T markedly intensifies GluN2C signals in the granular layer. (C) Histogram showing the mean signal ratio (PBS-T/PBS) in the granular layer with PFA fixation (six images from two mice) or GAA fixation (six images from two mice). (D) Double immunofluorescence for GluN2C (magenta) and VGluT1 (green) in cerebellar synaptic glomeruli. Use of PBS-T selectively intensifies GluN2C clusters that surround VGluT1(+) huge mossy fiber terminals (*) in GAA-fixed (right) but not PFA-fixed (left) sections. GL, granular layer; ML, molecular layer; PCL, Purkinje cell layer. Scale bars, 100 μm (B); 20 μm (A); 2 μm [A (inset) and D]. The data are shown as the means ± SEM. For detailed statistics see, Table S2 and S3.
Fig. 2.
Fig. 2.. Improved immunostaining by GAA fixation in the cerebellar cortex of marmoset brains.
(A and B) VGluT2 labeling in PFA- (A) or GAA-fixed (B) cerebellum. (C and D) AMPAR labeling in PFA- (C) or GAA-fixed (D) cerebellum. Insets show enlarged images of the cerebellar molecular layer. (E) Histogram showing the mean relative ratio in GAA-fixed sections normalized to PFA-fixed sections in the cerebellar molecular layer (10 images from two marmosets). For detailed statistics, see Table S2 and S3. For abbreviations, see Fig. 1. Scale bars, 5 μm (A to D) (inset, 2 μm).
Fig. 3.
Fig. 3.. Improved immunostaining for NMDAR GluN1 by GAA fixation of mouse brains.
(A to F) Immunofluorescence in PFA- (A to C) or GAA-fixed (D to F) brain (A and D), hippocampus (B and E), and CA1 region (C and F). (G) Histogram showing the mean relative intensity in GAA-fixed sections normalized to PFA-fixed sections in the CA1 stratum oriens (Or) and radiatum (Ra). Data were calculated from three images per mouse (n = 2 mice). (H and I) Pre-embedding silver-enhanced immunogold labeling in the CA1 stratum radiatum in PFA- (H) or GAA-fixed (I) hippocampus. Arrows and arrowheads indicate immunogold labeling and the edge of the postsynaptic density, respectively. (J) Histogram showing the mean labeling density of immunogold particles for GluN1 per 1 μm of the postsynaptic membrane at axo-spinous synapses in PFA- (n = 66 synapses from two mice) or GAA-fixed (n = 62 synapses from two mice) CA1 stratum radiatum. (K) The vertical distribution of the center of immunoparticles (n = 58 particles from two mice) at axo-spinous synapses of GAA-fixed CA1 stratum radiatum. In the ordinate, − and + represent the presynaptic and postsynaptic side, respectively, from the midline of the synaptic cleft. The distribution of immunogold particles for GluN1 peaks in a +10- to +20-nm postsynaptic bin, with a mean distance of +14.7 ± 1.2 nm. For detailed statistics, see Table S2 and S3. CA1–3, CA1–3 regions of Ammon’s horn; Cb, cerebellum; Cx, cortex; DG, dentate gyrus; Gr, granule cell layer; Hi, hippocampus; LM, stratum lacunosum-moleculare; Mb, midbrain; MO, medulla oblongata; Mo, molecular layer; NT, nerve terminal; OB, olfactory bulb; Or, stratum oriens; Pl, polymorphic cell layer; Py, pyramidal cell layer; Ra, stratum radiatum; Sp, spine; St, striatum; Th, thalamus. Scale bars, 1 mm (A and D); 100 μm (B and E); 10 μm (C and F) (inset, 2 μm); 200 nm (H and I).
Fig. 4.
Fig. 4.. Deep z-axis imaging of AMPAR by GAA fixation in the mouse cerebellar cortex.
(A to H and L to O) Immunofluorescence for AMPAR (magenta), VGluT2 (blue), and calbindin (green) in PFA- (A to D) or GAA-fixed (E to H and L to O) cerebellar sections. PFA-fixed sections were subjected to pepsin digestion before immunostaining (A to D). Consecutive images along the z axis [0.2-μm steps, (A) to (H); 1-μm steps, (L) to (O)] were captured. Boxed regions in (A) to (H) are enlarged in (a) to (h), and AMPAR signals are separately shown in white. See also fig. S6 for faint surface signals of glial AMPAR in pepsin-undigested PFA-fixed sections and fig. S7 (D to F) for deeper imaging of synaptic AMPAR from the surface (0 μm) to −50 μm deep in GAA-fixed 100-μm-thick sections. (I and J) Histograms showing the mean relative intensity of AMPAR along the z axis (0 to −1.8-μm depth) in PFA- (I) or GAA-fixed (J) sections. The mean relative intensity at the surface is defined as 1.0, and statistically significant decreases at deeper regions are shown by *P < 0.05 and ****P < 0.0001. Data were calculated from three images per mouse (n = 2 mice). (K) Histogram showing the apposition rate of VGluT2(+) presynaptic and AMPAR(+) postsynaptic puncta at 0 to −1.8 μm deep. The xy, xz, and yz planes of images (L and N) and 3D-recontructed images (M and O) of GAA-fixed 100-μm-thick cerebellar sections, to which the tissue clearing method of ScaleS was applied after immunoreaction (L and M) or the tissue clearing method of AbScale was applied during immunoreaction (N and O). For detailed statistics, see Table S2 and S3. Scale bars, 20 μm (L and N); 10 μm (A to H).
Fig. 5.
Fig. 5.. Signal intensification in postembedding immunofluorescence and immunogold labeling of GluD2 in GAA-fixed mouse cerebellum.
(A and B) Triple immunofluorescence for GluD2 (red), VGluT1 (green), and VGluT2 (blue) in ultrathin Lowicryl sections of GAA-fixed cerebellar cortex. Improved spatial resolution and signal intensity allow apposition of GluD2 clusters to VGluT1(+) parallel fiber terminals (white arrowheads), but not to VGluT2(+) climbing fiber terminals (yellow arrows), to be clearly demonstrated. (C and D) Post-embedding immunogold electron microscopy for GluD2 (ϕ = 10 nm) in PFA- (C) or GAA-fixed (D) ultrathin Lowicryl sections. Arrows and arrowheads indicate immunogold labeling and the edge of the postsynaptic density, respectively. (E) Histogram showing the mean density of immunogold particles for GluD2 per 1 μm of the postsynaptic membrane obtained from n = 159 synapses from two mice (PFA) and 32 synapses from two mice (GAA). (F) Histogram showing the vertical distribution of GluD2 immunogold at parallel fiber-Purkinje cell synapses in GAA-fixed ultrathin Lowicryl sections. See legend for Fig. 3K for measurement method. The distribution of immunogold particles (n = 106 particles from two mice) peaked in a +10- to +20-nm postsynaptic bin, with a mean distance of +19.54 ± 1.09 nm from the midline of the synaptic cleft. For detailed statistics, see Table S2 and S3. PF, parallel fiber terminal; Sp, dendritic spine. For other abbreviations, see Fig. 1. Scale bars, 10 μm (A); 2 μm (B); 100 nm (C and D).
Fig. 6.
Fig. 6.. Visualization of specific immunosignals for synaptic adhesion molecule NL1 in GAA-fixed mouse brains.
(A to F) Immunofluorescence for NL1 in PFA- (A to C) or GAA-fixed (D to F) brain (A and D), hippocampus (B and E), and cortex (C and F). (G) Histograms showing that the mean relative intensity is significantly increased in GAA-fixed CA1 stratum radiatum, CA1 stratum lacunosum-moleculare, cortex, and striatum than in PFA-fixed ones. The intensity of PFA-fixed wild-type mice is defined as 1.0. Data were measured from five images per mouse (n = 2 mice). (H to K) Triple immunofluorescence for NL1 (red), PSD-95 (blue), and GABAARγ2 (green) in the stratum radiatum (H) and stratum lacunosum-moleculare (I) of the hippocampal CA1, and in layers 1 (J) and 5 (K) of the somatosensory cortex. White and red arrowheads indicate NL1 clusters that are apposed to PSD-95- or GABAARγ2-positive clusters, respectively. (L to O) Histograms showing that the mean relative intensity of NL1 clusters apposing to PSD-95(+) clusters or GABAARγ2(+) clusters in the CA1 stratum radiatum (L, PSD-95 clusters, n = 1567; GABAARγ2 clusters, n = 1049, from two mice), CA1 lacunosum-moleculare (M, 1801, 1436, from two mice), and in layer 1 (N, 1346, 1186 from, two mice) and layer 5 (O, 1393, 741, from two mice) of the somatosensory cortex. The intensity of NL1 clusters apposing to PSD-95 clusters is defined as 1.0. n.s., not significant. (P to R) Pre-embedding silver-enhanced immunogold labeling in the CA1 stratum radiatum in GAA-fixed wild-type (P and Q) or NL1-knockout (R) mice. Arrows and arrowheads indicate immunogold labeling and the edge of the postsynaptic density, respectively. (S) Histogram showing the mean labeling density of immunogold particles for NL1 per 1 μm of the postsynaptic membrane at axo-spinous synapses of GAA-fixed CA1 stratum radiatum in wild-type (n = 37 synapses from two mice) or NL1-knockout (n = 69 synapses from two mice) mice. (T) The vertical distribution of the center of immunoparticles (n = 48 particles from two mice) at axo-spinous synapses of GAA-fixed CA1 stratum radiatum. See legend for Fig. 3K for measurement method. For detailed statistics, see Table S2 and S3. For abbreviations, see Fig. 3. Scale bars, 1 mm (A and D); 100 μm (B and E); 50 μm (C and F); 1 μm (H to K); 200 nm (P to R).
Fig. 7.
Fig. 7.. Significant intensification of immunofluorescence signals for nine ionotropic receptors in the mouse brain.
For each molecule, left panels show overall staining patterns in parasagittal brain sections and right panels show magnified images from representative regions of the brain. Compared with PFA fixation, the mean relative intensity is significantly increased by GAA fixation for AMPAR GluA2 in the striatum, AMPAR GluA3 in the striatum, kainate-type glutamate receptor GluK2 in the cerebellum, NMDAR GluN2B in hippocampal CA1, NMDAR GluN2C in the cerebellum, delta family GluD1 in the striatum, delta family GluD2 in the cerebellum, GABAARα1 in hippocampal CA1, and GABAARγ2 in the somatosensory cortex. Data are the average of five images per mouse (n = 2 mice) and the total measured area was 0.14 mm2. For detailed statistics, see Table S2 and S3. See Figs. 1 and Fig. 3 for abbreviations. Scale bars, 1 mm (low-magnification left panels) and 2 μm (high-magnification right panels).
Fig. 8.
Fig. 8.. Specificity for immunofluorescent signals for GluD1, GluD2, PSD-95, NL2, and NL3.
The specificity of immunosignals in wild-type mouse brains is verified by the absence in respective knockout mouse brains. Scale bars, 1 mm.

References

    1. K. Konno, M. Watanabe, Immunohistochemistry for ion channels and their interacting molecules: Tips for improving antibody accessibility, in Receptor and Ion Channel Detection in the Brain. Methods and Protocols (Neuromethods, Springer, 2016), vol. 110, pp. 171–178.
    1. A. Lorincz, Z. Nusser, Cell-type-dependent molecular composition of the axon initial segment. J. Neurosci. 28, 14329–14340 (2008). - PMC - PubMed
    1. A. Baude, E. Molnár, D. Latawiec, R. A. McIlhinney, P. Somogyi, Synaptic and nonsynaptic localization of the GluR1 subunit of the AMPA-type excitatory amino acid receptor in the rat cerebellum. J. Neurosci. 14, 2830–2843 (1994). - PMC - PubMed
    1. A. Baude, Z. Nusser, E. Molnár, R. A. McIlhinney, P. Somogyi, High-resolution immunogold localization of AMPA type glutamate receptor subunits at synaptic and non-synaptic sites in rat hippocampus. Neuroscience 69, 1031–1055 (1995). - PubMed
    1. M. Watanabe, M. Fukaya, K. Sakimura, T. Manabe, M. Mishina, Y. Inoue, Selective scarcity of NMDA receptor channel subunits in the stratum lucidum (mossy fibre-recipient layer) of the mouse hippocampal CA3 subfield. Eur. J. Neurosci. 10, 478–487 (1998). - PubMed