. 2023 Jul 25;95(29):10957-10965.
doi: 10.1021/acs.analchem.3c00979. Epub 2023 Jul 14.

Weakly Supervised Identification and Localization of Drug Fingerprints Based on Label-Free Hyperspectral CARS Microscopy

Affiliations

Weakly Supervised Identification and Localization of Drug Fingerprints Based on Label-Free Hyperspectral CARS Microscopy

Jindou Shi et al. Anal Chem. .

Abstract

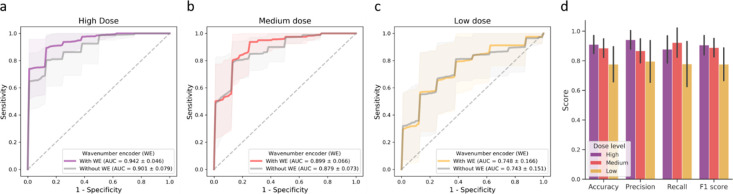
Understanding drug fingerprints in complex biological samples is essential for the development of a drug. Hyperspectral coherent anti-Stokes Raman scattering (HS-CARS) microscopy, a label-free nondestructive chemical imaging technique, can profile biological samples based on their endogenous vibrational contrast. Here, we propose a deep learning-assisted HS-CARS imaging approach for the investigation of drug fingerprints and their localization at single-cell resolution. To identify and localize drug fingerprints in complex biological systems, an attention-based deep neural network, hyperspectral attention net (HAN), was developed. By formulating the task to a multiple instance learning problem, HAN highlights informative regions through the attention mechanism when being trained on whole-image labels. Using the proposed technique, we investigated the drug fingerprints of a hepatitis B virus therapy in murine liver tissues. With the increase in drug dosage, higher classification accuracy was observed, with an average area under the curve (AUC) of 0.942 for the high-dose group. Besides, highly informative tissue structures predicted by HAN demonstrated a high degree of similarity with the drug localization shown by the in situ hybridization staining results. These results demonstrate the potential of the proposed deep learning-assisted optical imaging technique for the label-free profiling, identification, and localization of drug fingerprints in biological samples, which can be extended to nonperturbative investigations of complex biological systems under various biological conditions.


Conflict of interest statement

The authors declare the following competing financial interest(s): The GSK Center for Optical Molecular Imaging, its personnel, and the projects that are pursued are supported financially through an academic-industry partnership grant between the University of Illinois at Urbana-Champaign and GSK. A.A., B.S.D., J.M., and S.R.H. are employees and shareholders of GSK. J.S., K.B., P.M., E.J.C., M.M., D.R.S., and S.A.B. declare no potential conflict of interest.

Figures

Figure 1
Figure 1
Experimental design and workflow. (a) Demonstrates the workflow of the investigation of drug treatment effect using HS-CARS microscopy and weakly supervised deep learning. An HS-CARS image of a murine liver sample is shown in (b). (c) Proposed weakly supervised deep learning model is trained on whole-image-level labels. (d) After training, the model is able to highlight informative regions that are highly relevant to the whole-image classification task. PMT, photomultiplier tube.
Figure 2
Figure 2
HAN model architecture. The HAN consists of a wavenumber encoder, a one dimensional convolutional neural network (CNN), an attention module, and a multilayer perceptron (MLP)-based classifier. The input and output of each component are shown as 3D blocks, of which the dimensions are noted (H: image height, W: image width, L: spectrum length, N: number of spectra, F: length of the feature representation).
Figure 3
Figure 3
Classification evaluation on synthetic HS-CARS datasets. Three types of spectral differences, including changes in peak height (a, b), peak location (c, d), and peak width (e, f), were simulated. In (a, c, e), solid lines represent individual Lorentzian components in the synthetic CARS spectra, with gray lines being the unchanged components and rainbow-colored lines (dark red to purple) showing the changes of the tunable component. The final spectra (before introducing noise) are shown as dashed lines. The classification results of each experiment are shown in (b, d, f), where box-and-whisker plots show the distribution of area under the curve (AUC) scores. Each black dot in the plots represents the result of one cross-validation fold (4 folds in total) in every experiment.
Figure 4
Figure 4
Localization predictions of discriminative objects with increased peak height in synthetic HS-CARS images. The results are shown in columns a–d, where the peak height of the tunable Lorentzian component was increased by 2, 8, 32, and 128%, respectively. The noise-contaminated spectra of pixels in background (BG), nondiscriminative (A), and discriminative (B) objects are shown in the top row, with the horizontal axis representing Raman shift (cm–1) and the vertical axis representing the CARS intensity (a.u.). The frames at the peak location of the tunable component in the positive images are shown in the second row. The ground truth (GT) masks in the third row show the locations of discriminative objects, while the min-max normalized attention heatmaps produced by the HAN models are shown in the last row.
Figure 5
Figure 5
Classification evaluation on the ASO murine liver dataset. (a–c) ROC curves for each dose group. The average ROC curves for the 10-fold cross validation are shown as solid lines, while the interval regions show the standard derivation. Additional classification metrics, including accuracy, precision, recall, and F1 score, are shown in (d), with the error bar representing the standard derivation.
Figure 6
Figure 6
Highly informative hepatic regions predicted by the HAN. (a) H&E histology image of a murine liver sample from the high-dose group. (b) An ISH image showing the distribution of the ASO drug in the high-dose murine liver sample. (c) HS-CARS images (sum of all spectral frames) from six randomly sampled FOVs of high-dose treatment samples; their corresponding attention heatmaps are shown in the top and bottom rows. The HS-CARS images are overlaid with their attention heatmaps in the middle row.
Figure 7
Figure 7
CARS spectral profiles of regions at different attention levels. (a) By quantizing the attention scores to five levels, the attention heatmaps were divided into five attention-ranked regions (i.e., low, low-medium, medium, medium-high, and high). The normalized HS-CARS spectral profiles of regions at different attention levels are shown in (b).
Figure 8
Figure 8
CARS spectral ROIs informed by class activation maps. (a) three-dimensional class activation array of a predicted positive HS-CARS image from the high-dose group. When taking the attention scores into account, the resulting attention-weighted class activation array is shown in (b). (c) Attention scores (left) and class activation maps (right) of 10,000 randomly sampled spectra from HS-CARS images in the high-dose group. The class activation maps are sorted by their corresponding attention scores. (d) Four CARS spectra at different attention levels [(1)–(4)] are visualized on top of their class activation maps.

References

    1. Lanao J.; Fraile M. Drug tissue distribution: study methods and therapeutic implications. Curr. Pharm. Des. 2005, 11, 3829–3845. 10.2174/138161205774580679. - DOI - PubMed
    1. Mouton J. W.; Theuretzbacher U.; Craig W. A.; Tulkens P. M.; Derendorf H.; Cars O. Tissue concentrations: do we ever learn?. J. Antimicrob. Chemother. 2008, 61, 235–237. 10.1093/jac/dkm476. - DOI - PubMed
    1. Solon E. G. Use of radioactive compounds and autoradiography to determine drug tissue distribution. Chem. Res. Toxicol. 2012, 25, 543–555. 10.1021/tx200509f. - DOI - PubMed
    1. Solon E. G. Autoradiography techniques and quantification of drug distribution. Cell Tissue Res. 2015, 360, 87–107. 10.1007/s00441-014-2093-4. - DOI - PubMed
    1. Swales J. G.; Hamm G.; Clench M. R.; Goodwin R. J. Mass spectrometry imaging and its application in pharmaceutical research and development: A concise review. Int. J. Mass Spectrom. 2019, 437, 99–112. 10.1016/j.ijms.2018.02.007. - DOI

Publication types