. 2023 Aug 8;56(8):1825-1843.e6.
doi: 10.1016/j.immuni.2023.06.017. Epub 2023 Jul 13.

Hypoxic niches attract and sequester tumor-associated macrophages and cytotoxic T cells and reprogram them for immunosuppression

Affiliations

Hypoxic niches attract and sequester tumor-associated macrophages and cytotoxic T cells and reprogram them for immunosuppression

Anirudh Sattiraju et al. Immunity. .

Abstract

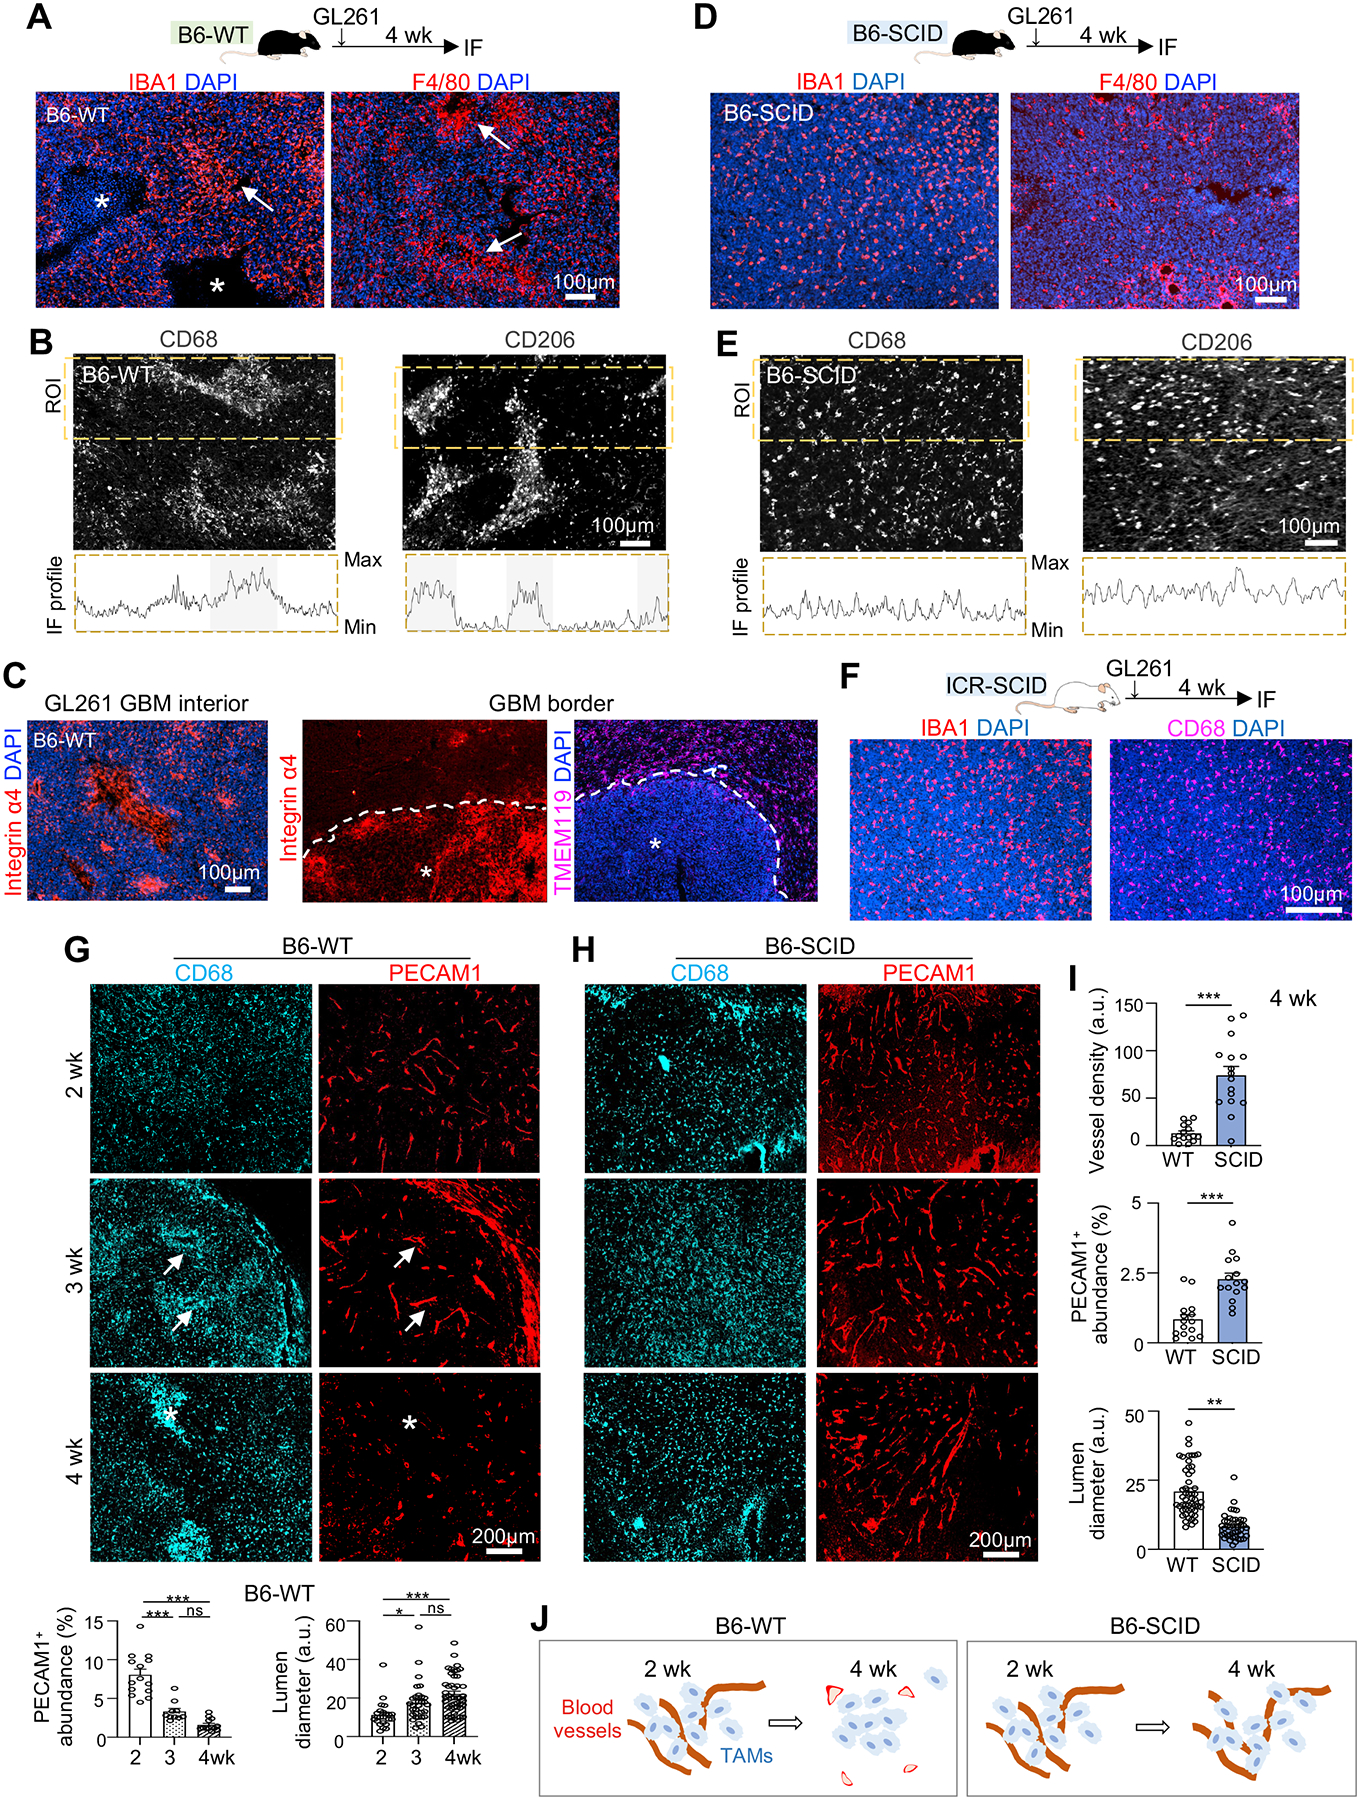
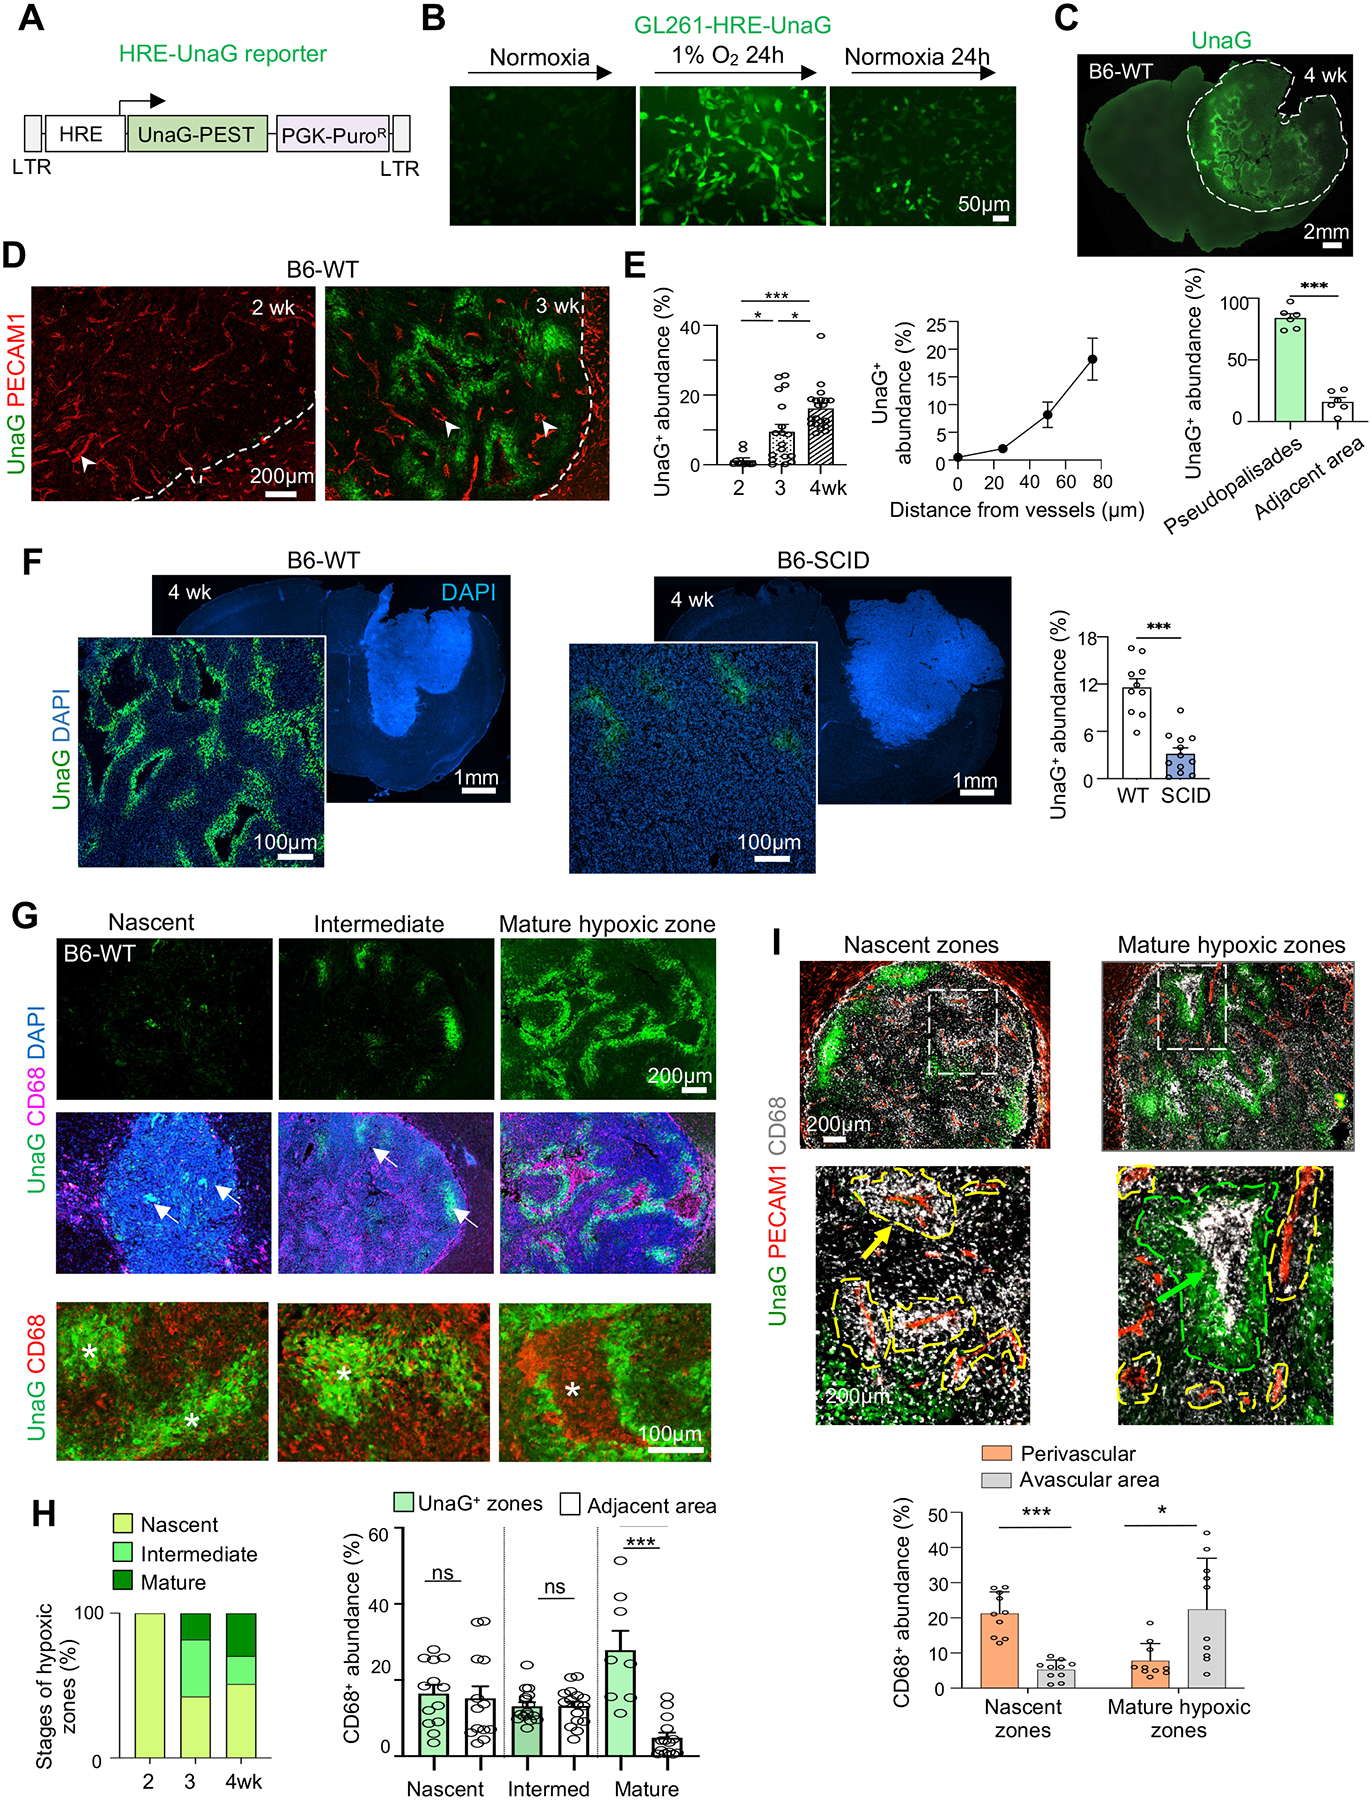
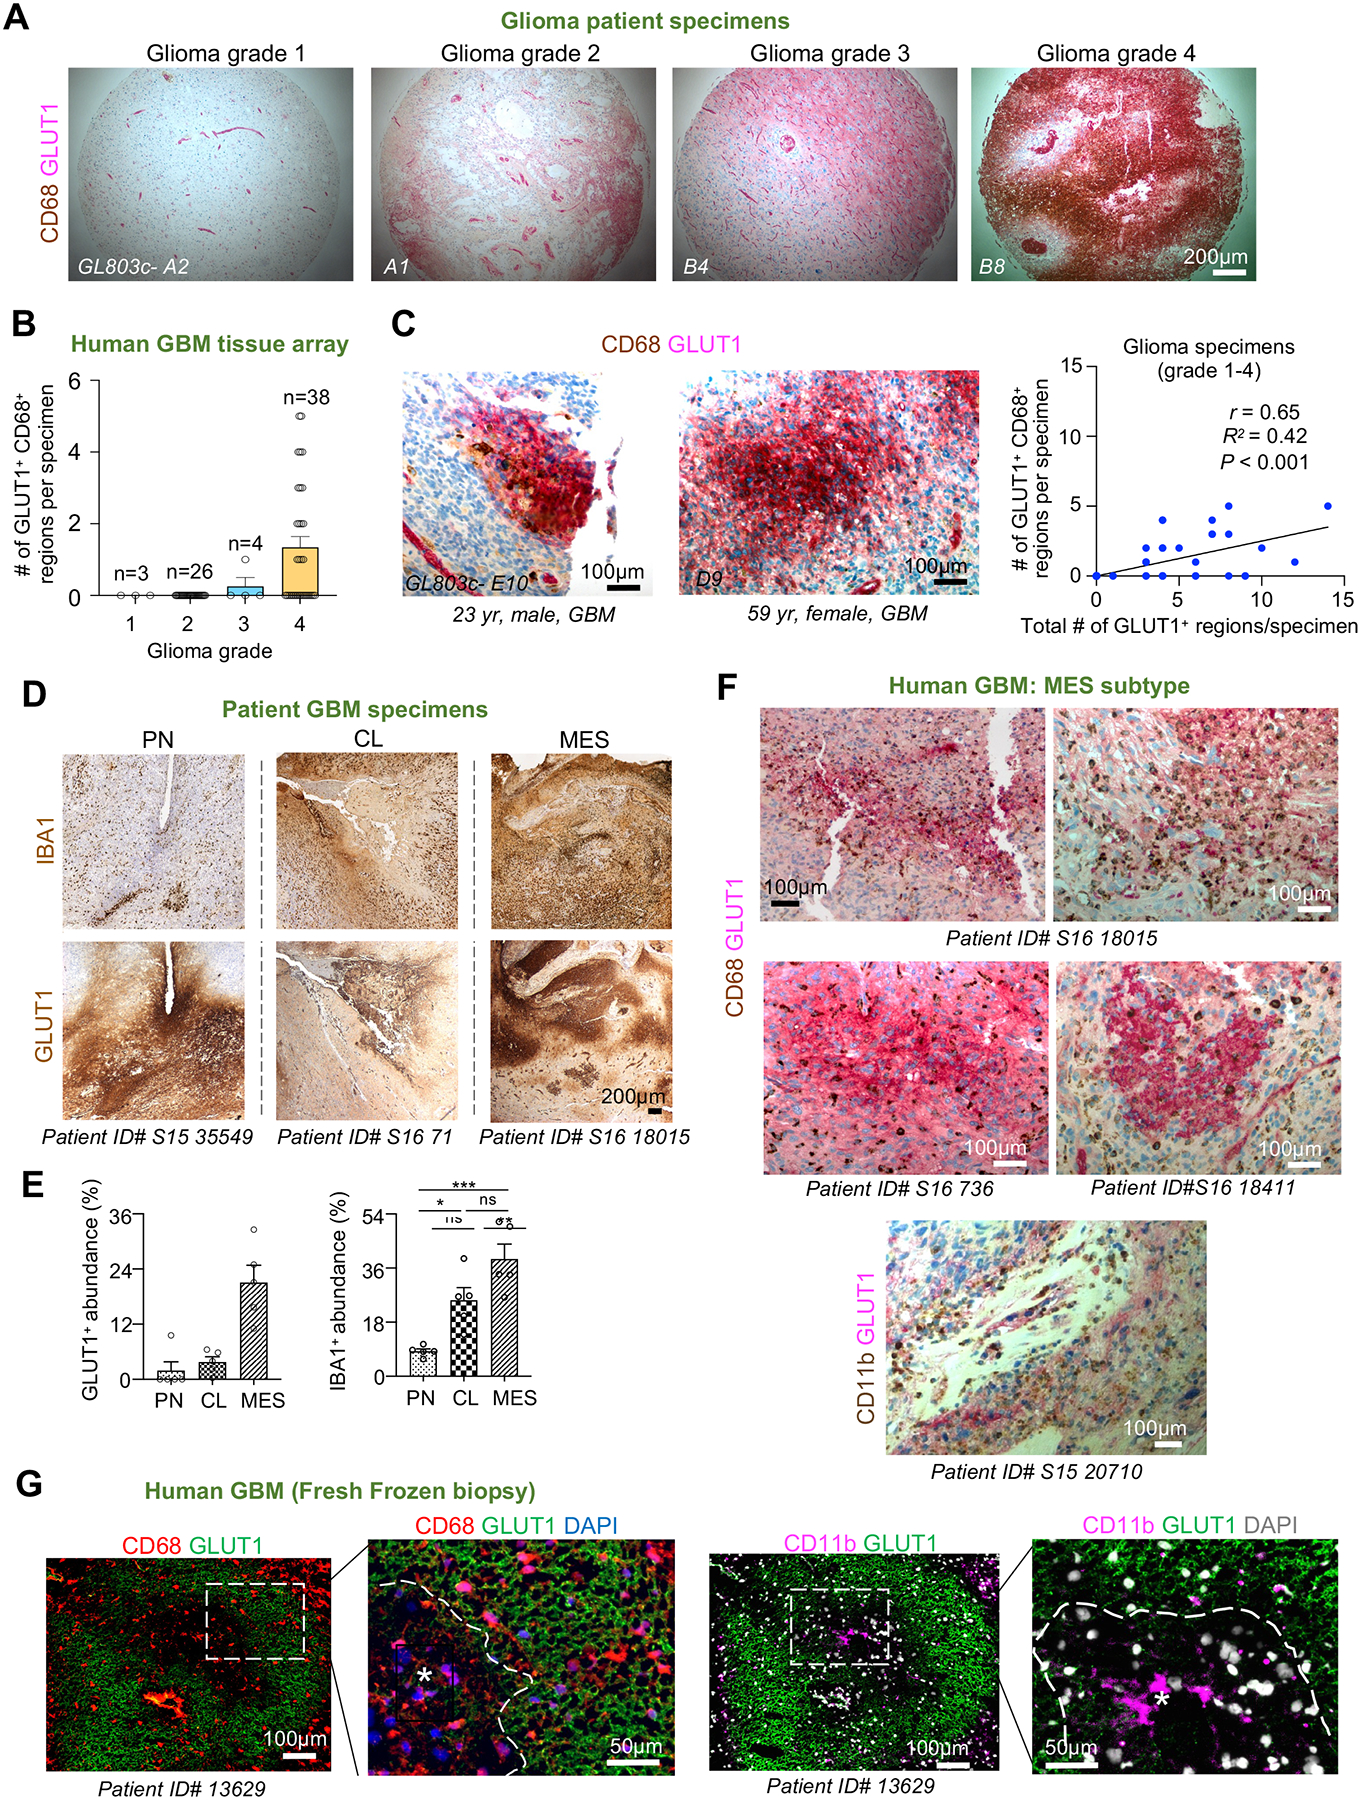
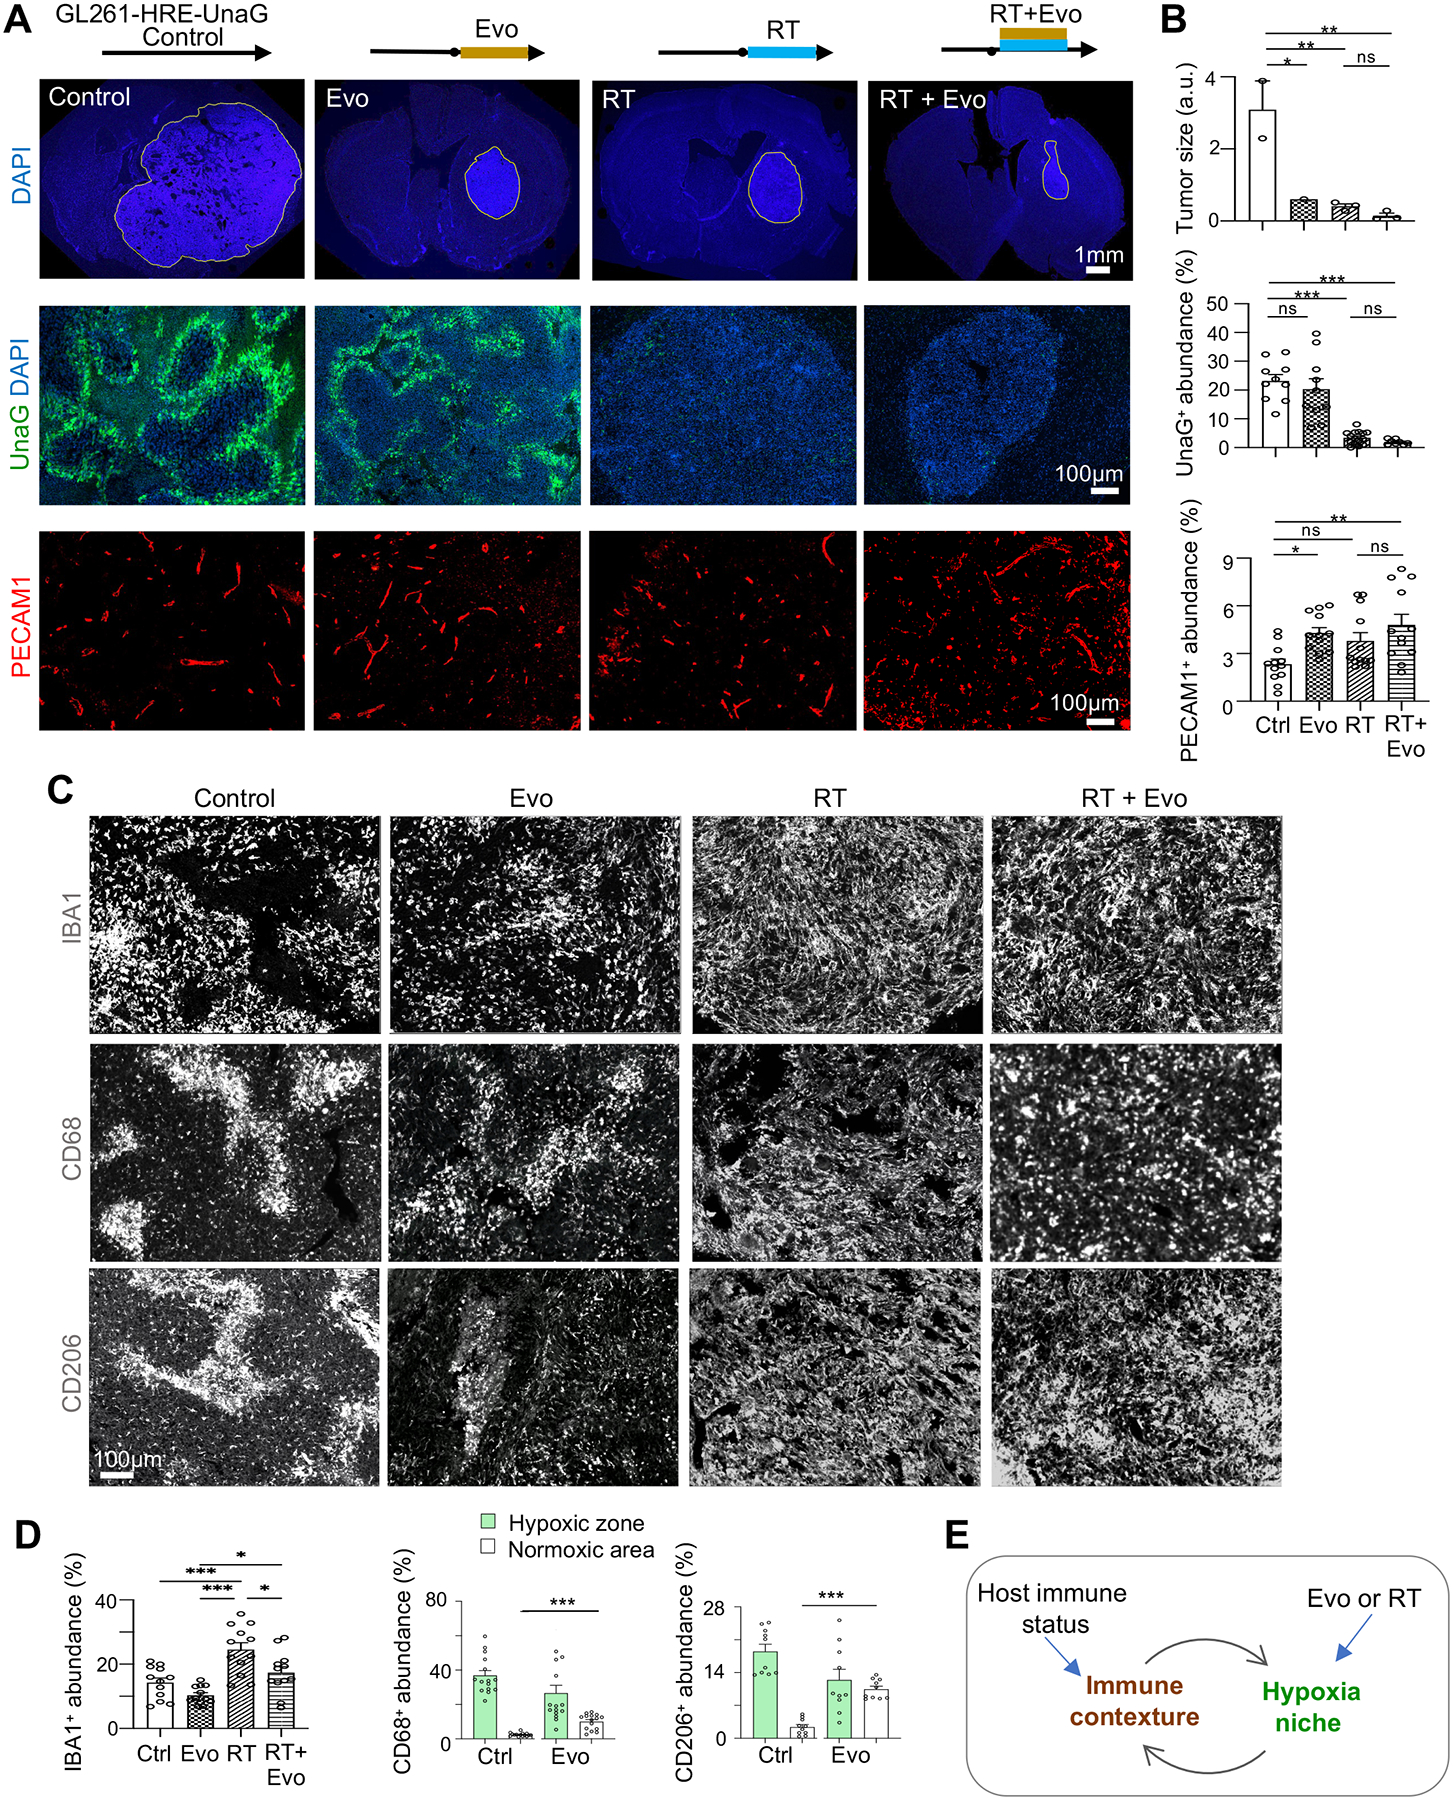
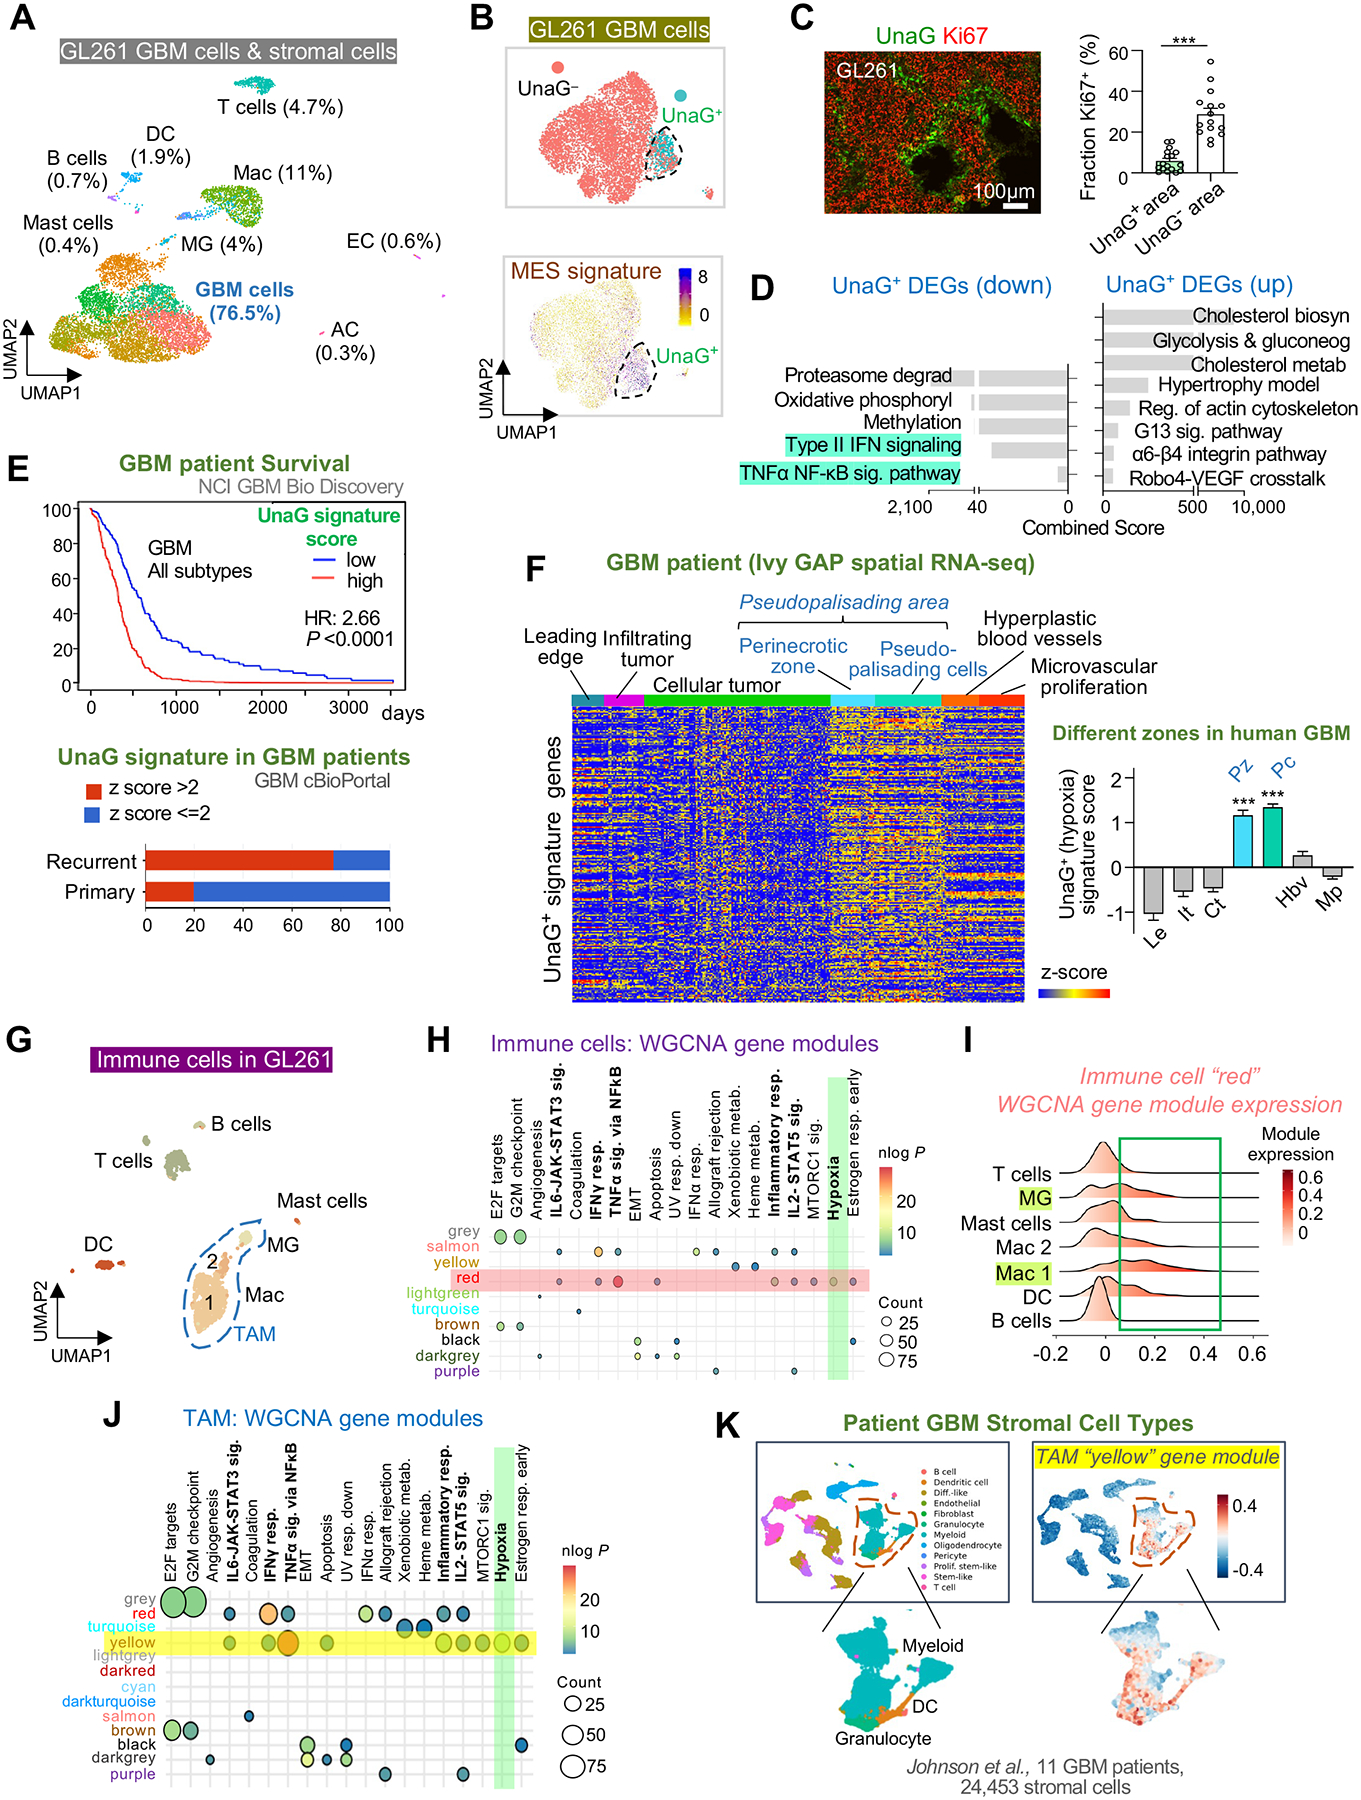
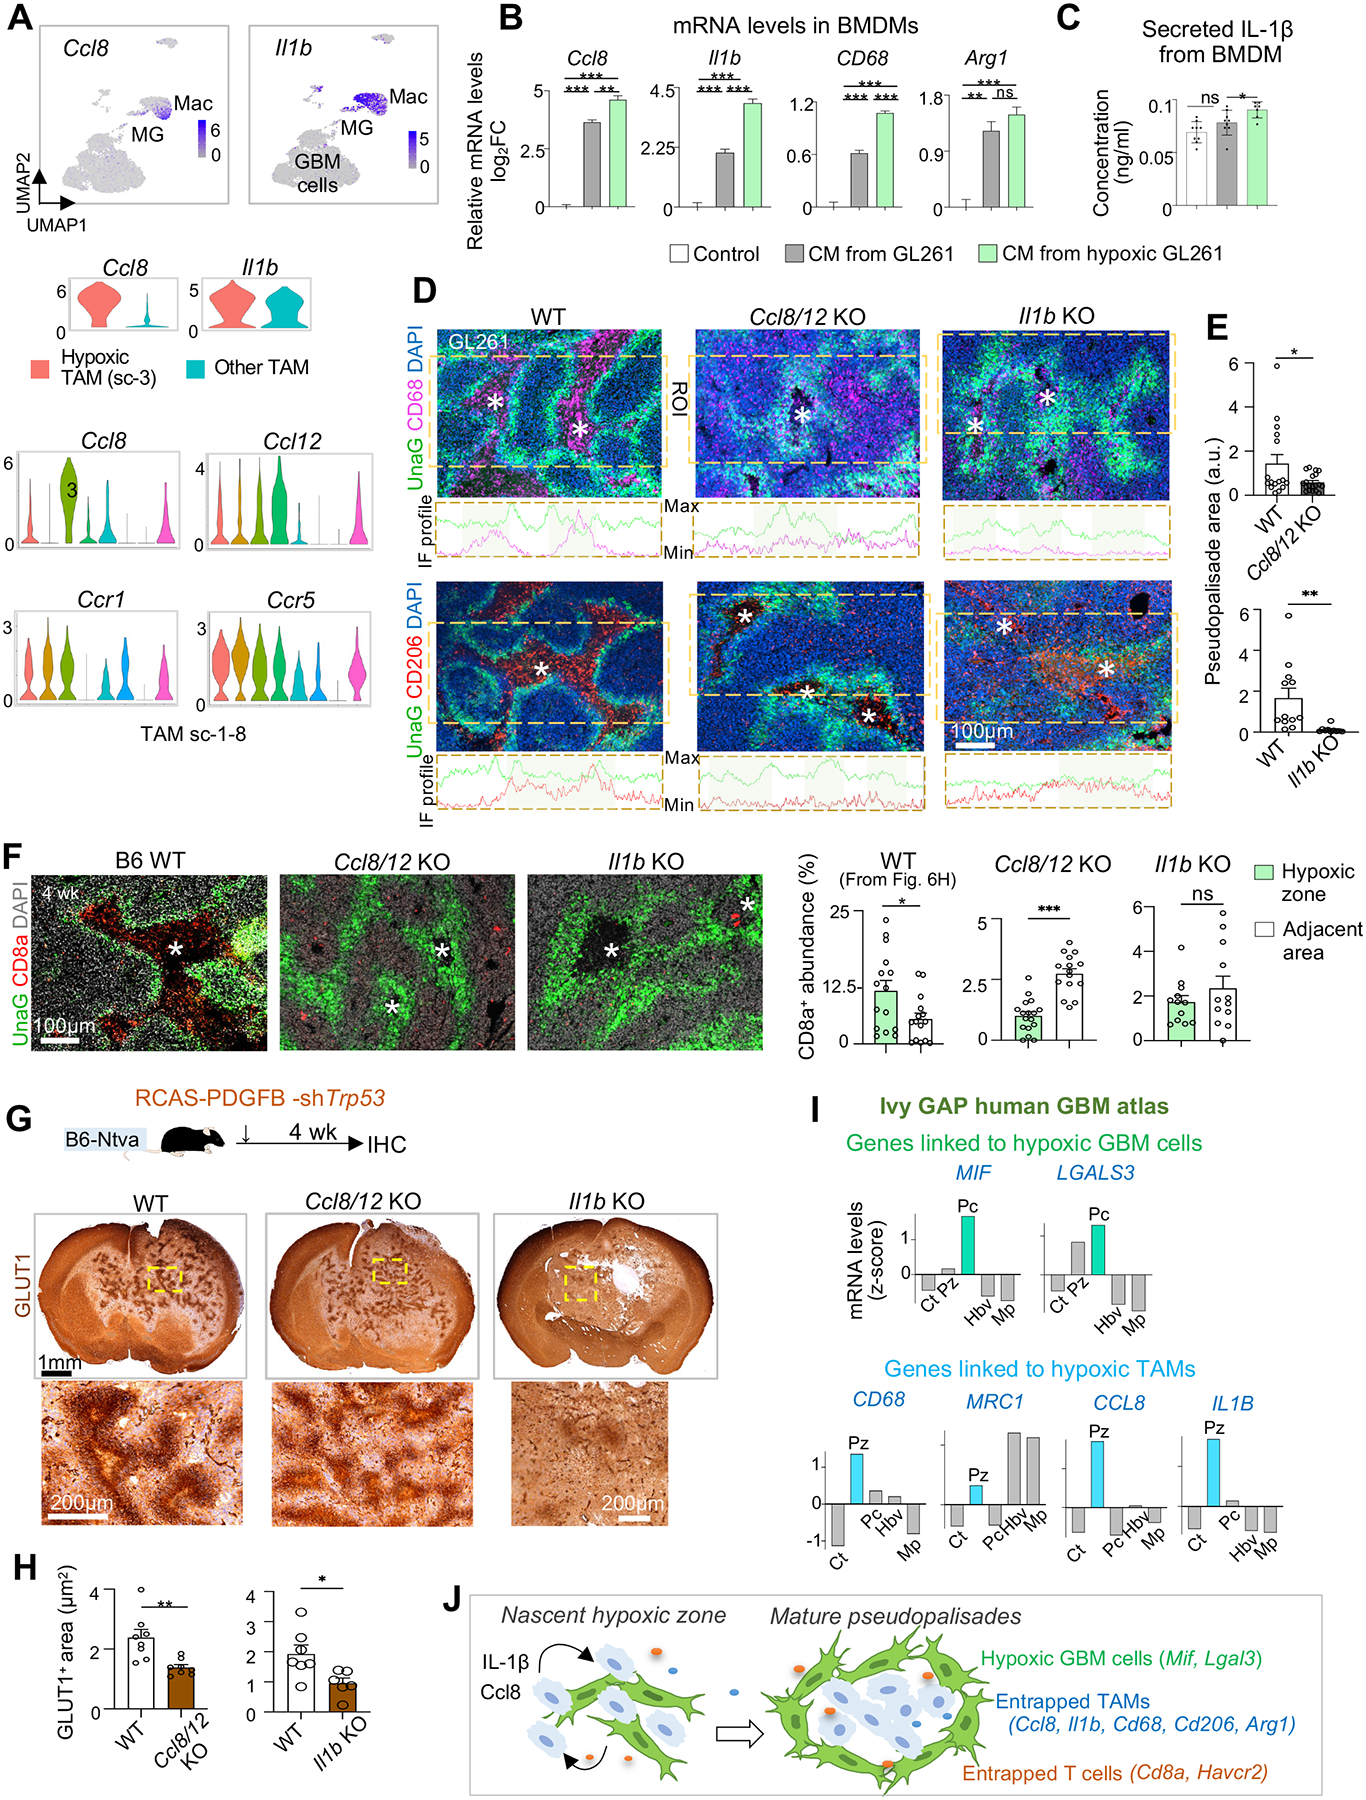
Glioblastoma (GBM), a highly lethal brain cancer, is notorious for immunosuppression, but the mechanisms remain unclear. Here, we documented a temporospatial patterning of tumor-associated myeloid cells (TAMs) corresponding to vascular changes during GBM progression. As tumor vessels transitioned from the initial dense regular network to later scant and engorged vasculature, TAMs shifted away from perivascular regions and trafficked to vascular-poor areas. This process was heavily influenced by the immunocompetence state of the host. Utilizing a sensitive fluorescent UnaG reporter to track tumor hypoxia, coupled with single-cell transcriptomics, we revealed that hypoxic niches attracted and sequestered TAMs and cytotoxic T lymphocytes (CTLs), where they were reprogrammed toward an immunosuppressive state. Mechanistically, we identified chemokine CCL8 and cytokine IL-1β as two hypoxic-niche factors critical for TAM trafficking and co-evolution of hypoxic zones into pseudopalisading patterns. Therefore, perturbation of TAM patterning in hypoxic zones may improve tumor control.

Keywords: CCL8; CTLs; GBM; IL-1β; TAM; cytotoxic T lymphocytes; immune landscape; immunosuppression; tumor hypoxia; tumor vasculature; tumor-associated microglia/macrophages.


Conflict of interest statement

Declaration of interests The authors declare no competing interests.

Figures

Figure 1.
Figure 1.. Temporospatial patterning of TAMs parallels vascular changes during GBM progression and is influenced by host immunocompetence status.
(A) Top, experimental scheme of intracranial transplant of GL261 GBM cells into C57BL/6 wild-type (B6-WT) hosts and IF analysis 4 weeks later. Bottom, representative IF images from n=3 mice show spatial patterning of IBA1+ and F4/80+ TAMs. Asterisks, necrotic cores; arrows, TAM aggregates. (B) IF images and profile plots of IF intensities of CD68 or CD206 within region of interest (ROI, dashed boxes). (C) IF images of MDM (integrin α4+) or microglia (TMEM119+) in GBM interior (asterisks) or GBM border (dashed line) at 4 weeks post-transplant in B6-WT host. (D) Top, experimental scheme of GL261 transplanted into C57BL/6-SCID (B6-SCID) hosts and IF analysis 4 weeks later. Bottom, representative IF images from n=3 mice show distribution of TAMs (IBA1+ or F4/80+). (E) IF images and profile plots of IF intensities of CD68+ and CD206+ TAMs within ROI in B6-SCID host. (F) Representative IF images show distribution of IBA1+ and CD68+ TAMs in GL261 established in ICR-SCID host (n=3 mice). (G-I) IF images and quantifications of vascular changes and temporospatial transition of CD68+ TAMs in distinct zones of GL261 GBM established in B6-WT host (G) or B6-SCID host (H). Quantifications in bottom of (G): PECAM1 abundance, n=10 tumor areas; lumen diameter, n=30 tumor areas, from n=3 mice per timepoint. One-way ANOVA; a.u., arbitrary units. Quantification of vascular comparison (I): n=15 randomly chosen tumor areas from n=5 mice per group; unpaired t-test. *P<0.05; **P<0.01; ***P<0.001; ns, not significant. (J) Diagrams depicting TAM spatial patterning in parallel to vascular changes in dependence of host immune status.
Figure 2.
Figure 2.. TAM trafficking coincides with the emergence of hypoxic zones and development of pseudopalisades in GBM.
(A) Diagram of lentiviral HRE-UnaG reporter. (B) Representative images of UnaG expression in GL261 cells (stably transduced with lenti-HRE-UnaG) when exposed to 1% O2 or normoxia. n=3 cultures. (C) Fluorescent image and quantification of UnaG+ cells in pseudopalisading or adjacent areas of GL261-HRE-UnaG GBM established in B6-WT host at 4 wk post-transplant. n=6 tumor areas from 4 mice. (D) Representative IF images from n=3 mice show emergence of UnaG+ tumor cells between 2–3 weeks post-transplant in vascular poor areas. Arrowheads point to tumor vasculatures with engorged lumen. (E) Left, quantification of UnaG+ areas during GBM progression. n=10 tumor areas from 3 mice per timepoint. Right, quantification of UnaG abundance in relation to the distance from blood vessels. n=11 tumor fields for each distance. (F) Representative IF images from n=3 mice show an overview of GBM burden (DAPI at low magnification) and hypoxic zones (UnaG at high magnification) in B6-SCID vs. B6-WT hosts. Quantification: n= 10 tumor areas from 3 mice per group. (G, H) Top two rows, IF images show transition of hypoxic zones (UnaG+) from nascent (arrows) to mature pseudopalisades and corresponding spatial patterns of CD68+ TAMs during GL261 progression. Bottom row, high magnification IF images show cell-cell sorting of CD68+ TAMs and UnaG+ tumor cells in hypoxia areas (asterisks). Quantification: n=10 tumor areas from 3 mice for each group. (I) IF images and quantification show transition of CD68+ TAM at perivascular location in nascent zones to vascular poor area in mature hypoxic zones of GL261 GBM. Enlarged images of boxed areas are shown below. n= 13 tumor areas from 3 mice per group. Unpaired t-test (C, F, H), One-way ANOVA (E, I), *P<0.05, ***P<0.001, ns, not significant. See also Figure S1.
Figure 3.
Figure 3.. Spatial patterning of TAMs corresponds to hypoxic zones in GBM patient specimens.
(A) IHC on tissue microarray of glioma biopsy specimens of different grade (n=71 patients, US Biomax, no. GL803c) co-stained for GLUT1 (pink) and CD68 (brown). Hematoxylin for nuclear counterstaining. (B) Quantification of the relative abundance of hypoxic zones containing CD68+ TAMs in relation to glioma grades (n= 71 patient samples). (C) High magnification IHC images of GBM patient biopsy specimens co-stained for GLUT1 and CD68. Pearson correlation of hypoxic burden (GLUT1+) in relation to the abundance of hypoxic zones harboring TAMs (n= 71 patient samples). (D, E) IHC images and quantifications show the abundance of GLUT1+ and IBA1+ areas in GBM subtypes. Hematoxylin for nuclear counterstaining. Specimen IDs are denoted below each image. n=5 randomly selected zones for each subtype; one-way ANOVA; *P<0.05, **P<0.01, ***P<0.001, ns, not significant. (F) Tissue sections of human GBMs of MES subtype co-stained for GLUT1 and CD68. Hematoxylin for nuclear counterstaining. (G) IF images of sections from fresh frozen human GBM samples show distribution of CD68+ or CD11b+ TAMs in relation to hypoxic zones (asterisks) outlined by GLUT1. See also Figure S1.
Figure 4.
Figure 4.. Targeting hypoxic niches disrupts spatial patterning of TAMs.
(A, B) Two weeks after transplantation, B6-WT mice bearing GL261 GBM were treated for 2 weeks with evofosfamide (Evo), radiation treatment (RT), or both. IF images (A) and quantifications (B) show tumor area, hypoxic zones (UnaG+), and tumor vasculature (PECAM1+) after treatment. n=3 mice for tumor size; n=10 for UnaG, and n=12 for PECAM1 abundance in randomly selected tumor areas from 3 mice per cohort. (C, D) IF images (C) and quantifications (D) show abundance and distribution of TAMs expressing IBA1, CD68, or CD206 after treatments. n=10–15 randomly selected images from 3 mice per treatment condition. (E) Diagram depicting interaction of immune response and tumor hypoxia. One-way ANOVA (B, D); *P<0.05, **P<0.01, ***P<0.001, ns, not significant.
Figure 5.
Figure 5.. Single cell RNA-seq reveals distinct in vivo GBM hypoxia gene signature and the presence of a hypoxic subpopulation of immune cells.
(A) UMAP plot of cell types identified by scRNA-seq of GL261 tumor in B6-WT host at 4 weeks post-transplant. (B) UMAP plot of GL261 GBM cells shows UnaG+ and UnaG cell clusters and expression scores for MES2 gene signature (Neftel et al., 2019). (C) IF image and quantification show fraction of Ki67+ cells in UnaG+ and UnaG areas. n=15 tumor areas from 3 mice per group; unpaired t-test; ***P<0.001. (D) ENRICHR pathway enrichment analysis of up- and downregulated DEGs in UnaG+ vs. UnaG GBM cells (WikiPathways 2019 gene sets). (E) Top, survival curve of human GBM patients stratified into high or low expressors of UnaG+ GBM gene signature based on TCGA GBM database (NCI BioDiscovery portal). Bottom, representation of UnaG+ gene signature in primary vs. recurrent human GBM (cBioPortal). (F) Heatmap and bar graph show relative enrichment of UnaG+ gene signature in different zones of human GBM based on Ivy GBM Atlas Project (Ivy GAP) database. One-way ANOVA; ***P<0.001. (G) UMAP of immune cells in GL261 GBM. (H) Transcriptome of immune cells analyzed by weighted gene correlated network analysis (WGCNA). Co-expressed gene modules (rows with color names) were assessed for enrichment of hallmark gene sets (columns). Highlighted row and column denote enrichment of module “red” for “Hypoxia” gene set (green). (I) Expression scores for WGCNA gene module “red” in different immune cells of GL261 GBM. (J) Transcriptome of TAMs analyzed by WGCNA. Selected co-expressed gene modules (rows) were assessed for enrichment of hallmark gene sets (columns). Highlighted row and column denote enrichment of gene module “yellow” for “Hypoxia” gene set (green). (K) Mapping of hypoxic TAM gene module “yellow” onto human GBM patient scRNA-seq dataset (Johnson et al., 2021) shows enrichment scores in myeloid cells, as well as granulocytes and dendritic cells (DC). See also Figures S2–S4.
Figure 6.
Figure 6.. Entrapped TAMs in hypoxic zones express immunosuppressive markers.
(A) UMAP plot of TAM subclusters in GL261. (B) Violin plots of marker gene expression in TAM subcluster 3 (hypoxic) vs. other subclusters combined. (C) Heatmap showing DEGs in hypoxic TAMs, with top upregulated DEGs labeled. (D, E) Representative IF images from GL261 transplants (n=3) show expression of CD68 or CD206 in relation to hypoxia markers GLUT1 or Pimo. (F) IF images show expression of immunotolerance markers Arginase-1 (Arg1) and CD206 in sequestered TAMs in hypoxic zones (asterisks). Quantification: n=10 randomly selected tumor areas from 3 mice per condition. (G) Schematic of TAM patterning in hypoxic zones of GBM. (H) IF image and quantifications of CD8+ CTLs or FOXP3+ Tregs in relation to hypoxic cores (asterisks) outlined by UnaG+ cells (dashed lines) of GL261 at 4 wks post-transplant. n=15 tumor areas from 3 mice per group. (I) Multiplex 5-color IF imaging from n=3 tumor sections show localization of CTLs (CD8a+) and TAMs (CD68+) in relation to hypoxic zones (UnaG+) or blood vessels (PECAM1+). (J, K) IF images of fresh frozen human GBM sections stained for immune cell markers for TAMs or T cells and GLUT1 (asterisks) in hypoxic or adjacent non-hypoxic zones. DAPI for nuclear staining. Enlarged images of boxed area in (J) are shown on right. Unpaired t-test (F, H); *P<0.01, ***P<0.001. See also Figures S5–S7.
Figure 7.
Figure 7.. Progressive spatial confinement of TAMs in hypoxic zones involves CCL8 and IL-1β.
(A) Top, UMAP feature plots show the expression of Ccl8 and Il1b in tumor-associated macrophages (Mac) as compared to other cells in GL261 GBM. Middle, violin plots show the expression of Ccl8 and Il1b in sc-3 (hypoxic) TAMs vs. other TAMs combined. Bottom, violin plots show the expression of the indicated genes in TAM subclusters. (B) qRT-PCR results of gene expression in cultured BMDMs after 24 hrs exposure to conditioned media (CM) of GL261 cells grown in normal or hypoxic (1% O2) condition. n=3 wells per condition. (C) ELISA of secreted IL-1β from BMDMs when exposed to control or CM. n=3 wells per condition. (D) Representative IF images from n=3 mice and profile plots of IF intensities for CD68 or CD206 in region of interest (ROIs, dashed boxes) in GL261 transplanted in WT or KO hosts. (E) Quantifications of abundance of pseudopalisading areas (UnaG+) in GL261 transplanted in different hosts. n=12–16 areas from 3 mice per condition. a.u., arbitrary units. (F) IF images and quantifications from n=3 mice show changes in CD8a+ CTL trafficking into hypoxic zones of GL261 transplanted in KO mice compared to control hosts. Asterisks denote hypoxic cores outlined by UnaG+ pseudopalisades. (G, H) Experimental scheme of mouse RCAS GBM model in immunocompetent B6 background (G, top). Representative IHC images for GLUT1 (G, bottom) of brains bearing RCAS GBMs generated in WT or different KO mice. Quantifications (H) show the extent of GLUT1+ pseudopalisading areas in RCAS GBMs. n=6–8 hypoxic zones per genotype from n=3 mice. (I) Expression of hypoxia niche genes associated with either UnaG+ tumor cells (top) or entrapped TAMs (bottom) in pseudopalisading cells (Pc) or perinecrotic zones (Pz) relative to other areas based on Ivy GAP human GBM data. (J) Model of hypoxia-induced TAM and CTL trafficking, cell-cell sorting, gene reprogramming into immunosuppression, and maturation of pseudopalisades. Unpaired t-test (E, F, H); One-way ANOVA (B, C); *P< 0.05, **P< 0.01, ***P<0.001; ns, not significant. See also Figure S7.

Comment in

References

    1. Pombo Antunes AR, Scheyltjens I, Duerinck J, Neyns B, Movahedi K, and Van Ginderachter JA (2020). Understanding the glioblastoma immune microenvironment as basis for the development of new immunotherapeutic strategies. eLife 9. 10.7554/eLife.52176. - DOI - PMC - PubMed
    1. Touat M, Li YY, Boynton AN, Spurr LF, Iorgulescu JB, Bohrson CL, Cortes-Ciriano I, Birzu C, Geduldig JE, Pelton K, et al. (2020). Mechanisms and therapeutic implications of hypermutation in gliomas. Nature 580, 517–523. 10.1038/s41586-020-2209-9. - DOI - PMC - PubMed
    1. Brahm CG, van Linde ME, Enting RH, Schuur M, Otten RHJ, Heymans MW, Verheul HMW, and Walenkamp AME (2020). The Current Status of Immune Checkpoint Inhibitors in Neuro-Oncology: A Systematic Review. Cancers (Basel) 12. 10.3390/cancers12030586. - DOI - PMC - PubMed
    1. Wei J, Chen P, Gupta P, Ott M, Zamler D, Kassab C, Bhat KP, Curran MA, de Groot JF, and Heimberger AB (2020). Immune biology of glioma-associated macrophages and microglia: functional and therapeutic implications. Neuro Oncol 22, 180–194. 10.1093/neuonc/noz212. - DOI - PMC - PubMed
    1. Klemm F, Maas RR, Bowman RL, Kornete M, Soukup K, Nassiri S, Brouland JP, Iacobuzio-Donahue CA, Brennan C, Tabar V, et al. (2020). Interrogation of the Microenvironmental Landscape in Brain Tumors Reveals Disease-Specific Alterations of Immune Cells. Cell 181, 1643–1660.e1617. 10.1016/j.cell.2020.05.007. - DOI - PMC - PubMed

Publication types