. 2023 Aug 14;41(8):1480-1497.e9.
doi: 10.1016/j.ccell.2023.06.007. Epub 2023 Jul 13.

Tissue factor is a critical regulator of radiation therapy-induced glioblastoma remodeling

Affiliations

Tissue factor is a critical regulator of radiation therapy-induced glioblastoma remodeling

Hye-Min Jeon et al. Cancer Cell. .

Abstract

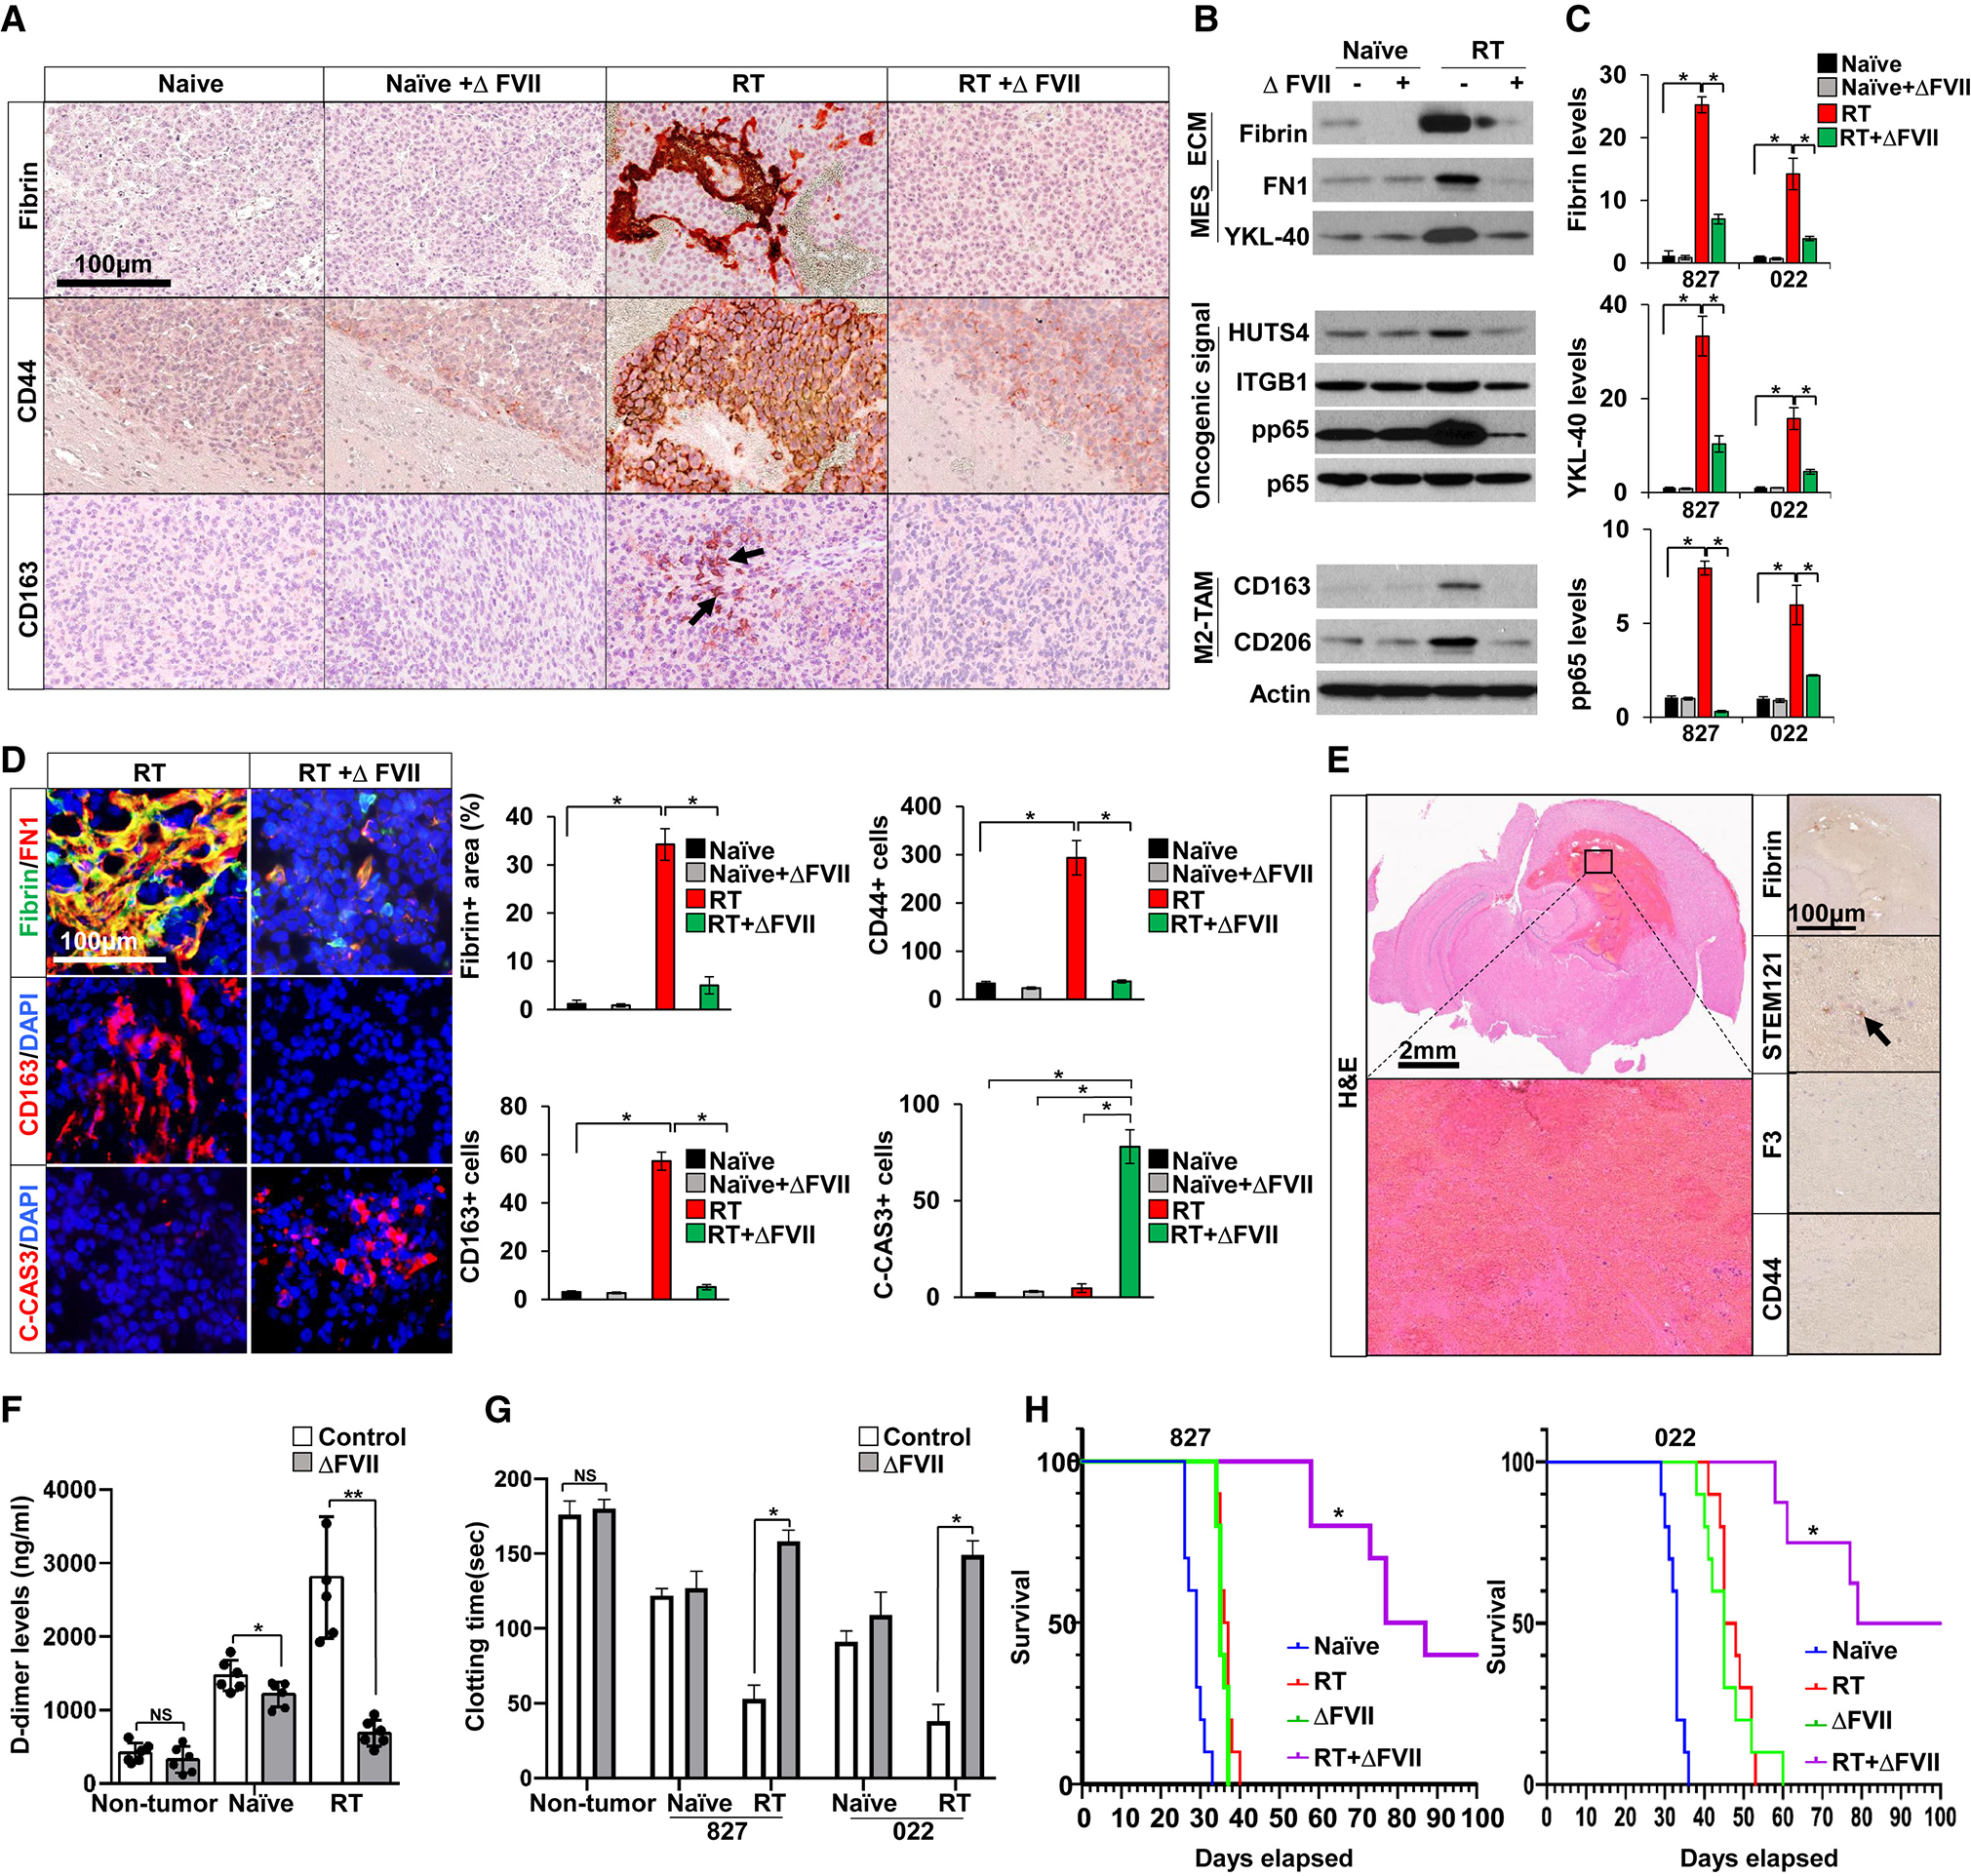
Radiation therapy (RT) provides therapeutic benefits for patients with glioblastoma (GBM), but inevitably induces poorly understood global changes in GBM and its microenvironment (TME) that promote radio-resistance and recurrence. Through a cell surface marker screen, we identified that CD142 (tissue factor or F3) is robustly induced in the senescence-associated β-galactosidase (SA-βGal)-positive GBM cells after irradiation. F3 promotes clonal expansion of irradiated SA-βGal+ GBM cells and orchestrates oncogenic TME remodeling by activating both tumor-autonomous signaling and extrinsic coagulation pathways. Intratumoral F3 signaling induces a mesenchymal-like cell state transition and elevated chemokine secretion. Simultaneously, F3-mediated focal hypercoagulation states lead to activation of tumor-associated macrophages (TAMs) and extracellular matrix (ECM) remodeling. A newly developed F3-targeting agent potently inhibits the aforementioned oncogenic events and impedes tumor relapse in vivo. These findings support F3 as a critical regulator for therapeutic resistance and oncogenic senescence in GBM, opening potential therapeutic avenues.

Keywords: glioblastoma; senescence; therapeutic resistance; tissue factor; tumor microenvironment.


Conflict of interest statement

Declaration of interests H-M.J. and J.L. are co-inventors on a filed patent application for the use of truncated F7 recombinant protein to treat cancer.

Figures

Figure 1.
Figure 1.. Radiation-induced SA-βGal+ GBM cells clonally expand in vivo.
(A) Representative images of SA-βGal activity in the brain sections. GBM tumor-bearing mice were not irradiated or irradiated (naïve and RT, respectively) and stained with X-gal or C12FDG five days later. Tumor regions were shown in H&E images. Different patient-derived GBMs are designated as numbers. * p < 0.001 by one-way ANOVA. (B) Proportion of RFP+ cells (human GBM cells) and RFP cells (mouse cells) within C12FDG+ populations (n = 3 per each). (C) Immunoblots of DNA damage response (DDR) proteins in sorted RT-C12FDG+ and C12FDG GBM subpopulations. β-actin was used as a loading control. (D) In vitro clonogenic growth of irradiated GBM subpopulations. Single cells from each subpopulation were plated in soft agar, cultured for 3 weeks, and resultant colonies counted. * p < 0.001 by one-way ANOVA with Tukey’s multiple comparison test. (E) Flow cytometry plot of C12FDG and Nestin staining in naïve and RT GBM cells. Quantitation of C12FDG+ / Nestin+ cells are shown. * p < 0.001 by one-way ANOVA. (F) Immunofluorescence (IF) staining images of C12FDG and senescence markers (HP1γ and H3K9me3). (G) Flow cytometry plot of H3K9me3 and Nestin staining in naïve, RT-bulk, and RT-C12FDG+ GBM cells. * p < 0.001 by one-way ANOVA with Tukey’s multiple comparison test. (H) t-distributed Stochastic Neighbor Embedding (t-SNE) plots of GBM single cells in the naïve, RT-bulk, and RT-C12FDG+ GBM cells (total of 105,653 cells). Color gradient was overlaid with stemness signature scores. * p < 0.001 by Mann-Whitney test. (I) Immunoblots of H3K9me3 and GBM stemness markers (Nestin and Sox2) proteins in three matched sets of RT-C12FDG + and RT-C12FDG GBM subpopulations. (J to L) Barcode-mediated clonal expansion and clonal diversity determination analysis. (J) Experimental schematic. (K) Floating bar plots of RFP-labeled cell populations in vivo. Center line in each bar represents mean value (n=4 animals per group). (L) Numbers of unique barcodes and barcode distribution within the tumors derived from the indicated cell populations. * p < 0.01 by two-way ANOVA. NS, not significant. (M) In vivo limiting dilution tumor formation results using naïve, RT-bulk, and RT-C12FDG+ GBM cells. P values were determined by two-way ANOVA. Results are presented as mean ± SD. See also Figure S1.
Figure 2.
Figure 2.. F3, highly expressed in irradiated C12FDG+ GBM cells, is associated with stemness, cell state transition, and an enhanced secretory phenotype.
(A) A schematic of the cell surface marker screen. (B) The lists of the cell surface proteins that were enriched in RT-bulk and RT-C12FDG+ GBM cells compared to naïve cells. (C) IF staining images of C12FDG and F3 in the brains of PDX tumor-bearing mice. C12FDG+/ F3+ double-positive cells were quantitated (n=3 per each tumor). * p < 0.001 by one-way ANOVA. (D and E) In vivo proliferation of RT bulk, RT-F3+, and RT-F3 cell populations (D) and in vivo limiting dilution tumor formation results. * p < 0.01 by two-way ANOVA. (F) Enriched transcription factor-binding motifs in RT-F3+ subpopulations, as determined by ATAC sequencing analysis. (G and H) Immunoblots of pp65, pIκBα, EZH2, active-β-catenin, Sox2, and HUTS4 proteins in the RT-F3+ and RT-F3 GBM subpopulations. For detection with HUTS4 antibody (specific for the activated form of ITGB1), non-denaturing gels were used. (I) Quantitation of stemness gene set expression in naïve, RT-bulk, RT-F3+, and RT-F3 GBM single cells (total of 28,890 cells). (J) Immunoblots of MES GBM transition-associated proteins (pSTAT3, IL6, and YKL-40). (K) IF images of F3 and CD44 in matched naïve and irradiated GBM tissue slices and quantitation. (L) Quantitation of SASP factor gene set expression in the above subpopulations. (M) Heatmap plots and quantitation of the secreted proteins from naïve, RT-bulk, and RT-F3+ GBM cells. Results are mean ± SD. * p < 0.001 by Mann-Whitney test in I and L. See also Figure S2 and Table S1.
Figure 3.
Figure 3.. Radiation-induced F3 prime global changes both in tumor and microenvironment.
(A) Immunohistochemical (IHC) staining images of F3, fibrin, and YKL-40 in 827 GBM tumors. Tumor-bearing mice were irradiated in vivo and tumors were harvested 5 days later. (B and C) IF images of fibrin, FN1(an ECM molecule), F4/80, CD163 (M2-like TAM) staining. Fibrin+/FN1+ areas and numbers of YKL-40+, F4/80+, and CD163+ cells were quantitated (n = 4 per each). * p < 0.001 by one-way ANOVA. (D to F) IF images of fibrin, IBA1, CD163, CD44, F3 in syngeneic mouse gliomas and quantitation. * p < 0.001 by one-way ANOVA with Tukey’s multiple comparison test. (G) Correlation between the levels of fibrin polymers and CD163+ TAMs in the brain sections of tumor-bearing mice with or without RT. r value determined by Pearson’s correlation coefficient analysis. Results are presented as mean ± SD. * p < 0.001. See also Figure S3.
Figure 4.
Figure 4.. F3 knockdown suppresses radiation-induced coagulation, SASP factor secretion and TAM activation.
(A) IHC images of fibrin, IBA1, and CD44 in the brains of 827 tumors expressing either non-targeting (NT) or F3 shRNAs (KD) with or without RT. (B) Kaplan-Meier survival curves of mice in (A). n=8 for each group. p < 0.001 by log-rank analysis. (C) Immunoblots to determine the activation status of NFκB and STAT3, and integrin in F3 KD GBM cells with or without RT. (D) Luciferase reporter assays to measure transcriptional activities of NFκB and STAT3 signaling. (E) Survival of irradiated F3 KD cells with forced activation of STAT3 or NFκB. (F) Levels of the secreted proteins from GBM cells with or without F3 KD and RT. (G) Recruitment of macrophage (Mφ)-like U937 cells co-cultured with the above cell groups. (H and I) Levels of cytokine secretion in the cells with forced activation of STAT3 or NFκB (H) or inhibition of NFκB, STAT3, integrin signaling (I). Details of inhibitors are in Method section. SASP factor index is an arbitrary unit calculated from total amounts of the secreted proteins. (J) IHC images of doxycycline-inducible F3 shRNA expressing tumors. Tumors were harvested 7 days after doxycycline treatment. * p < 0.001 by one-way ANOVA with Tukey’s multiple comparison test in D, E, G, H, and I. See also Figure S4.
Figure 5.
Figure 5.. ΔFVII treatment impeded RT-induced coagulation, SASP factor secretion, and TAM accumulation in vivo.
(A) Schematic of F7 deletion mutant structures. (B) Co-immunoprecipitation (IP)-immunoblots of F3 and Ubiquitin (Ub) in naïve and irradiated GBM cells treated with ΔFVII recombinant protein for 1 day. Levels of ubiquitinated F3 proteins were quantitated by densitometry. (C to E) Immunoblots of F3 (C), pp65 and pSTAT3 (D), and integrin signaling components (E) in irradiated GBM cells treated with ΔFVII for 1 day. (E) Co-IP blots of F3-integrin β1 (ITGB1) immunocomplexes. (F) Cell survival of normal brain cells and irradiated GBM cells treated with ΔFVII. Irradiated GBM cells, NPCs, and astrocytes were cultured with various concentrations of ΔFVII for 3 days and cell survival was determined by MTT assay. (G) Live-cell imaging of RT-F3+ 022 GBM cells treated with ΔFVII. Cell growth was monitored in real-time over 12 days. (H) Quantitation of the secreted proteins using the conditioned media from irradiated GBM (022 and 827) cells treated with ΔFVII for 1 day. (I) Representative staining images of fibrin, CD163, CCR2, and cleaved-caspase-3 (C-cas3) in the 827 GBM-derived PDX tumors treated with RT, ΔFVII, or both. (J) Immunoblots of F3, pSTAT3, BBC3, C-cas3, bFGF, HGF, and H3K9me3 proteins using GBM tumor lysates. (K) Levels of the secreted proteins from the above tumor sets. (L) Tumor sizes and fibrin staining in the above tumor sets harvested 5 days after RT. (M) Tail bleeding times of tumor-bearing mice treated with RT, ΔFVII, or both. n=3 for each group. (N) Tumor volumes of the above groups (n = 6). Results are presented as mean ± SD. * p < 0.001 by one-way ANOVA with Tukey’s multiple comparison test in B, F, G and N. * p < 0.001 by one-way ANOVA in C, H, and M. See also Figure S5.
Figure 6.
Figure 6.. ΔFVII therapies radio-sensitize GBM tumors in orthotopic PDX models.
(A) IHC images of fibrin, CD44, and CD163 in orthotopic 827 GBM tumor-bearing mice treated with RT, ΔFVII, or both. Recombinant ΔFVII protein (50 μg/kg body weight) was administered via intravenous injection daily, concurrent with irradiation. (B and C) Representative immunoblots of Fibrin, FN1, YKL-40, HUTS4, pp65, CD163, and CD206 in GBM tumors (B) and quantitation in (C). (D) IF images of fibrin/FN1, CD44, CD163, and C-cas3 and quantitation. * p < 0.001 by one-way ANOVA with Tukey’s multiple comparison test in C and D. (E) H&E staining images of the mouse brain sections from combination treated group. Human tumor cells were stained with STEM121 antibody (human cell-specific marker). (F and G) D-dimer levels in plasma (F) and tail bleeding time determination (G). N=3 for each group. * p < 0.05, ** p < 0.001 by one-way ANOVA in F. * p < 0.001 by one-way ANOVA in G. (H) Kaplan-Meier survival curves of tumor bearing mice treated with radiation, ΔFVII, or both. n=10 for each group. Combination-treated group showed a significant survival extension, compared to all other groups. p < 0.001 by log-rank analysis. See also Figure S6.
Figure 7.
Figure 7.. Expression of senescence and coagulation gene sets in matched primary and recurrent human GBM pairs.
(A) Heatmap plots of the senescence, coagulation, NFκB, cell cycling, and stemness gene set expression in early (n = 11) and late relapsed (n =14) GBM pairs. (B) Quantitation of each gene signature expression in the following tumor sets. EP, early-relapse GBM patients’ primary tumors; ER, early-relapse GBM patients’ recurrent tumors; LP, late-relapse GBM patients’ primary tumors; LR, late-relapse GBM patients’ recurrent tumors. Wilcoxon rank test and two-tailed Student’s t test were performed. * p < 0.001. (C and D) Scatter plot showing the correlations of coagulation and senescence signature gene expression (C), and NFκB and coagulation (D). r values were determined by Pearson’s correlation coefficient analysis. (E) Schematic illustration to depict the roles of F3 signaling in RT-induced GBM remodeling. See also Figure S7.

Comment in

References

    1. Gilbert MR, Dignam JJ, Armstrong TS, Wefel JS, Blumenthal DT, Vogelbaum MA, Colman H, Chakravarti A, Pugh S, Won M, et al. (2014). A randomized trial of bevacizumab for newly diagnosed glioblastoma. N Engl J Med 370, 699–708. 10.1056/NEJMoa1308573. - DOI - PMC - PubMed
    1. Lim M, Xia Y, Bettegowda C, and Weller M (2018). Current state of immunotherapy for glioblastoma. Nat Rev Clin Oncol 15, 422–442. 10.1038/s41571-018-0003-5. - DOI - PubMed
    1. Stupp R, Mason WP, van den Bent MJ, Weller M, Fisher B, Taphoorn MJ, Belanger K, Brandes AA, Marosi C, Bogdahn U, et al. (2005). Radiotherapy plus concomitant and adjuvant temozolomide for glioblastoma. N Engl J Med 352, 987–996. 10.1056/NEJMoa043330. - DOI - PubMed
    1. Bao S, Wu Q, McLendon RE, Hao Y, Shi Q, Hjelmeland AB, Dewhirst MW, Bigner DD, and Rich JN (2006). Glioma stem cells promote radioresistance by preferential activation of the DNA damage response. Nature 444, 756–760. 10.1038/nature05236. - DOI - PubMed
    1. Chen J, McKay RM, and Parada LF (2012). Malignant glioma: lessons from genomics, mouse models, and stem cells. Cell 149, 36–47. 10.1016/j.cell.2012.03.009. - DOI - PMC - PubMed

Publication types