. 2023 Aug:94:104692.
doi: 10.1016/j.ebiom.2023.104692. Epub 2023 Jul 12.

Dose imbalance of DYRK1A kinase causes systemic progeroid status in Down syndrome by increasing the un-repaired DNA damage and reducing LaminB1 levels

Affiliations

Dose imbalance of DYRK1A kinase causes systemic progeroid status in Down syndrome by increasing the un-repaired DNA damage and reducing LaminB1 levels

Aoife Murray et al. EBioMedicine. 2023 Aug.

Abstract

Background: People with Down syndrome (DS) show clinical signs of accelerated ageing. Causative mechanisms remain unknown and hypotheses range from the (essentially untreatable) amplified-chromosomal-instability explanation, to potential actions of individual supernumerary chromosome-21 genes. The latter explanation could open a route to therapeutic amelioration if the specific over-acting genes could be identified and their action toned-down.

Methods: Biological age was estimated through patterns of sugar molecules attached to plasma immunoglobulin-G (IgG-glycans, an established "biological-ageing-clock") in n = 246 individuals with DS from three European populations, clinically characterised for the presence of co-morbidities, and compared to n = 256 age-, sex- and demography-matched healthy controls. Isogenic human induced pluripotent stem cell (hiPSCs) models of full and partial trisomy-21 with CRISPR-Cas9 gene editing and two kinase inhibitors were studied prior and after differentiation to cerebral organoids.

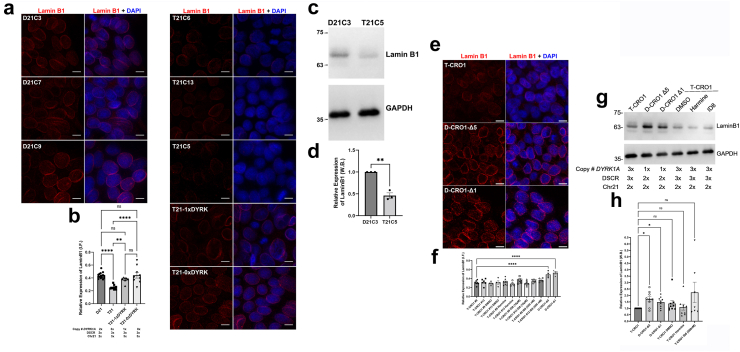
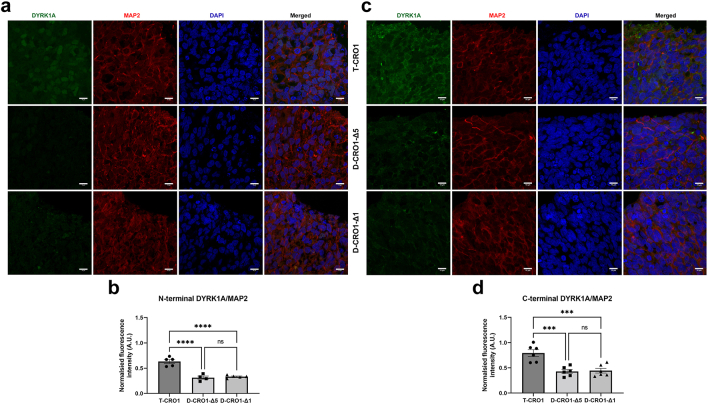
Findings: Biological age in adults with DS is (on average) 18.4-19.1 years older than in chronological-age-matched controls independent of co-morbidities, and this shift remains constant throughout lifespan. Changes are detectable from early childhood, and do not require a supernumerary chromosome, but are seen in segmental duplication of only 31 genes, along with increased DNA damage and decreased levels of LaminB1 in nucleated blood cells. We demonstrate that these cell-autonomous phenotypes can be gene-dose-modelled and pharmacologically corrected in hiPSCs and derived cerebral organoids. Using isogenic hiPSC models we show that chromosome-21 gene DYRK1A overdose is sufficient and necessary to cause excess unrepaired DNA damage.

Interpretation: Explanation of hitherto observed accelerated ageing in DS as a developmental progeroid syndrome driven by DYRK1A overdose provides a target for early pharmacological preventative intervention strategies.

Funding: Main funding came from the "Research Cooperability" Program of the Croatian Science Foundation funded by the European Union from the European Social Fund under the Operational Programme Efficient Human Resources 2014-2020, Project PZS-2019-02-4277, and the Wellcome Trust Grants 098330/Z/12/Z and 217199/Z/19/Z (UK). All other funding is described in details in the "Acknowledgements".

Keywords: Ageing; Chromosome 21; DYRK1A; DYRK1A inhibitors; Down syndrome; Down syndrome critical region; IgG glycan; LaminB1.


Conflict of interest statement

Declaration of interests GL is the founder and owner of Genos Ltd., a private research organisation that specialises in high-throughput glycomic analyses and has several patents in this field and is also a shareholder in GlycanAge Ltd., a company that sells the GlycanAge test of biological age. AC, FV, JJ, MPB, ASla, HD, AF, DP and JK are employees of Genos Ltd. AStr has served on the Advisory Boards of AC Immune and ProMIS Neuroscience, and is a past president of the Trisomy21 Research Society. TS is the scientific co-founder and a shareholder of Zoe Ltd.

Figures

Fig. 1
Fig. 1
Levels of six derived IgG glycan traits in persons with DS and in healthy controls shown separately for three cohorts of adults with DS from France (FRA), Italy (ITA) and United Kingdom (UK). (a) Total data, not filtered for presence or absence of co-morbidities: G0 total–sum of IgG glycans without galactose, G1 total–sum of IgG glycans with one galactose, G2 total–sum of IgG glycans with two galactoses, S total–sum of IgG glycans with sialic acid(s), F total–sum of IgG glycans with core fucose, B total–sum of IgG glycans with bisecting N-acetylglucosamine (see Supplementary Figure S1 for definition of the traits). Statistical calculations and additional information are available in Supplementary Table S9 and Methods. (b) Comparison of levels of derived IgG glycan traits between controls and persons with DS with or without any type of autoimmune disease. (c) Comparison of levels of derived IgG glycan traits between controls and persons with DS with or without autoimmune thyroid disease (additional information is available in Supplementary Table S12). (d) Comparison of levels of derived IgG glycan traits between healthy control individuals, persons with DS without dementia and persons with DS with dementia. FRA—DS cohort from France, UK—DS cohort from the UK. No significant difference was observed between persons with DS with or without dementia (additional information is available in Supplementary Tables S11 and S12). (e) Age distribution of DS individuals with and without dementia within the French and UK cohorts of DS. For all graphs (a–e), data are shown as box plots. Each box represents the 25th–75th percentiles (the interquartile range (IQR)). Lines inside the boxes represent the median. Lines outside the boxes indicate data within 1.5 × IQR from the 25th and 75th percentiles. Black dots indicate outliers. Asterisk ∗ indicates statistically significant differences (p < 0.05, meta-analysis) between DS individuals and healthy controls (statistical calculations and additional information is available in Supplementary Tables S9, S11 and S12 and Methods).
Fig. 2
Fig. 2
Relationship between age and levels of six derived IgG glycan traits in persons with DS and in healthy controls shown separately for three cohorts of adults with DS from France (FRA), Italy (ITA) and the UK. Red and blue lines represent fitted linear regression models for the control and DS data, respectively. The shaded region is a 95% confidence interval on the fitted values. Individual subject data points are presented on the background. G0 total–sum of IgG glycans without galactose, G1 total–sum of IgG glycans with one galactose, G2 total–sum of IgG glycans with two galactoses, S total–sum of IgG glycans with sialic acid(s), F total–sum of IgG glycans with core fucose, B total–sum of IgG glycans with bisecting GlcNAc. Trendline equations for the two derived traits that change the most with age: G0 FRA control: y = 0.43x + 6.72; G0 FRA DS: y = 0.44x + 11.42; G0 ITA control: y = 0.26x + 13.74; G0 ITA DS: y = 0.33x + 15.96; G0 UK control: y = 0.29x + 11.63; G0 UK DS: y = 0.40x + 14.92; G2 FRA control: y = −0.22x + 28.25; G2 FRA DS: y = −0.25x + 25.96; G2 ITA control: y = −0.17x + 26.04; G2 ITA DS: y = −0.18x + 23.23; G2 UK control: y = −0.18x + 26.79; G2 UK DS: y = −0.20x + 23.22.
Fig. 3
Fig. 3
IgG glycosylation in children with DS including a child with segmental T21 and cellular ageing marks in its blood cells. (a) Levels of six derived IgG glycan traits in 4-year-old children with DS from the UK cohort (blue), age-matched 4-year-old healthy children (orange), in all DS children in the study aged 1–5 years (purple), and in CRO1 child with segmental T21 (black cross). G0 total–sum of IgG glycans without galactose, G1 total–sum of IgG glycans with one galactose, G2 total–sum of IgG glycans with two galactoses, S total–sum of IgG glycans with sialic acid(s), F total–sum of IgG glycans with core fucose, B total–sum of IgG glycans with bisecting GlcNAc. Data are shown as box plots with individual data points. Each box represents the 25th–75th percentiles (IQR). Lines inside the boxes represent the median. Lines outside the boxes indicate data within 1.5 × IQR from the 25th and 75th percentiles. Each dot represents one child. CRO1 child is marked as single black cross. (b) Principal component analysis (PCA) displaying differences in IgG glycosylation between all available DS children in the study and all available healthy control children: PC1 vs PC2 plot (left) and PC1 vs PC3 plot (right). PCA positioned CRO1 child with segmental T21 (marked as a black cross) within the DS sample cluster. Each dot represents one child. n (children with DS) = 38 + CRO1 child, n (euploid children) = 17. PCA was performed on directly measured IgG glycan peaks (GP1–GP24). (c) PCA on same cohorts as in part b, for G0, G1, G2, S and F derived IgG glycan traits values shows CRO1 clusters with the cohort of children with DS. (d) Graphical representation of the 4.083 Mbp segmental duplication in CRO1 which includes 31 chr21 genes spanning from DOPEY2 to PCP4. The pale orange background indicates the region referred to as the “DSCR”, while the red bar indicates the region duplicated in CRO1, which is then magnified under the yellow region to show the gene content. (e) Full karyotype of the CRO1 child. Normal number of chromosomes, with a small duplication in the 21q22 region (arrow). (f–i) Fresh PBMCs at primary collection from the CRO1 child during a routine health check-up, fixed with 4% PFA and compared to those from an age- and sex-matched normal/euploid child by immunostaining with γH2AX and Lamin B1. CRO1 primary blood cells showed (f and g) increased levels of γH2AX puncta per nucleus, ∗∗ p = 0.0017, and (h and i) reduced levels of Lamin B1, ∗∗∗∗ p < 0.0001, compared to the control. 4–5 images per sample, with a total of approximately 50 cells per sample analysed. Data points on the graph represent the average value per image. Statistical significance was calculated using an unpaired 2-tailed student’s T-test. Error bars: SEM.
Fig. 4
Fig. 4
Increased levels of γH2AX in isogenic models of full and partial trisomy 21. (a) Histones were purified from 3 disomic (D21) and 3 trisomic (T21) isogenic iPSC clones. Increased levels of γH2AX were observed in each of the three independent clones of T21 iPSCs as compared to the three independent isogenic D21 iPSCs. Histone H3 was used as histone purification and loading control in Western blotting. (b) Relative expression of γH2AX to H3 was quantified and represented as individual dots using D21 levels as 1. Error bars show SEM (unpaired Student’s 2-tailed t-test, p = 0.0092). (c) Representative immunofluorescence images used for analysis show an increased number of γH2AX puncta per nucleus in T21 compared to isogenic D21 iPSC clones. Scale bar 5 μm. (d) Numbers of γH2AX puncta per nucleus in T21 and D21 iPSC clones. Sufficient images for each cell line were taken to ensure a minimum of 2000 nuclei counted. Each dot on the histogram represents the data of an individual image. Error bars: SEM. Statistical analysis was carried out by one-way ANOVA followed by Tukey’s correction for multiple comparisons. (e) T-CRO1 iPSCs were treated with DMSO or DYRK1A inhibitors (harmine or ID-8) for 12 h before fixation alongside untreated D-CRO1-Δ1 and D-CRO1-Δ5. Representative confocal images used for analysis of γH2AX stainings are shown. Scale bars: 5 μm. (f) Quantification of γH2AX foci per nucleus was performed automatically using IMARIS. Sufficient images were taken from two independent experiments consisting of three wells each to ensure that a minimum of 2000 nuclei were counted for each cell line. Each dot on the histogram represents the data of an individual image. Statistical significance was calculated by one-way ANOVA followed by Dunnett’s correction for multiple comparisons. Error bars: SEM. (g–i) Representative images from T-CRO1, D-CRO1-Δ1 and D-CRO1-Δ5 iPSCs used for analysis with the OpenComet plug-in for ImageJ. The top panels show one field of view, zoomed out. Scale bar 50 μm. The lower panel shows zoomed and cropped single cells which the ImageJ plug-in recognised as single, non-overlapping cells. DNA tail is visible in parental, T-CRO1 clone. (j) A minimum of 70 well-separated cells were analysed per cell line in the Comet assay to calculate the Comet-Olive Moment. One-way ANOVA followed by Tukey’s correction for multiple comparisons demonstrated a significant reduction in DNA damage in the CRISPR clones. Error bars: SEM. For all parts: ∗p < 0.05, ∗∗p < 0.01, ∗∗∗p < 0.001, ∗∗∗∗p < 0.0001, ns = not significant.
Fig. 5
Fig. 5
Number of γH2AX foci per nucleus in T21 iPSCs is driven by the dose of DYRK1A. (a) Representative images of T21 iPSCs used for analysis, treated with DMSO or a DYRK1A inhibitor (300 nM harmine) for 12 h alongside untreated T21 and T21-1xDYRK. iPSCs were fixed and stained for γH2AX then imaged by confocal microscopy. Scale bar: 10 μm. (b) Quantification of γH2AX foci was performed automatically using IMARIS. Sufficient images for each cell line were taken to ensure a minimum of 2000 nuclei were counted. Data are shown relative to T21 in which γH2AX puncta per nucleus was set to 1. Each dot on the histogram represents the data of an individual image. Error bars: SEM. Statistical significance was calculated by one-way ANOVA followed by Dunnett’s correction for multiple comparisons. (c and d) T21-0xDYRK iPSCs were transiently transfected with a plasmid to express wild-type DYRK1A or a kinase-dead mutant (K179R) DYRK1A (and GFP under the control of an IRES). Cells were fixed 72 h post-transfection, stained with γH2AX then imaged by confocal microscopy. Representative images used for analysis are shown. Scale bars: 10 μm. (e–j) Quantification of γH2AX and 53BP1 foci was performed automatically using IMARIS. Sufficient images for each cell population were taken to ensure a minimum of 200 nuclei were counted. Each dot on the histogram represents the data of an individual image. The number of γH2AX puncta in cells expressing the exogenous DYRK1A (GFP+ cells) was compared to that in DYRK1A null (untransfected GFP cells) on the same coverslip, for both the (e) wild-type and (f) mutant DYRK1A. The number of 53BP1 (g and h) and RNF169 (i and j) puncta in cells expressing the exogenous DYRK1A (GFP+ cells) was compared to that in DYRK1A null (untransfected GFP cells) on the same coverslip, for both the (g and i) wild-type and (h and j) mutant DYRK1A. In each case values are shown relative to the value of GFP cells set to 1. Error bars: SEM. Statistical significance was calculated using an unpaired 2-tailed Student’s T-test. For all parts: ∗p < 0.05, ∗∗p < 0.01, ∗∗∗p < 0.001, ∗∗∗∗p < 0.0001, ns = not significant.
Fig. 6
Fig. 6
Expression of Lamin B1 in T21 and T-CRO1 iPSCs is inversely correlated with the dose of DYRK1A. (a) Representative images from independent isogenic T21 and D21 iPSC clones alongside the isogenic CRISPR/Cas9-edited T21-1xDYRK and T21-0xDYRK were stained for Lamin B1 then imaged by confocal microscopy. Scale bars: 10 μm. (b) The relative expression of Lamin B1 in a minimum of 4000 DAPI positive nuclei from 4 or more images per cell line were analysed. Each dot on the histogram represents the data of an individual image. Quantification of Lamin B1 expression was performed using IMARIS and normalised to DAPI. Error bars: SEM. Statistical significance was calculated by one-way ANOVA followed by Dunnett’s correction for multiple comparisons: D21 vs T21, p < 0.0001; T21 vs T21 1xDYRK, p = 0.0044; T21 vs T21-0xDYRK, p < 0.0001. (c) Lamin B1 expression in iPSC lysates was analysed by Western blot, which showed reduced Lamin B1 expression in T21 iPSCs compared to isogenic D21 iPSCs relative to the GAPDH loading control. (d) The Lamin B1 signal in three independent Western blots was quantified and plotted relative to that of GAPDH with the values in D21C3 set as 1. Error bars: SEM. Statistical significance was calculated with an unpaired two-tailed Student’s t-test (p = 0.001). (e and f) T-CRO1 iPSCs (2 independent clones #9 and #13) were treated or not with DMSO or a DYRK1A inhibitor for 12 h before fixing or harvesting alongside untreated D-CRO1-Δ1 and D-CRO1-Δ5. iPSCs were fixed and stained for Lamin B1 then imaged by confocal microscopy. Representative images of the untreated iPSC clones are shown in (e). Scale bars: 10 μm. In (f), quantification of Lamin B1 expression was performed using IMARIS and normalised to DAPI. The relative expression of Lamin B1 in n > 4000 DAPI positive nuclei were counted for each cell line. Each dot on the histogram represents an individual image. Error bars: SEM. Statistical significance was calculated by one-way ANOVA followed by Dunnett’s correction for multiple comparisons, comparing each cell line/condition to untreated T-CRO1 #9. Only significant comparisons to T-CRO1 are shown on the graph (∗∗∗∗p < 0.0001). A similar analysis comparing everything to T-CRO1 #13 gave a similar result with only D-CRO1-Δ1 and D-CRO1-Δ5 showing significance (not shown). (g and h) iPSC lysates were analysed by Western blot for Lamin B1 expression. In (g), a representative blot is shown. In (h), the signal of Lamin B1 was quantified in independent Western blots, normalised to GAPDH, and set as 1 in T-CRO1 iPSCs Error bars: SEM. Statistical significance was calculated by fitting a mixed model followed Dunnett’s correction for multiple comparisons (D-CRO1-Δ1 vs T-CRO1, p = 0.0345; D-CRO1-Δ5 vs T-CRO1, p = 0.0224). For all parts: ∗ p <0.05, ∗∗ p <0.01, ∗∗∗∗ p <0.0001, ns = not significant
Fig. 7
Fig. 7
Lamin B1 expression is reduced in T21 primary cells representative of all three germ layers. (a–c) Gestational age- sex- and neuroanatomical region-matched (n = 3 pairs) DS and normal human foetal brain (frontal cortex) samples were analysed for Lamin B1 expression by bright immunohistochemistry (a) (scale bar: 50 μm) and immunofluorescence (c) (scale bar: 20 μm). Top row: normal sample. Bottom row: DS sample. Representative images are shown from 1 of the 3 pairs of samples. (c) Quantification of Lamin B1 expression, normalised to nuclear stain, was carried out on 5 immunofluorescence images for each sample. Each dot on the histogram represents the average from each individual brain, with n > 4000 nuclei analysed per sample (DS, n = 3; N, n = 3). Error bars: SEM. Statistical significance was calculated using an unpaired 2-tailed Student’s T-test (p = 0.0007). (d) Gestational-age- and passage-number- matched DS (n = 4) and normal (n = 4) human foetal fibroblasts were analysed by immunofluorescence for Lamin B1 expression, normalised to the number of nuclei. Each dot on the histogram represents the average of 3 images per coverslip and 2 coverslips per cell line were analysed. Error bars: SEM. Statistical significance was calculated using an unpaired 2-tailed Student’s T-test (p = 0.0142). (e–g) Age- and sex-matched DS and normal human foetal and infant liver samples from 18 to 20 gestational weeks (DS, n = 3; N, n = 3) and 11 months infants (DS, n = 1; N, n = 1) were analysed for Lamin B1 expression by bright immunohistochemistry (e) (scale bar: 50 μm) and immunofluorescence (f) (scale bar: 20 μm). Top row: normal sample. Bottom row: DS sample. Representative images are shown from the 11-month old infant pair of samples. (g) Quantification of Lamin B1 expression, normalised to nuclear stain, was carried out on 3–4 immunofluorescence images per each sample. Each dot on the histogram represents the average from each individual liver, with n > 5000 nuclei analysed per sample (DS, n = 4; N, n = 4). Error bars: SEM. Statistical significance was calculated using an unpaired 2-tailed Student’s T-test (p = 0.0415). (h and i) An independent set of age-matched DS and normal human foetal liver samples were compared by Western blotting and normalised to GAPDH. (i) Lamin B1 expression was quantified and plotted relative to GAPDH signal (DS, n = 4; N, n = 3). Error bars: SEM. Statistical significance was calculated using an unpaired 2-tailed Student’s T-test (p = 0.0004). For all parts: ∗ p <0.05, ∗∗∗ p <0.001.
Fig. 8
Fig. 8
γH2AX and Lamin B1 expression by immunofluorescence in DIV70 and DIV50 T-CRO1 and D-CRO1 cerebral organoids. (a) Immunofluorescence images of cerebral organoid sections after 70 days of differentiation showing MAP2, Lamin B1 and γH2AX expression in T-CRO1 organoids alongside D-CRO1-Δ1 and D-CRO1-Δ5 organoids. T-CRO1 organoids were separately treated with DYRK1A inhibitors for 40 days (Harmine or ID8), while DMSO was used as a vehicle only control for each drug. Scale bar 20 μm. (b) Cerebral organoids with gene-dose reduction of DYRK1A by genome-editing or chemical DYRK1A kinase inhibition resulted in decreased γH2AX puncta per nucleus compared to T-CRO1 control organoids at DIV70. (c) Cerebral organoids with gene-dose reduction of DYRK1A by genome-editing or chemical DYRK1A kinase inhibition resulted in increased expression of Lamin B1 when compared to T-CRO1 organoids at DIV70. Lamin B1 was normalised to MAP2 expression in co-stained sections. (d) Immunofluorescence images of organoid sections after 70 days of differentiation showing MAP2 and p21 expression in T-CRO1 organoids alongside D-CRO1-Δ1 and D-CRO1-Δ5 organoids. T-CRO1 organoids were separately treated with DYRK1A inhibitors for 40 days (300 nM harmine or 500 nM ID8), while DMSO was used as a vehicle only control. Scale bar 20 μm. (e) Cerebral organoids with gene-dose reduction of DYRK1A by genome-editing or chemical DYRK1A kinase inhibition resulted in a decreased proportion of p21 positive cells compared to T-CRO1 organoids at DIV70. For (b, c and e) 3–5 organoids per genotype or condition were analysed (harmine: 300 nM, ID8: 10 μM), and 8–13 images containing a total of n > 1000 nuclei per cell line analysed. Graphs show mean ± SEM. Statistics were calculated by one-way ANOVA followed by Dunnett's correction for multiple comparisons. (f and g) Organoids were examined by immunostaining at DIV50. Organoids generated from both D-CRO1 lines showed (f) decreased γH2AX per nucleus compared to T-CRO1 organoids and (g) increased Lamin B1 expression compared to T-CRO1 organoids. Three organoids were analysed per cell line, and 3–5 images containing a total of n > 1000 nuclei per cell line analysed. Graphs show mean ± SEM. Statistics were calculated by one-way ANOVA followed by Dunnett's correction for multiple comparisons. For all parts: ∗∗p < 0.01, ∗∗∗p < 0.001, ∗∗∗∗p < 0.0001, ns = not significant.
Fig. 9
Fig. 9
T-CRO1 cerebral organoids show reduced cortical folding compared to D-CRO1 organoids, a feature shared by brains of LMNB1+/−patients and DS foetuses. (a) Comparison of the clinical features between the CRO1 child, patients with LMNB1 mutations that lower Lamin B1 expression and individuals with DS, demonstrates a number of shared features. (b) Representative bright-field images of cerebral organoids generated in parallel. Day 3: Embryoid bodies (EBs) prior to neural induction. Starting cell number was consistent per line. Day 10: EBs after 4 days in neural induction medium. Clearing of the outer surface indicates the formation of neural ectoderm. Day 14: Cerebral organoids display radial organisation of neuroectoderm into organoid cortical folds. A simplified schematic outline is drawn to the right. Scale bars represent 400 μm. (c) Both D-CRO1 iPSC lines generated significantly more folded organoids than T-CRO1. The organoid folding value per 10,000 cm2 on image traces were calculated using ImageJ software of n = 11–16 images per cell line taken from two batches of cerebral organoids. Error bars: SEM. Statistical significance was calculated by one-way ANOVA followed by Dunnett’s correction for multiple comparisons (∗∗∗∗p < 0.0001). (d) Both D-CRO1 iPSC lines generated significantly smaller EB/organoids than T-CRO1. Average EB/organoid surface area on bright-field images were calculated using ImageJ software of n = 7–12 images per cell line taken from two batches of cerebral organoids. Error bars: SEM. Statistical significance was calculated by one-way ANOVA followed by Dunnett’s correction for multiple comparisons, p > 0.05 (ns), p ≤ 0.05 (∗), p ≤ 0.0001 (∗∗∗∗).
Supplementary Figure S1
Supplementary Figure S2
Supplementary Figure S3
Supplementary Figure S4
Supplementary Figure S5
Supplementary Figure S6
Supplementary Figure S7
Supplementary Figure S8
Supplementary Figure S9
Supplementary Figure S10
Supplementary Figure S11

References

    1. Antonarakis S.E., Skotko B.G., Rafii M.S., et al. Down syndrome. Nat Rev Dis Primers. 2020;6(1):9. - PMC - PubMed
    1. Epstein C.J. 2001 William Allan Award address. From Down syndrome to the "human" in "human genetics". Am J Hum Genet. 2002;70(2):300–313. - PMC - PubMed
    1. Wiseman F.K., Al-Janabi T., Hardy J., et al. A genetic cause of Alzheimer disease: mechanistic insights from Down syndrome. Nat Rev Neurosci. 2015;16(9):564–574. - PMC - PubMed
    1. Cuadrado E., Barrena M.J. Immune dysfunction in Down's syndrome: primary immune deficiency or early senescence of the immune system? Clin Immunol Immunopathol. 1996;78(3):209–214. - PubMed
    1. da Silva V.Z., de Franca Barros J., de Azevedo M., de Godoy J.R., Arena R., Cipriano G., Jr. Bone mineral density and respiratory muscle strength in male individuals with mental retardation (with and without Down Syndrome) Res Dev Disabil. 2010;31(6):1585–1589. - PubMed