. 2023 Sep;120(3):351-383.
doi: 10.1111/mmi.15122. Epub 2023 Jul 14.

Negative regulation of MurZ and MurA underlies the essentiality of GpsB- and StkP-mediated protein phosphorylation in Streptococcus pneumoniae D39

Affiliations

Negative regulation of MurZ and MurA underlies the essentiality of GpsB- and StkP-mediated protein phosphorylation in Streptococcus pneumoniae D39

Ho-Ching Tiffany Tsui et al. Mol Microbiol. 2023 Sep.

Abstract

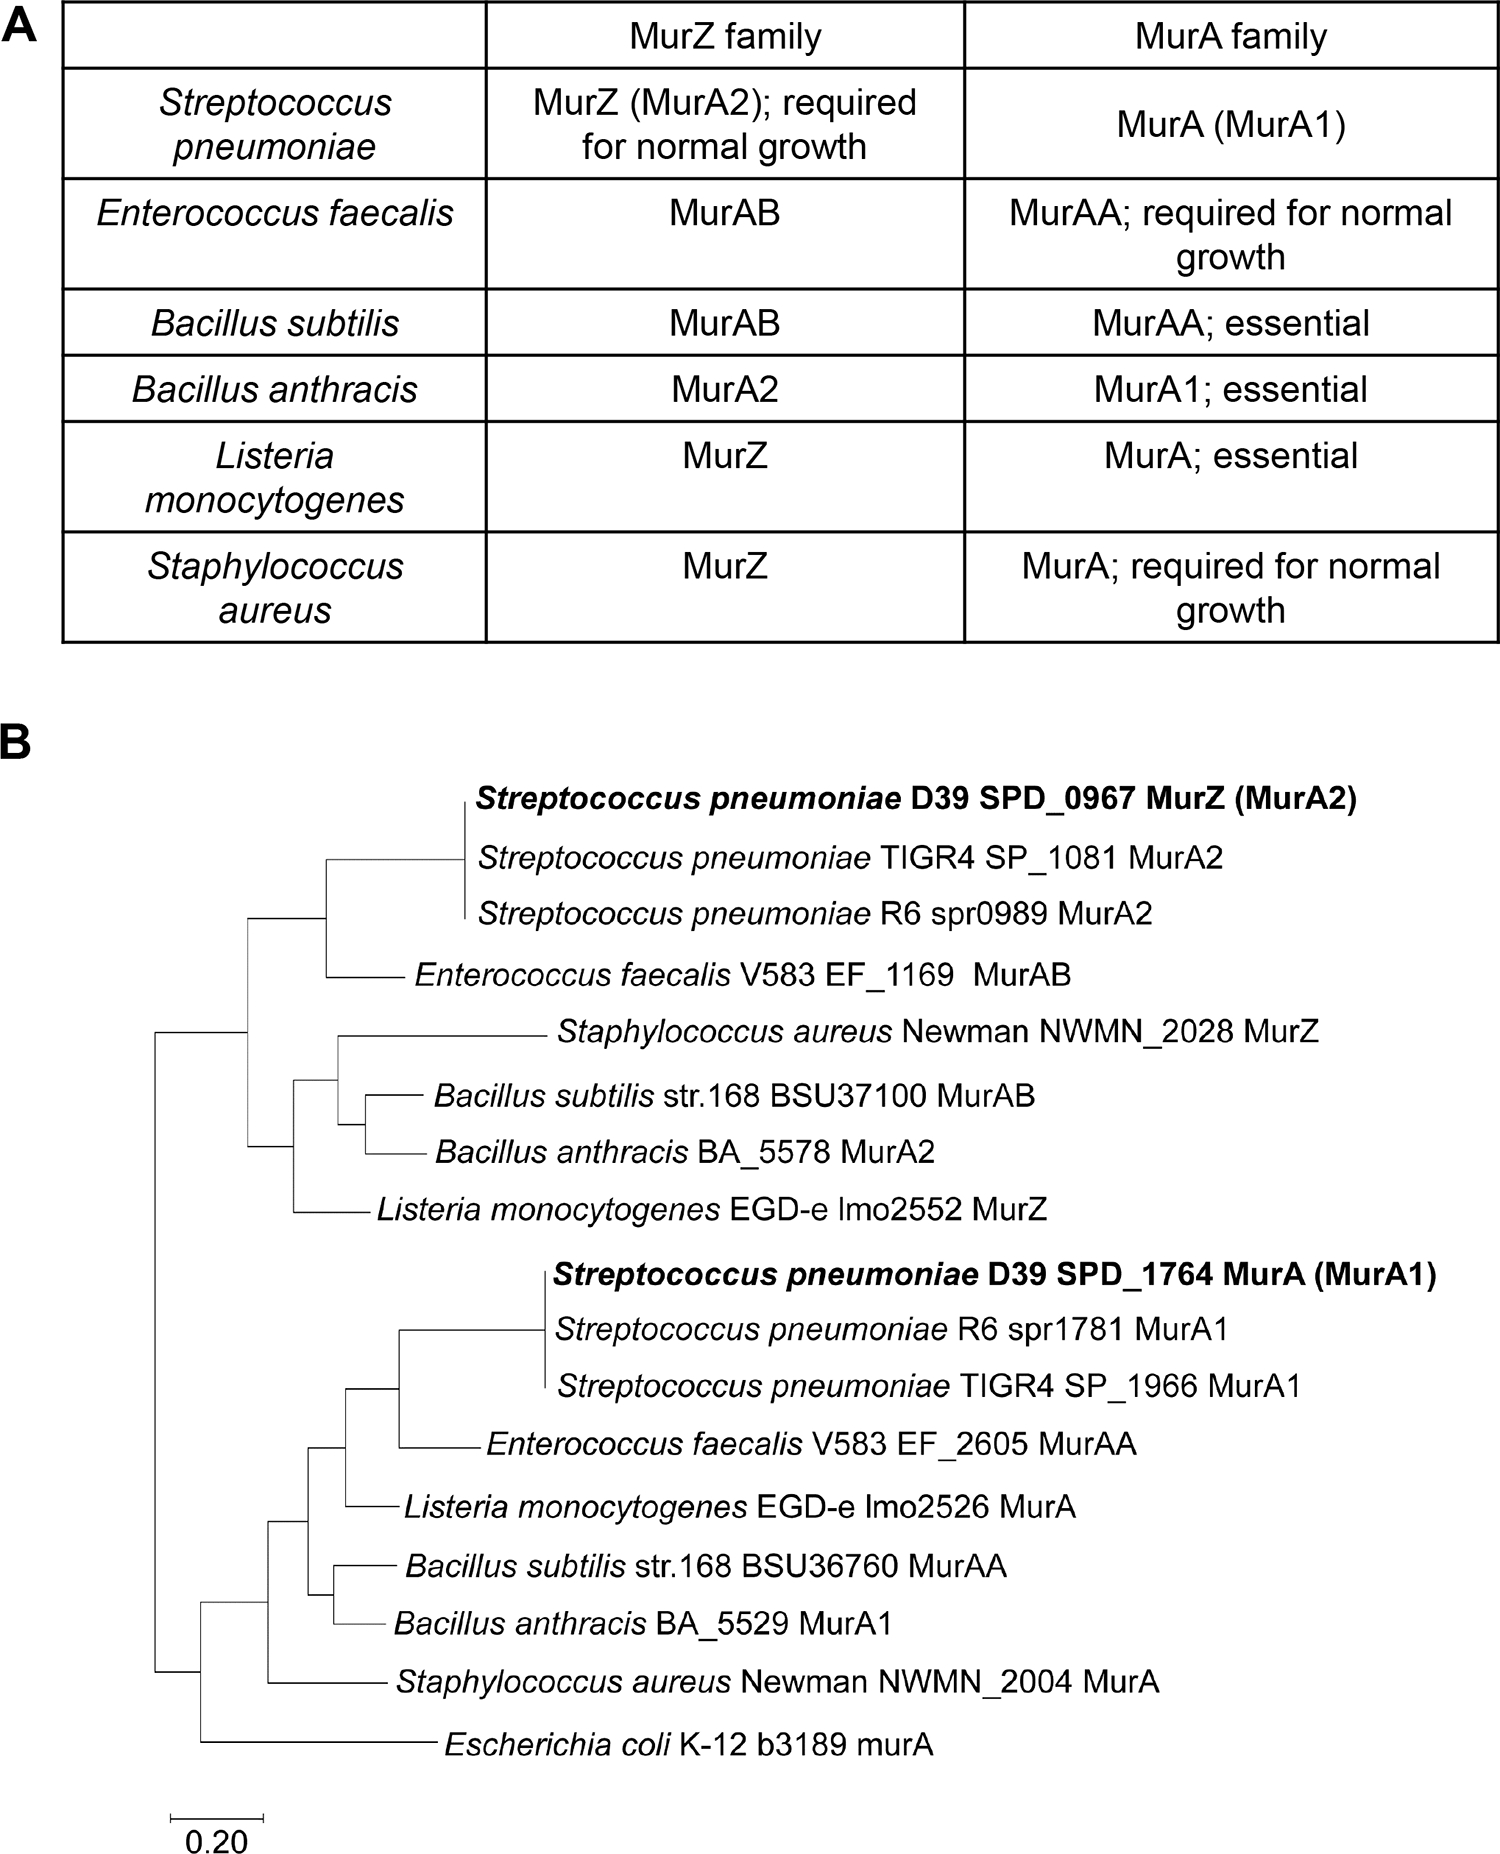
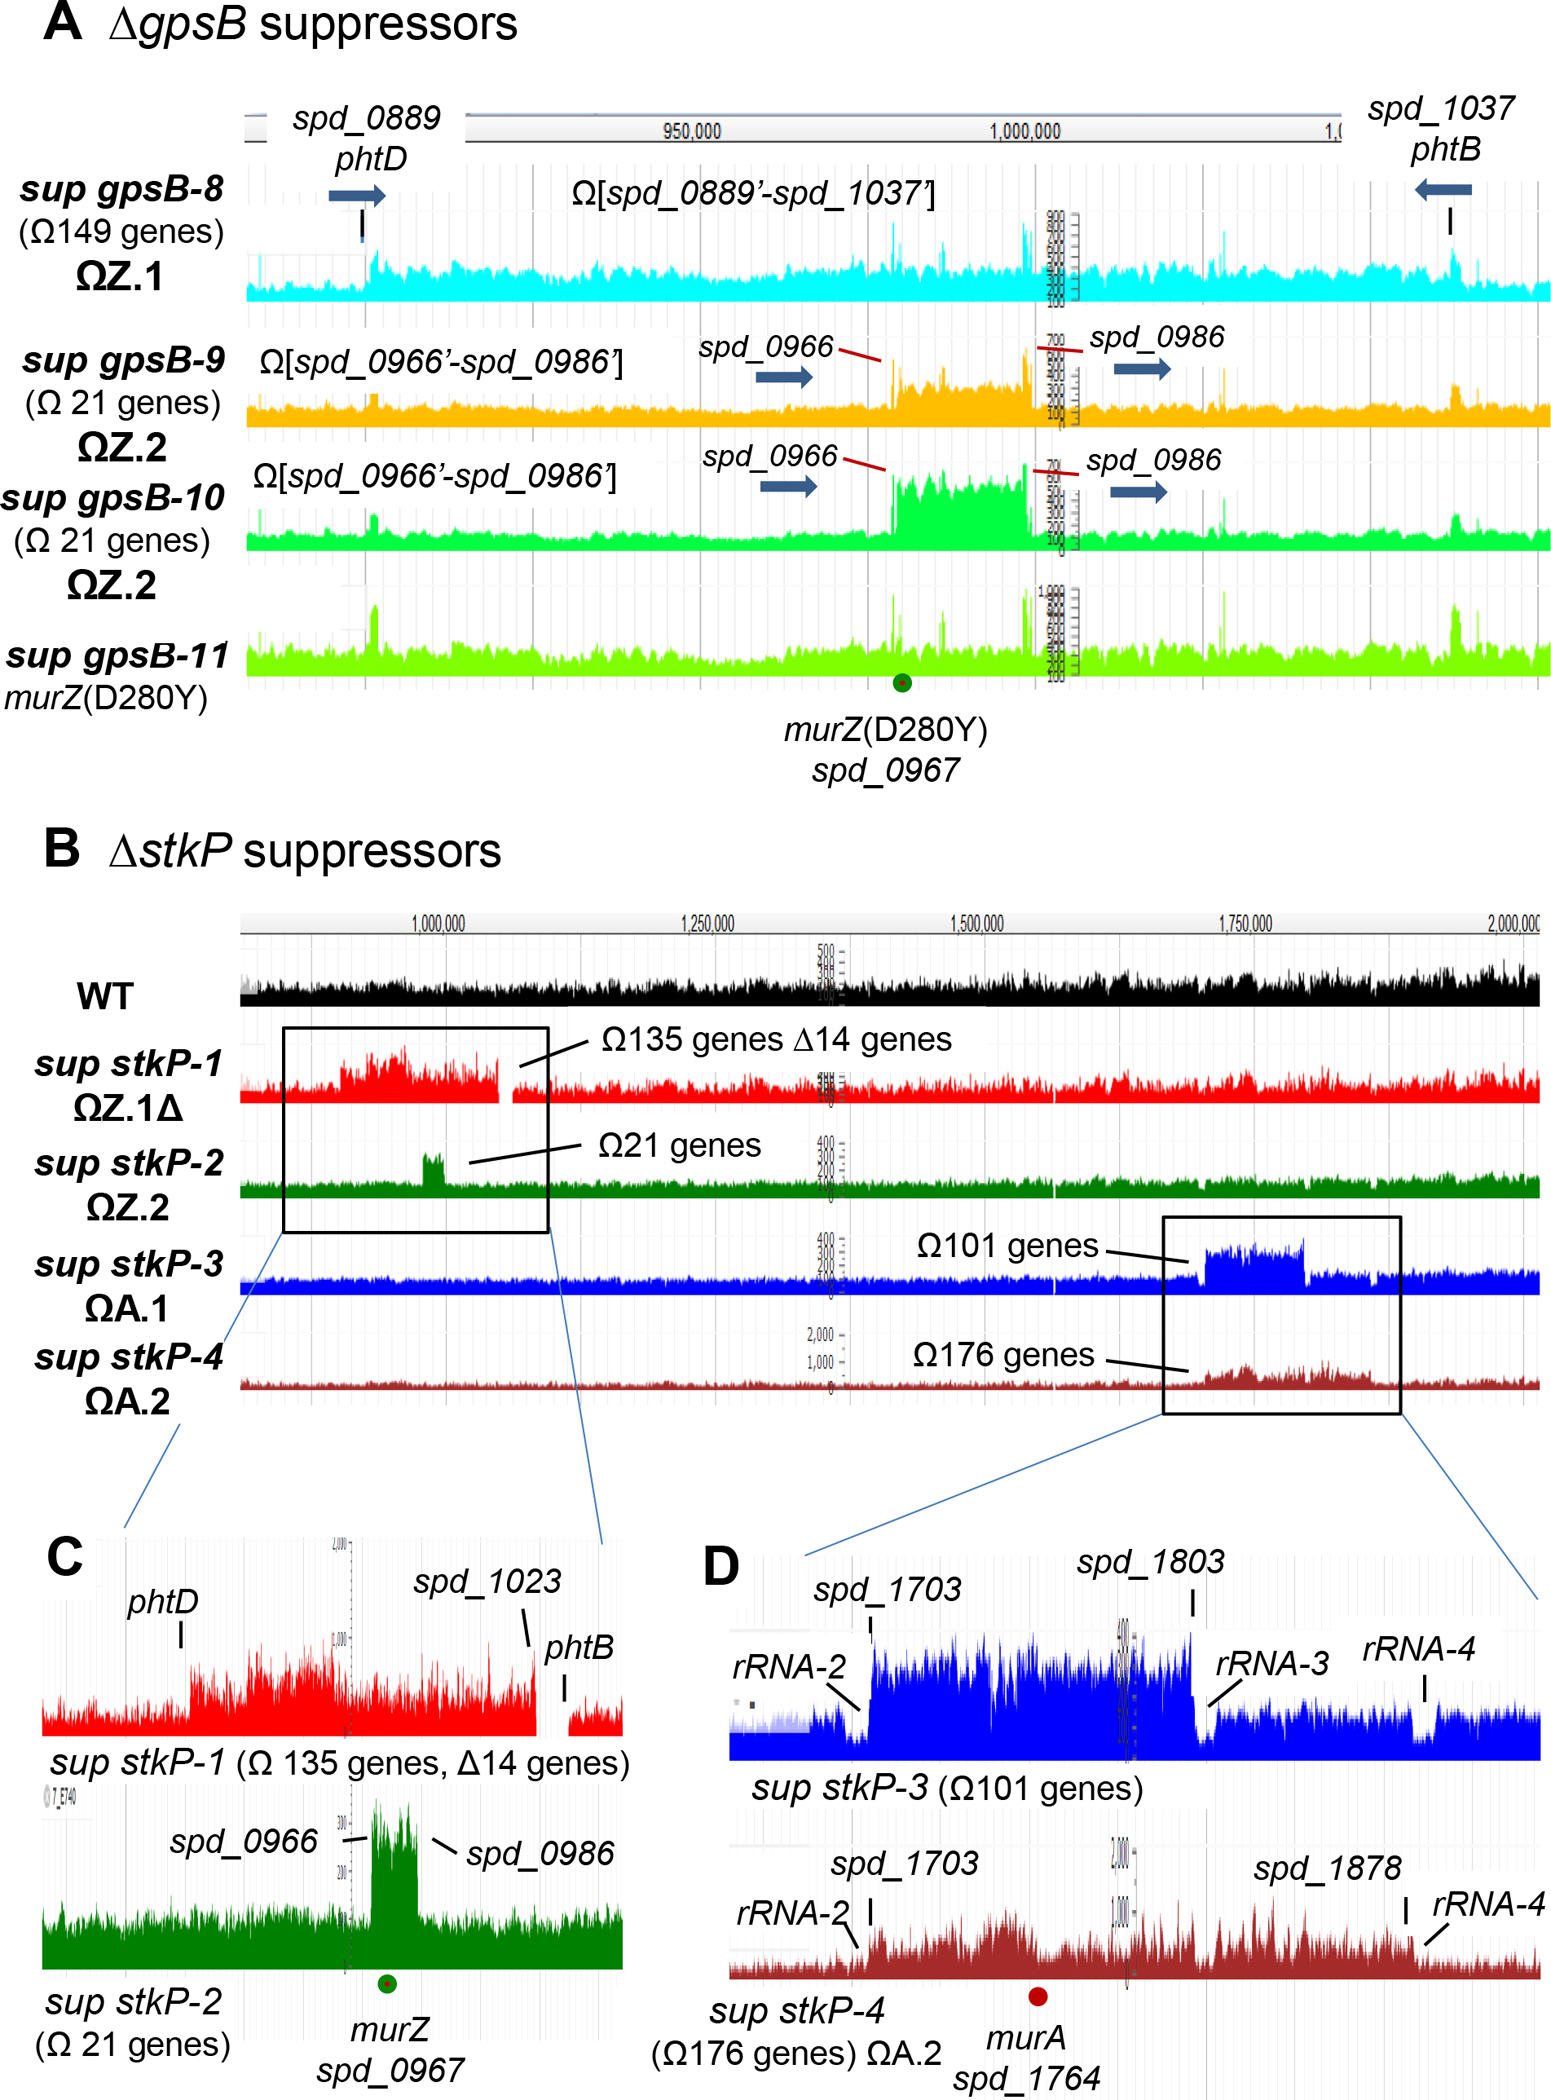
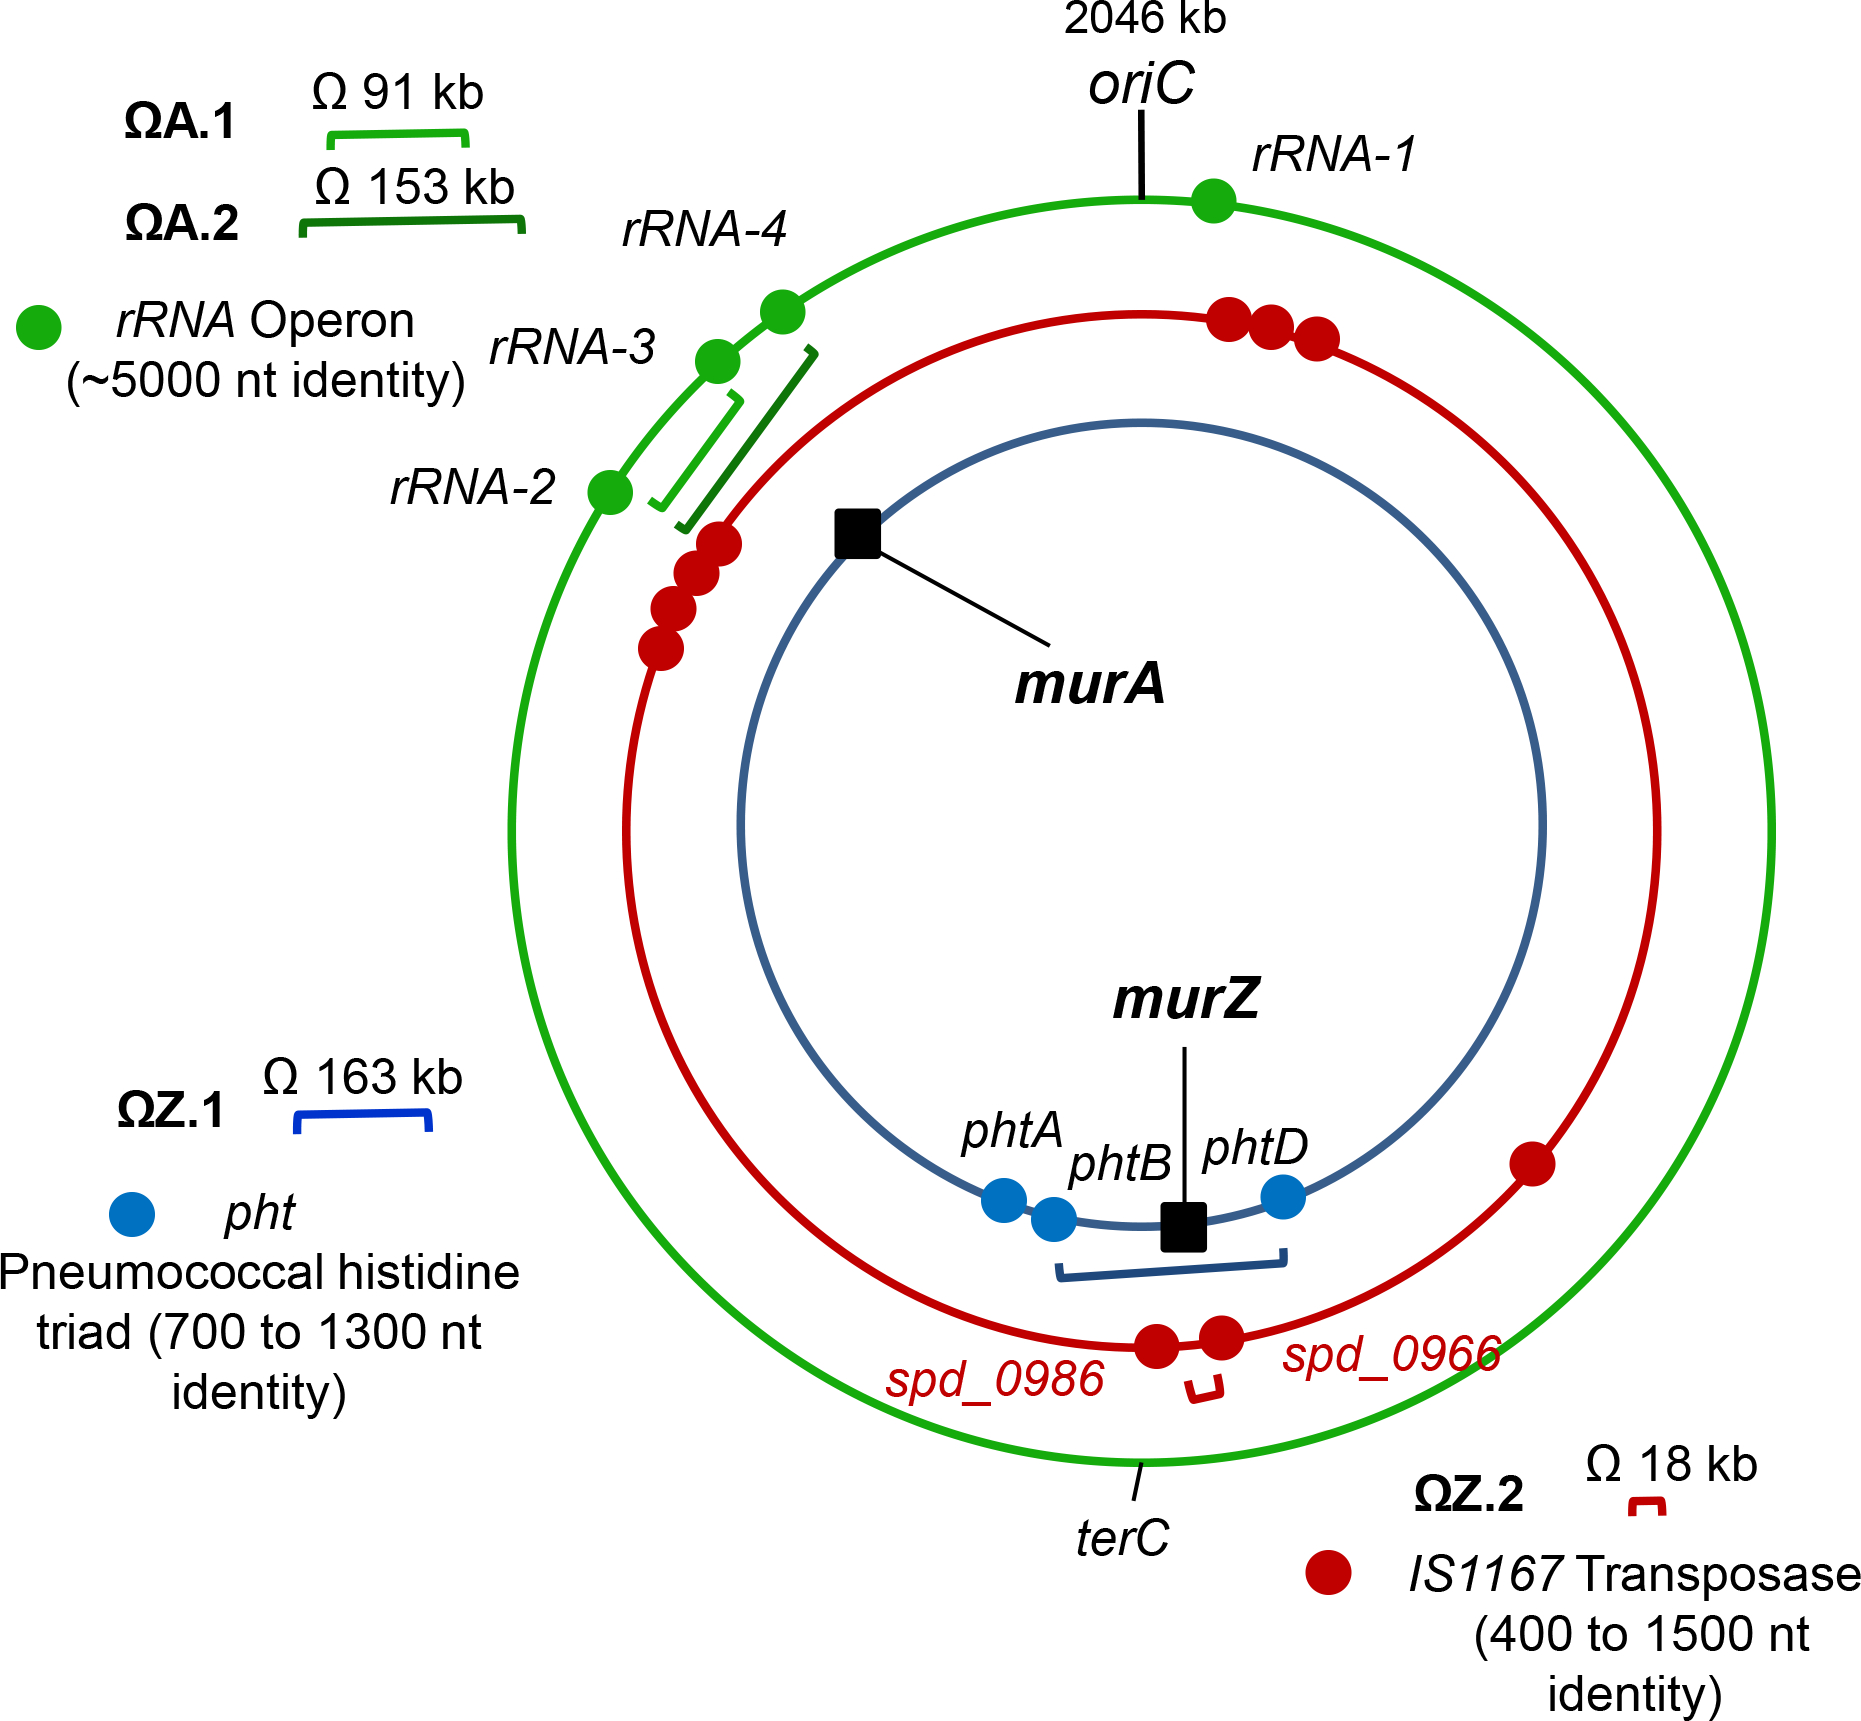
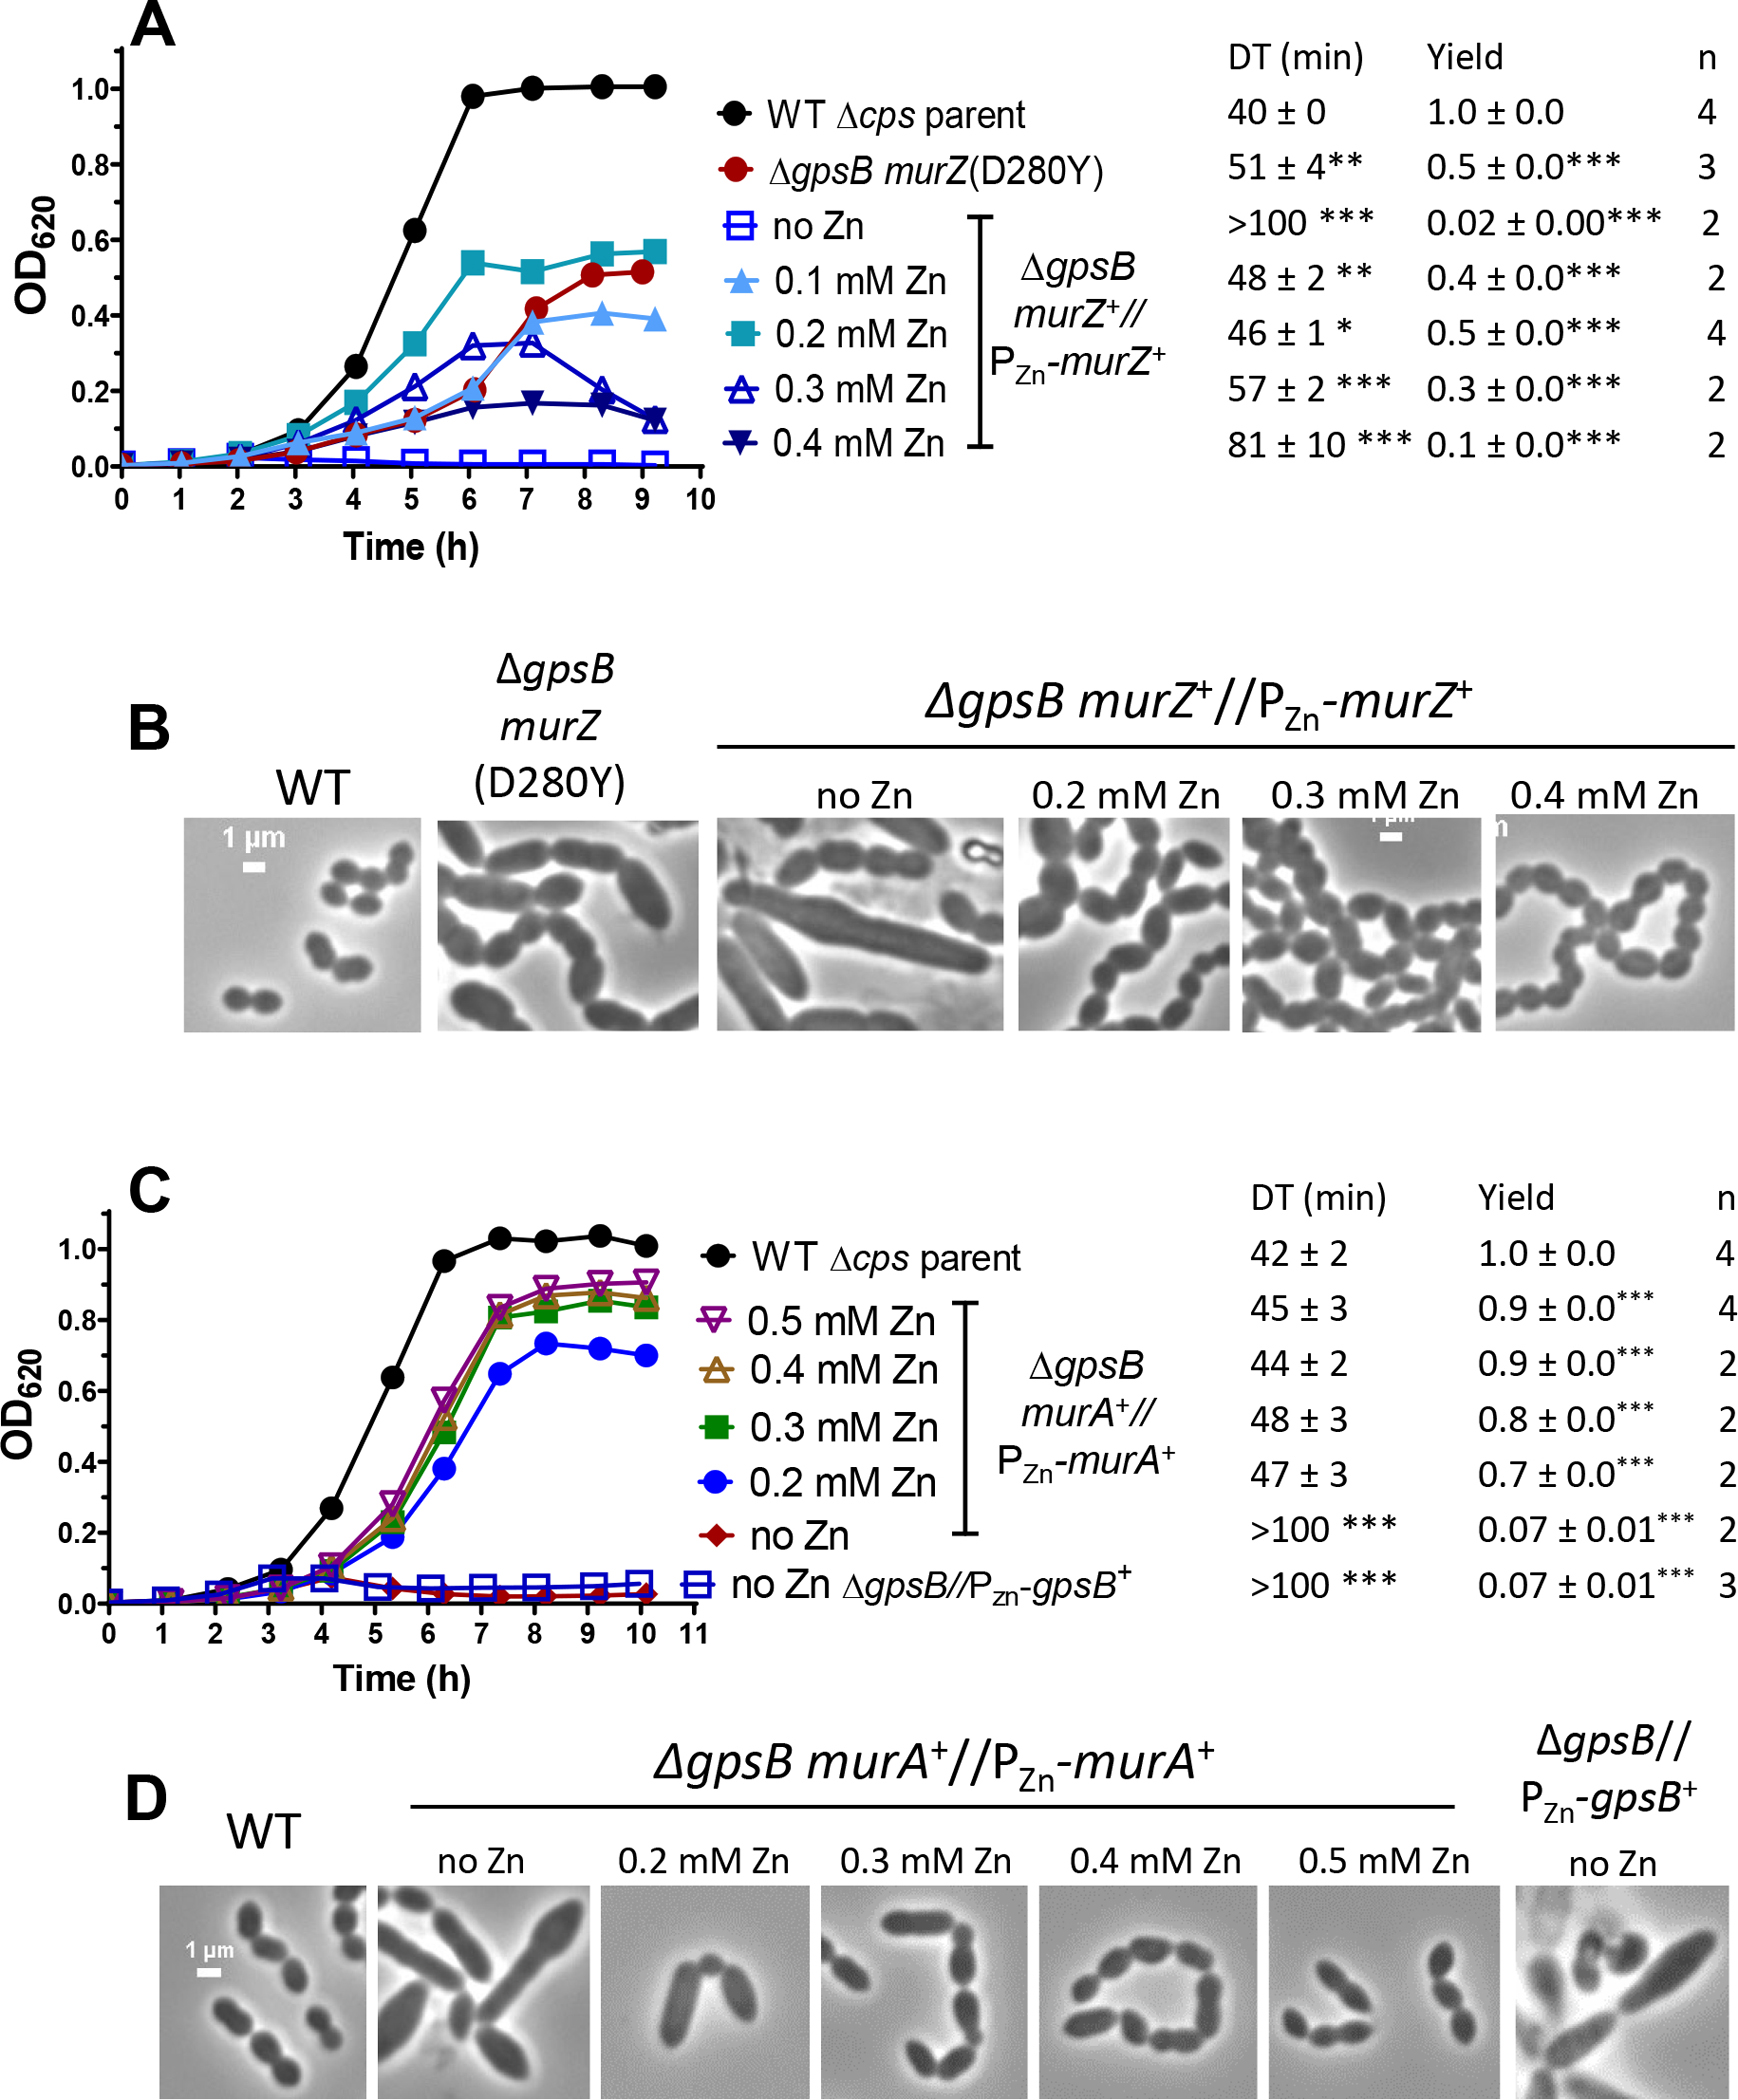
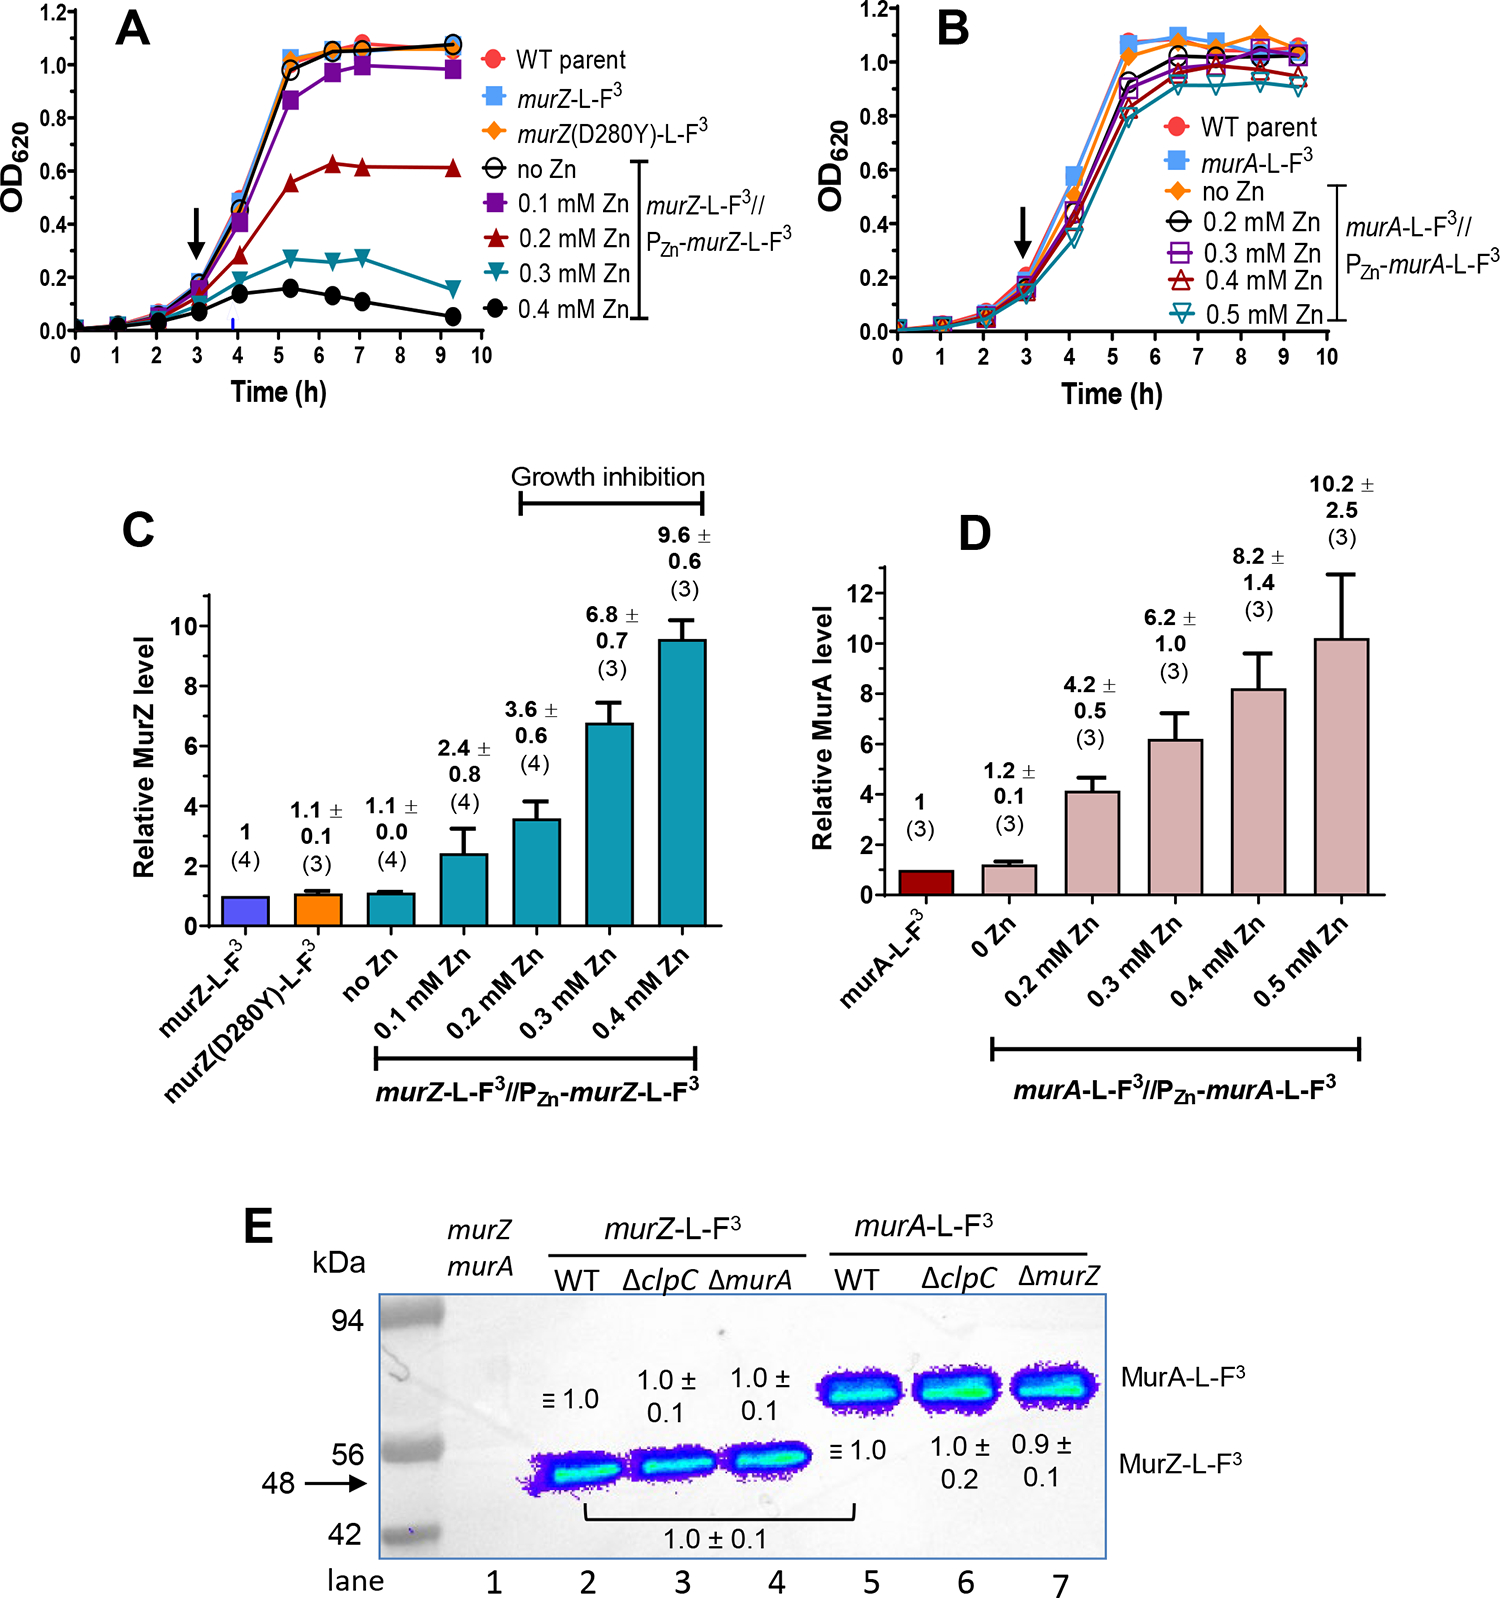
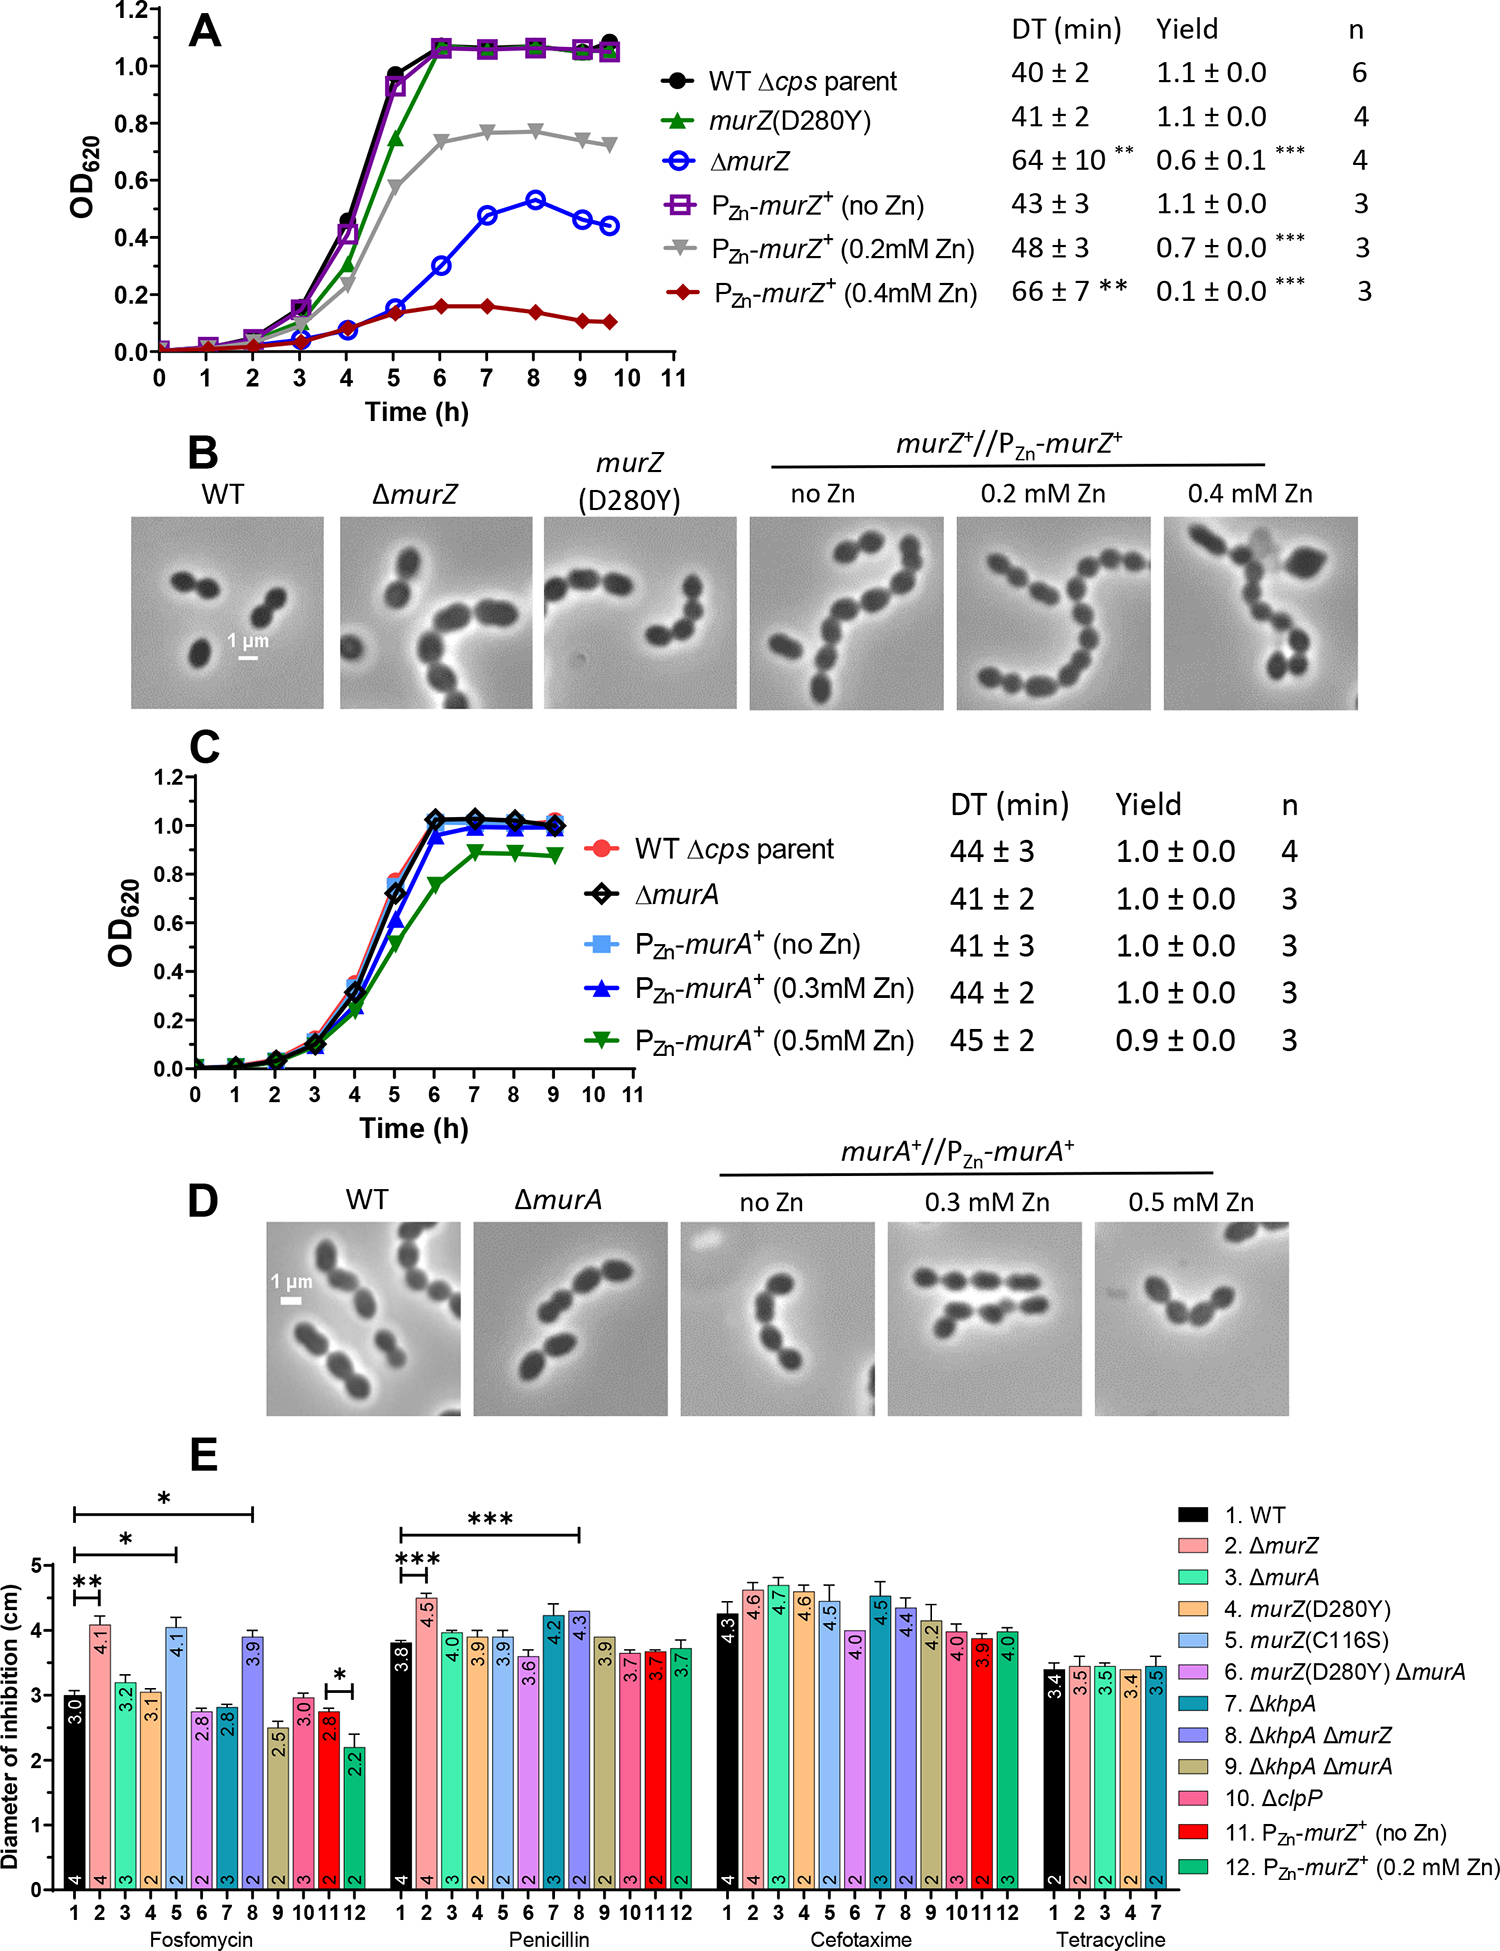
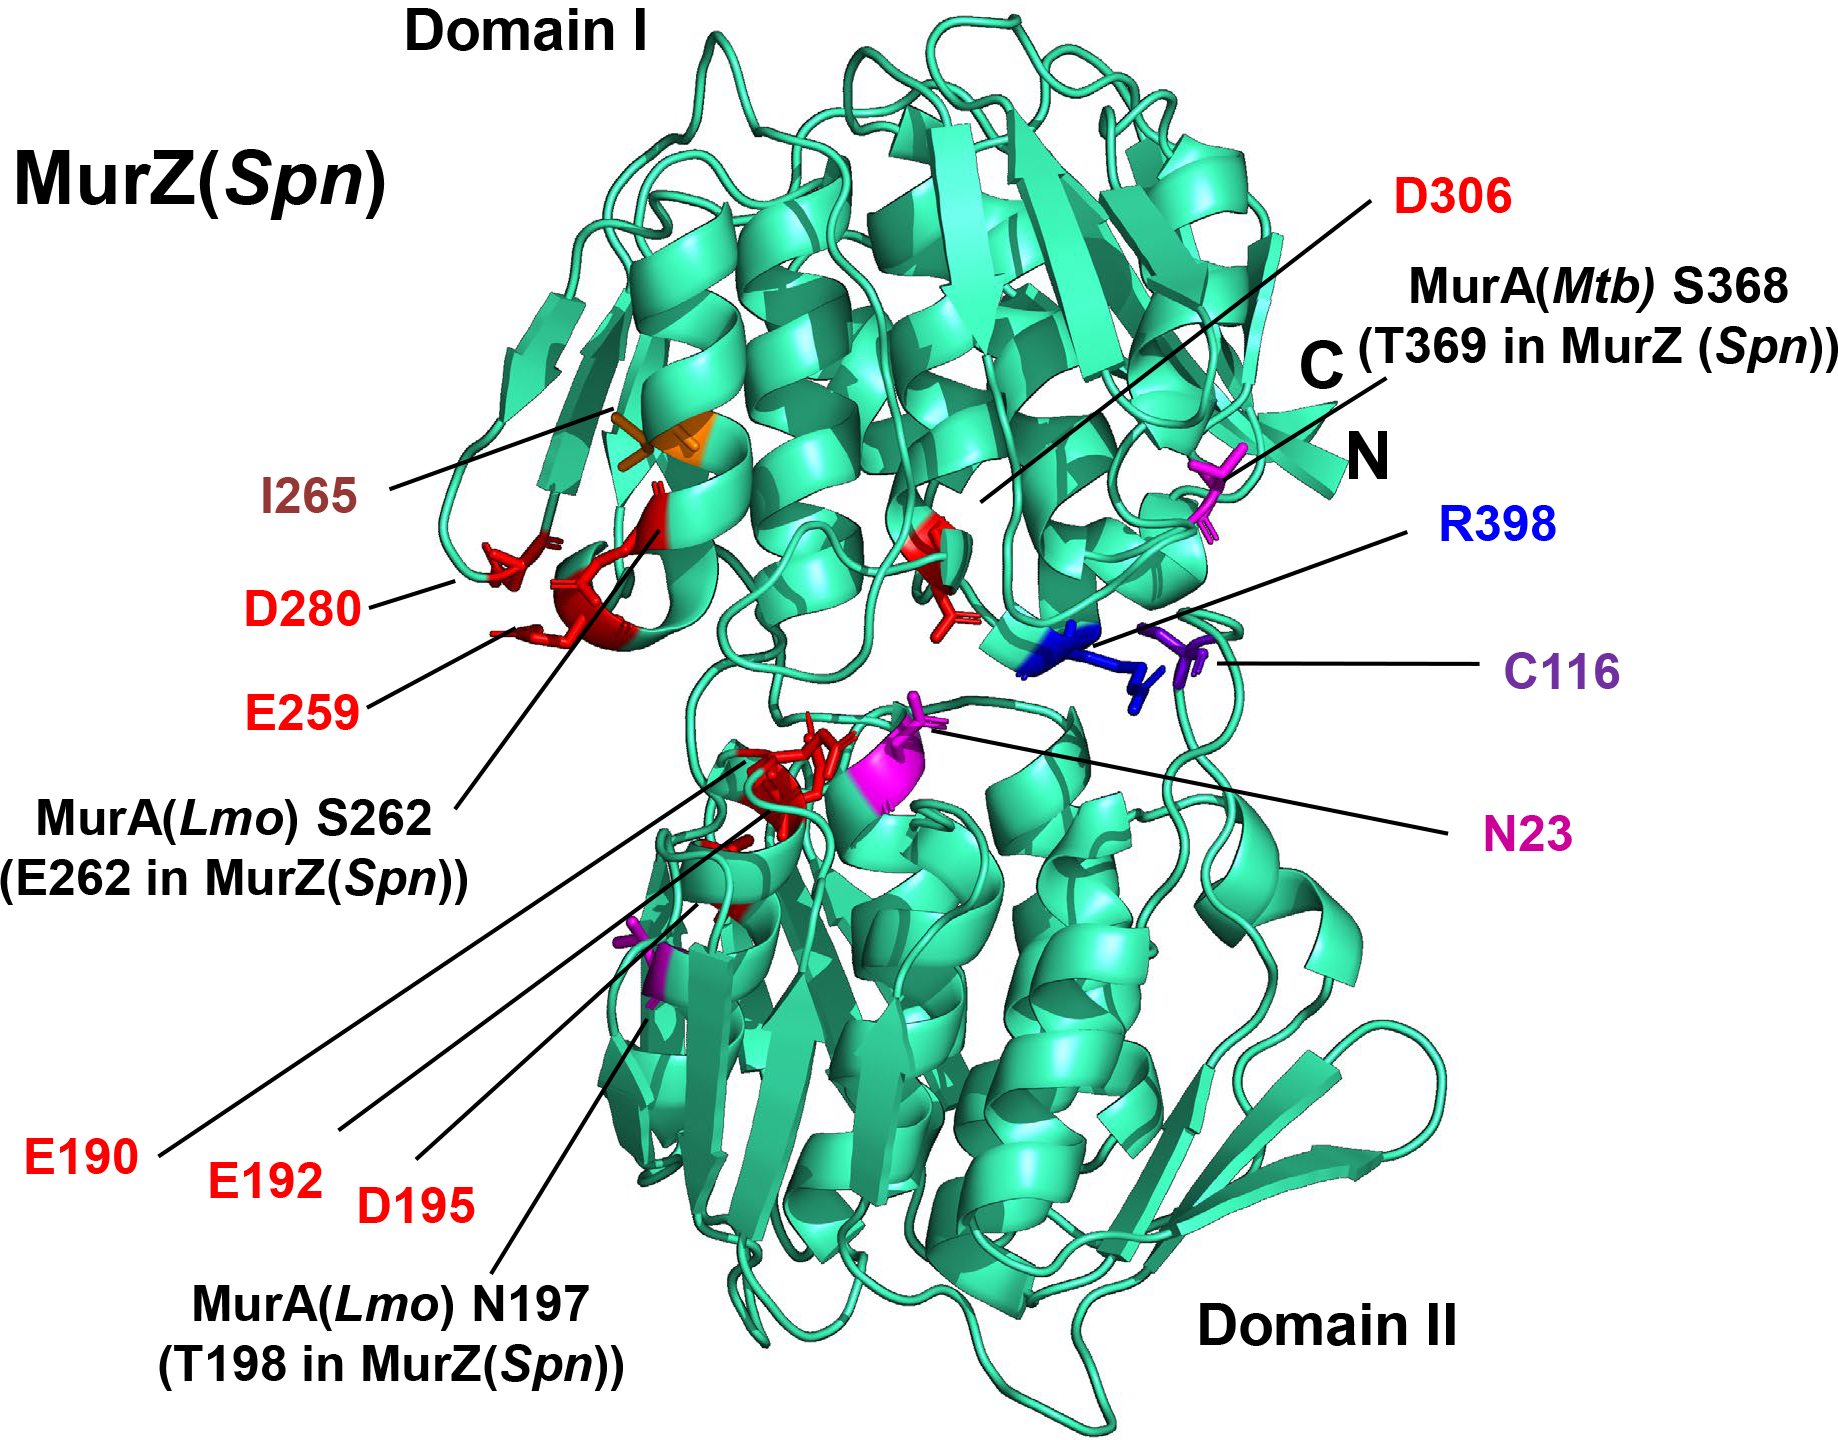
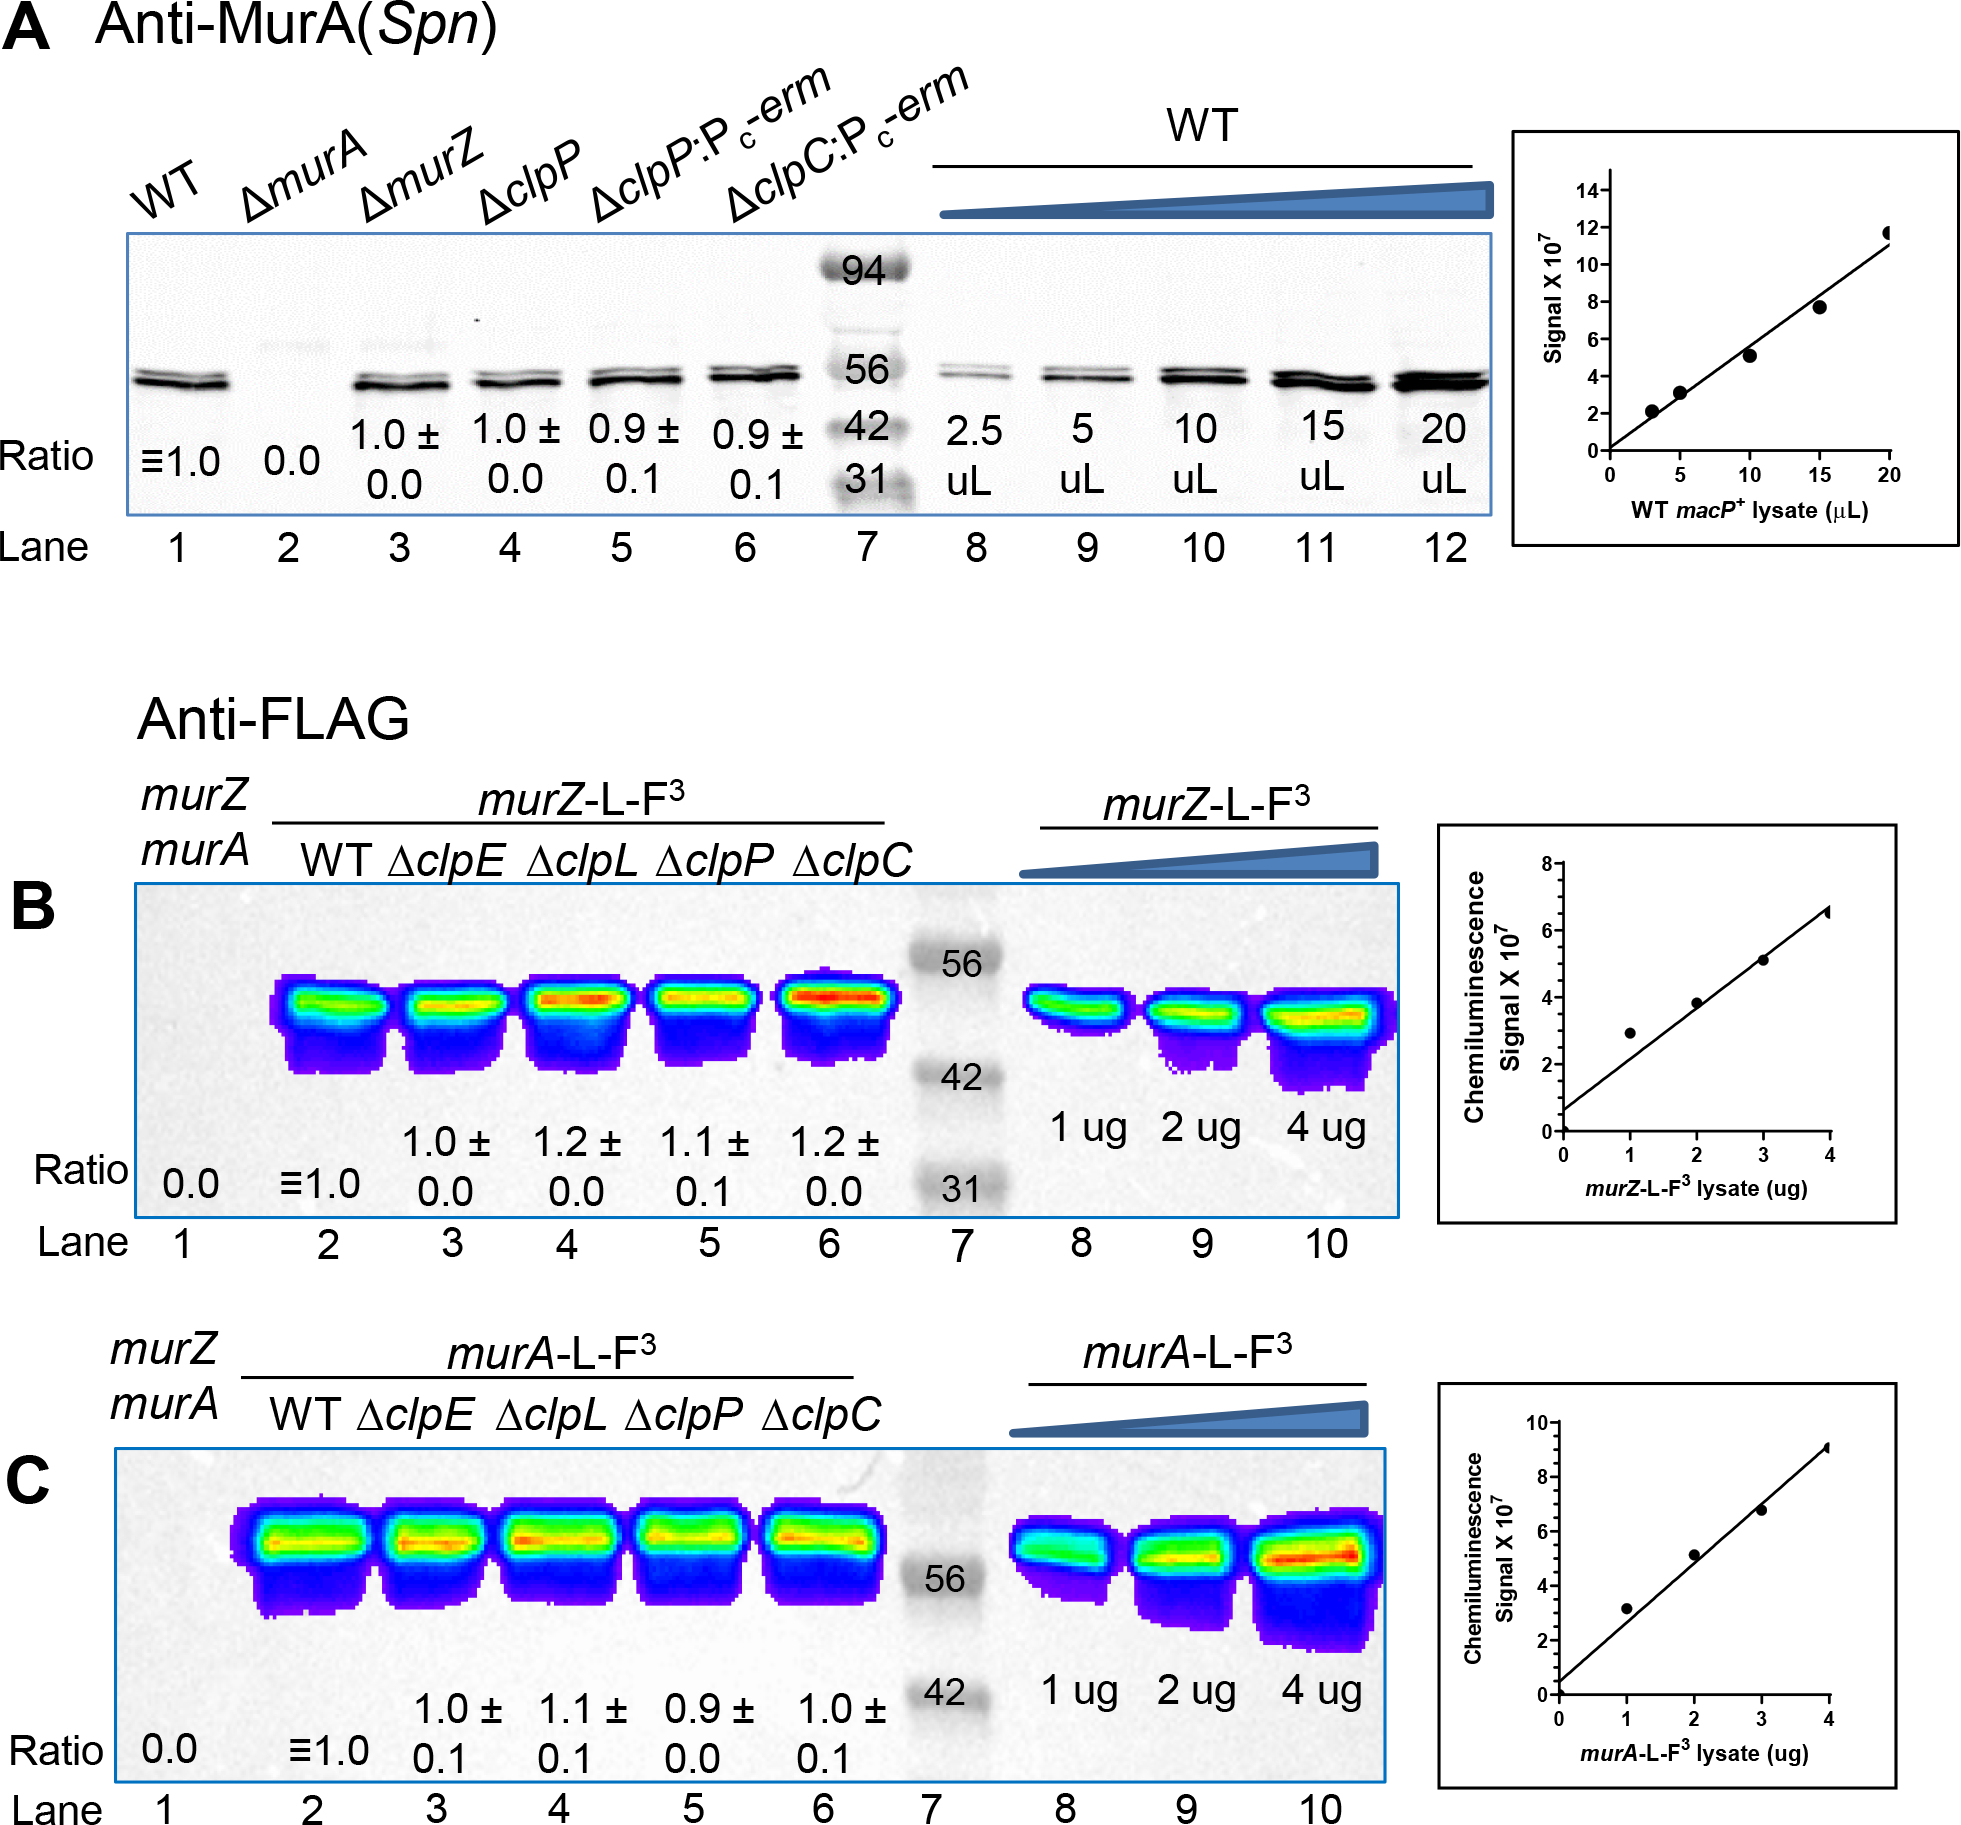
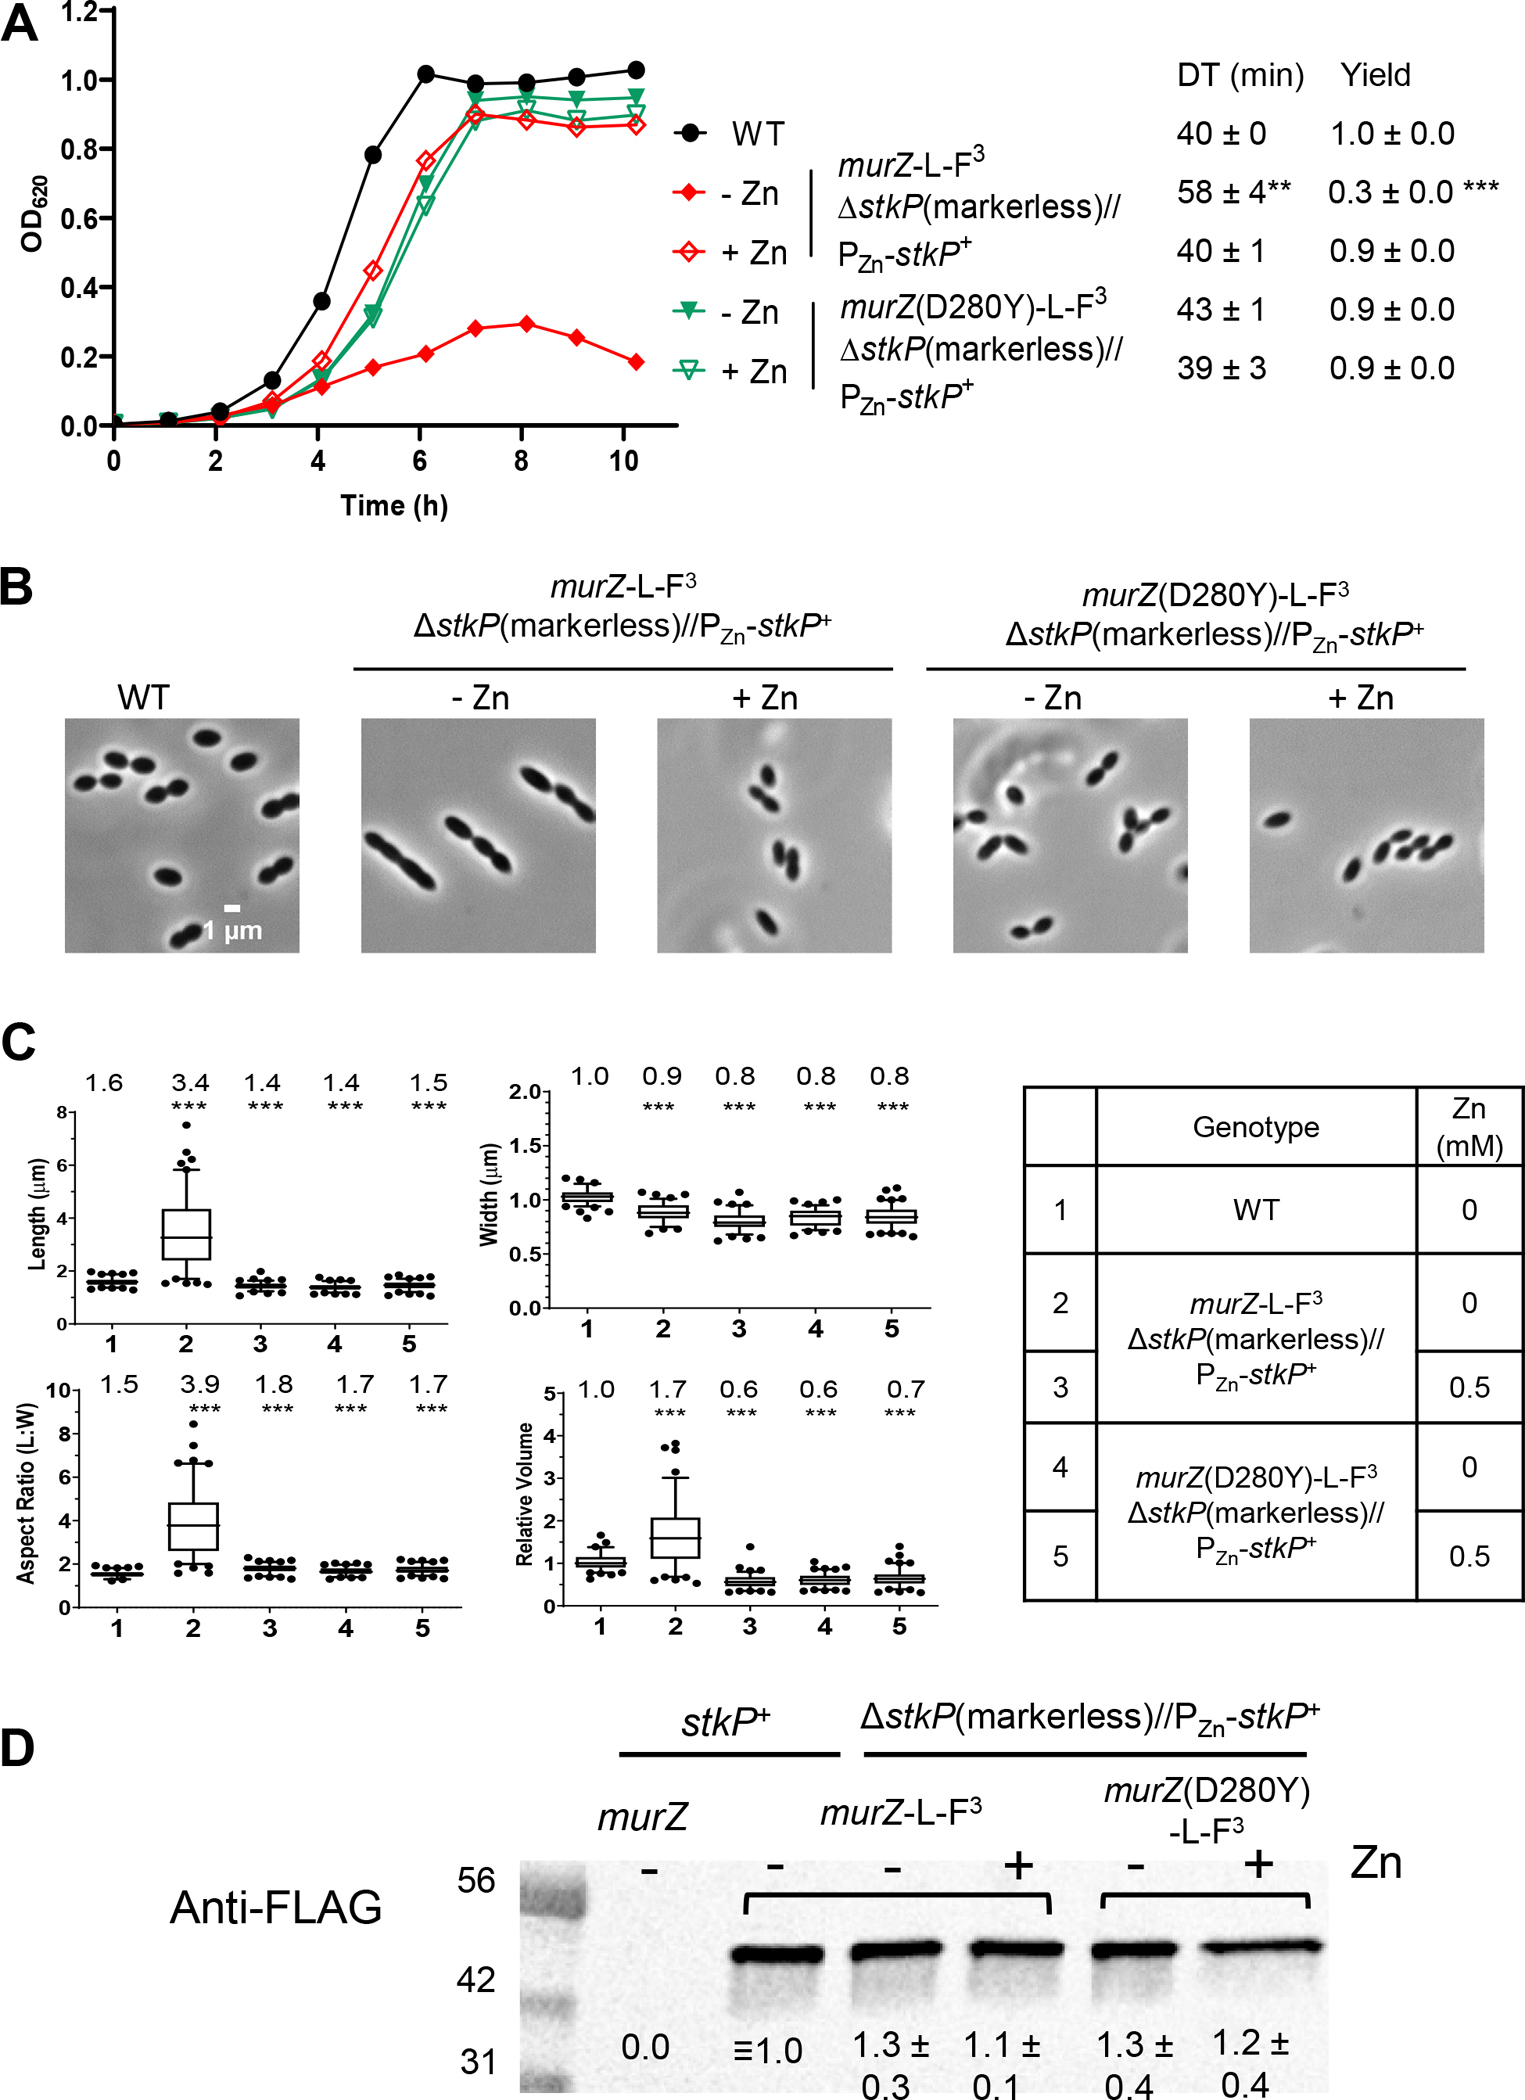
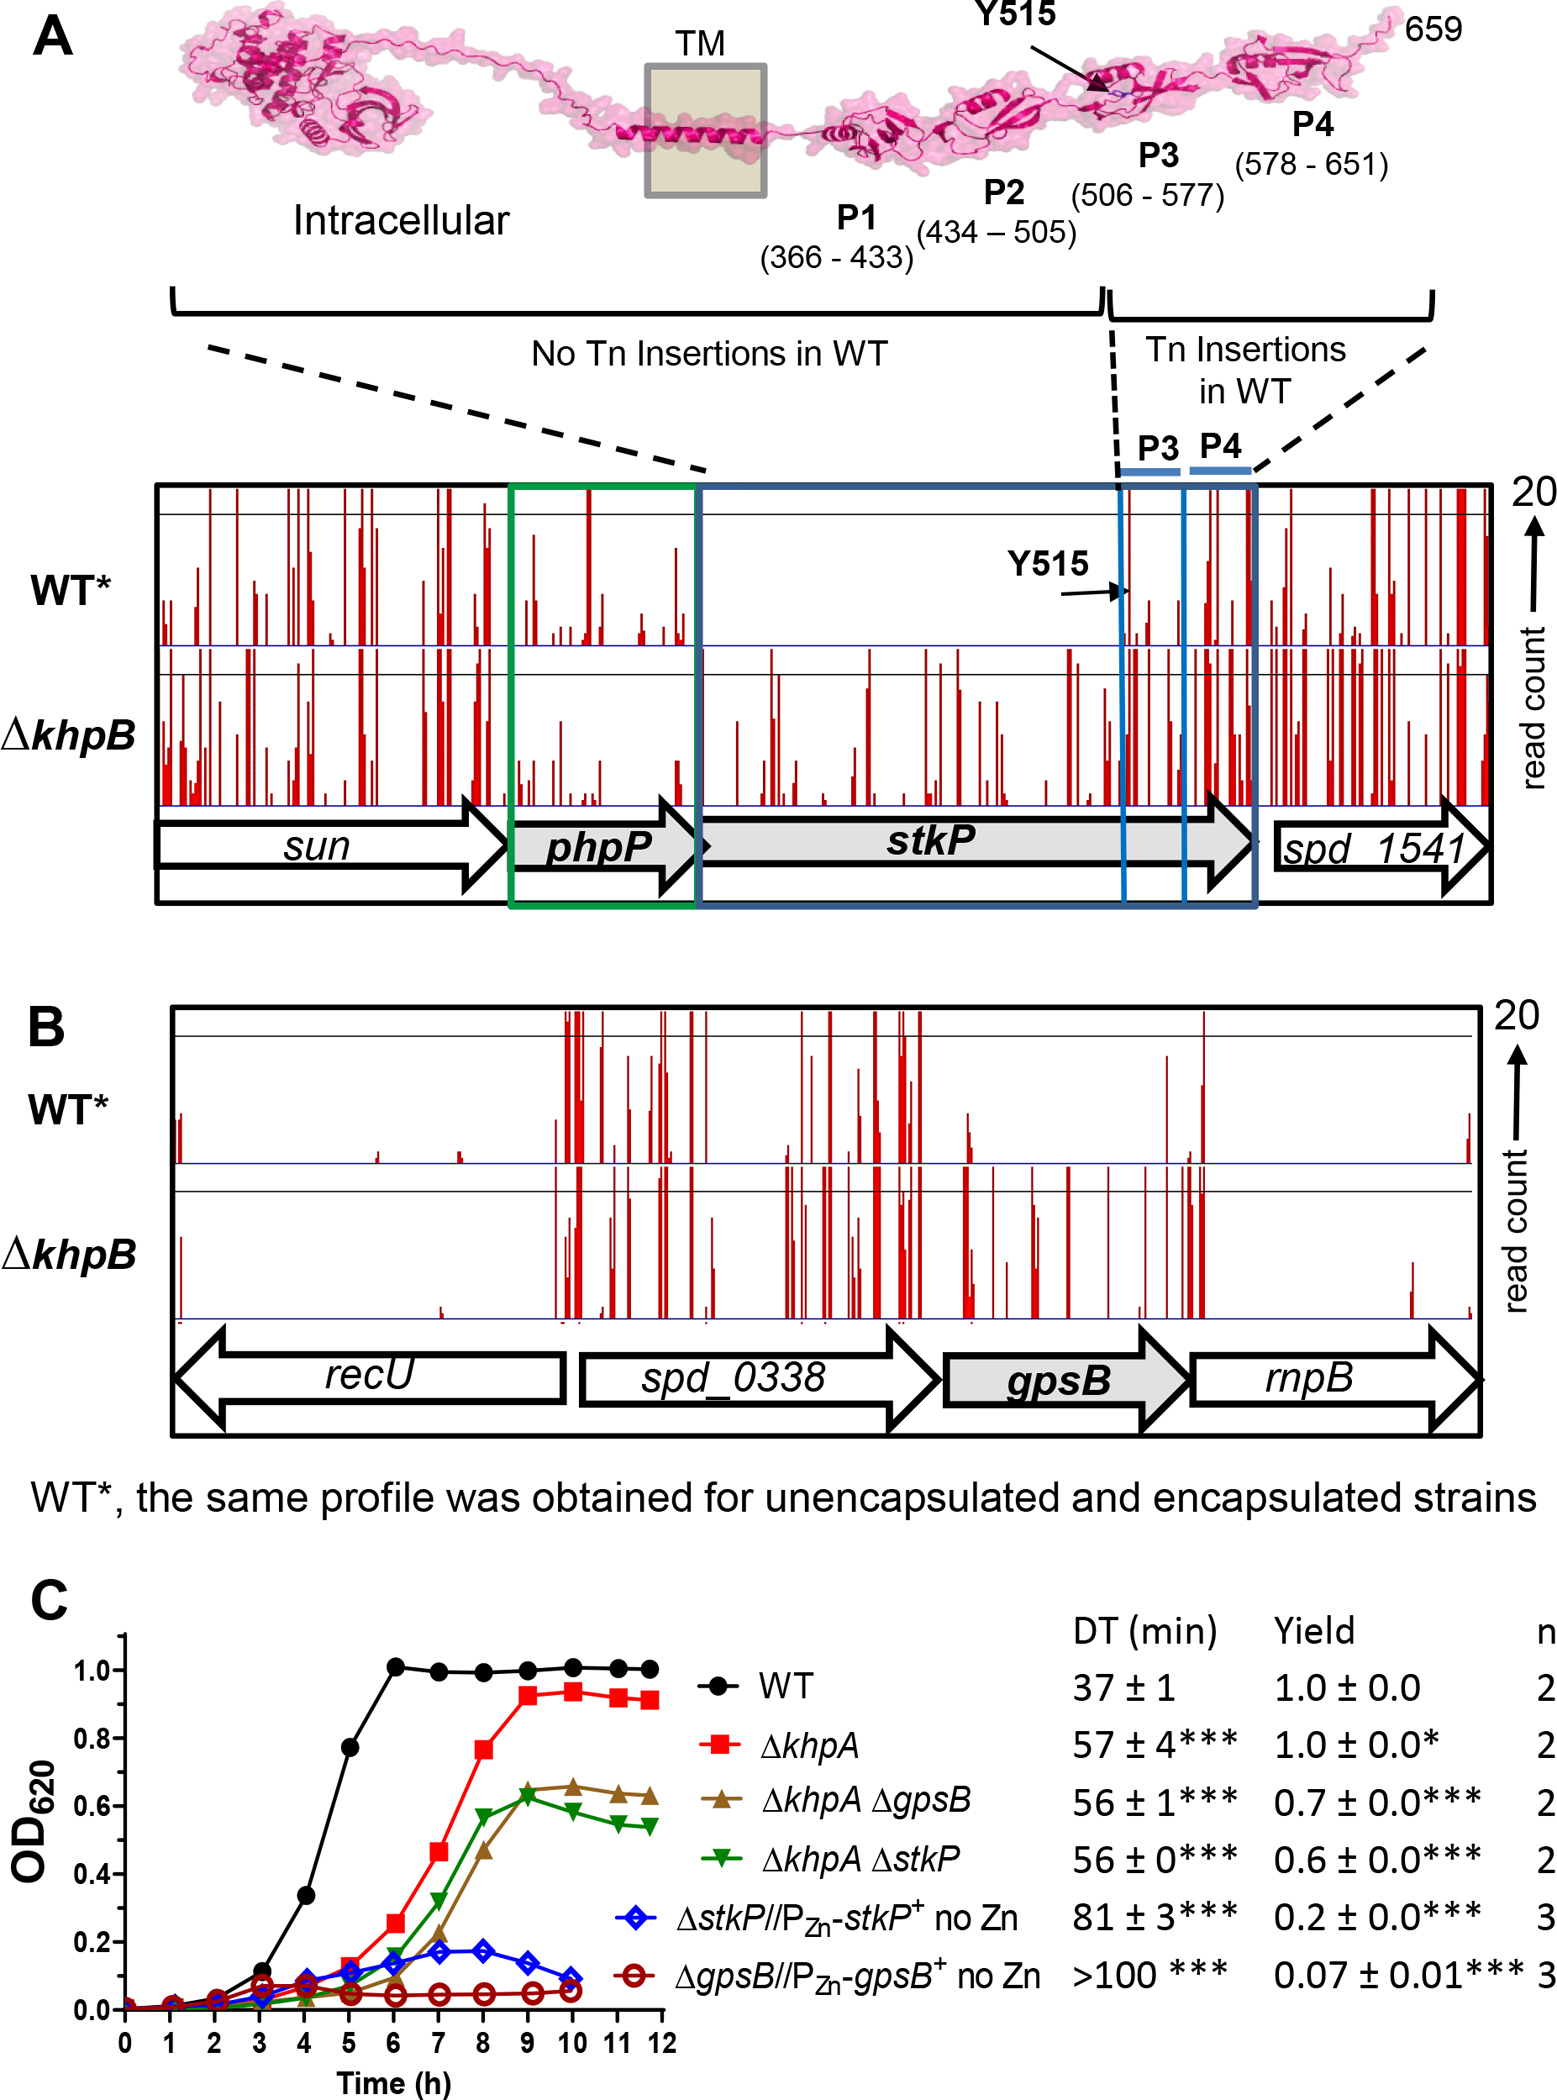
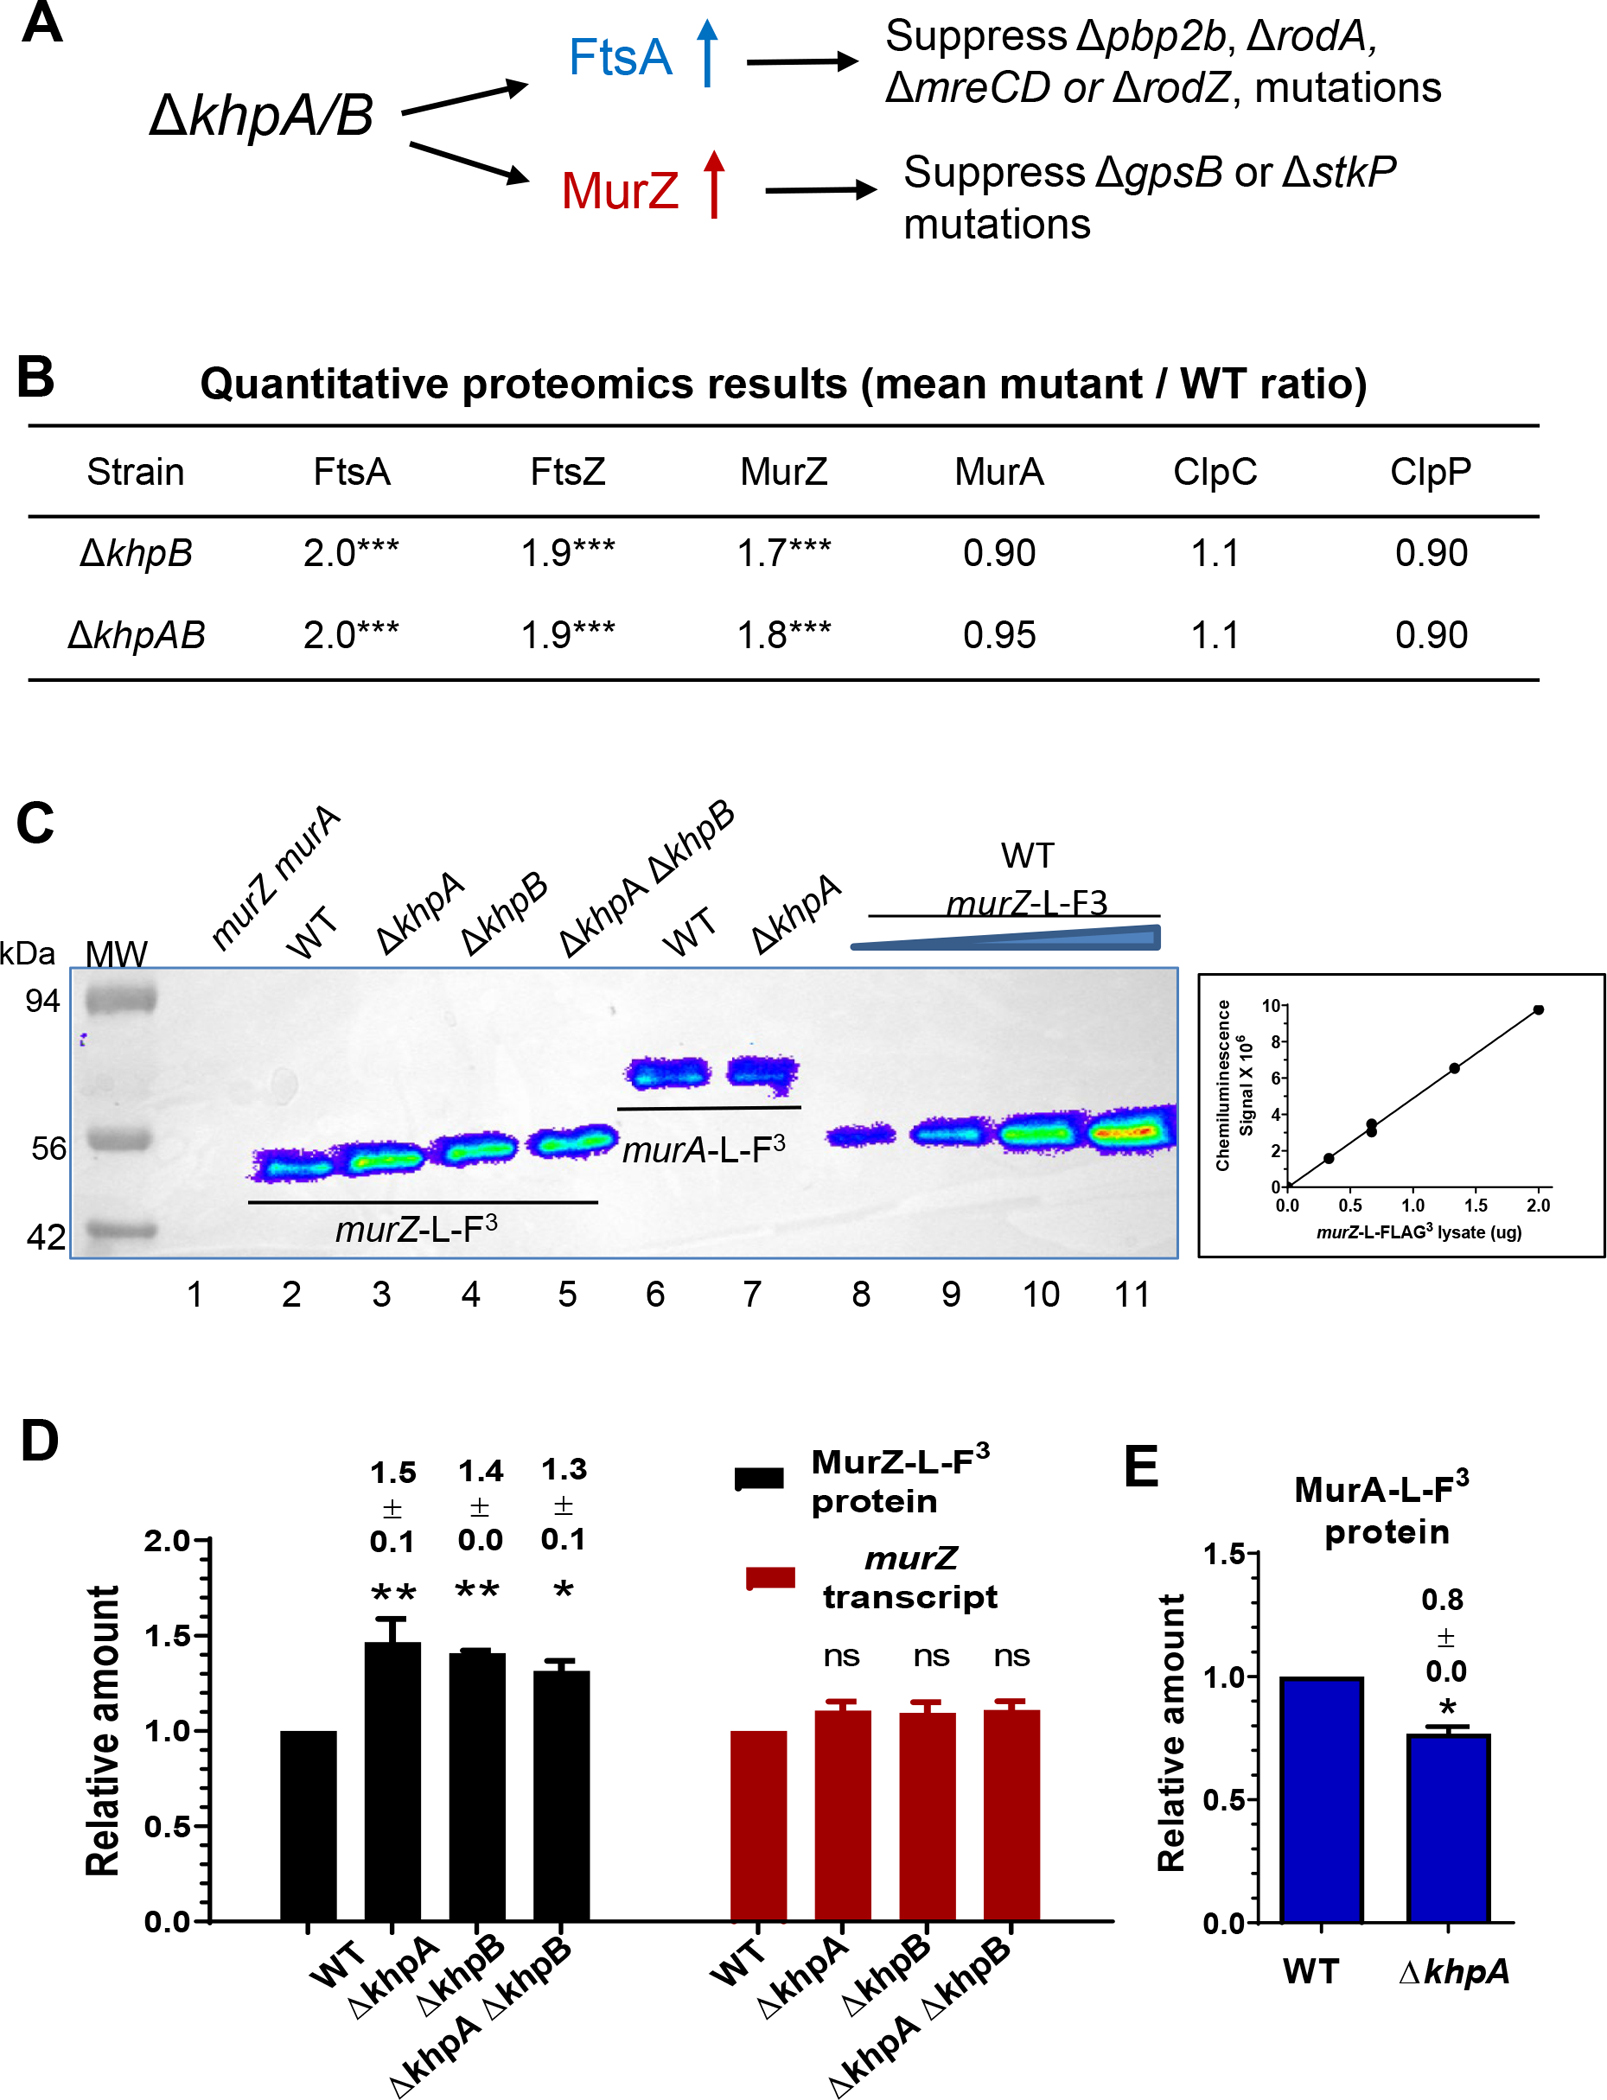
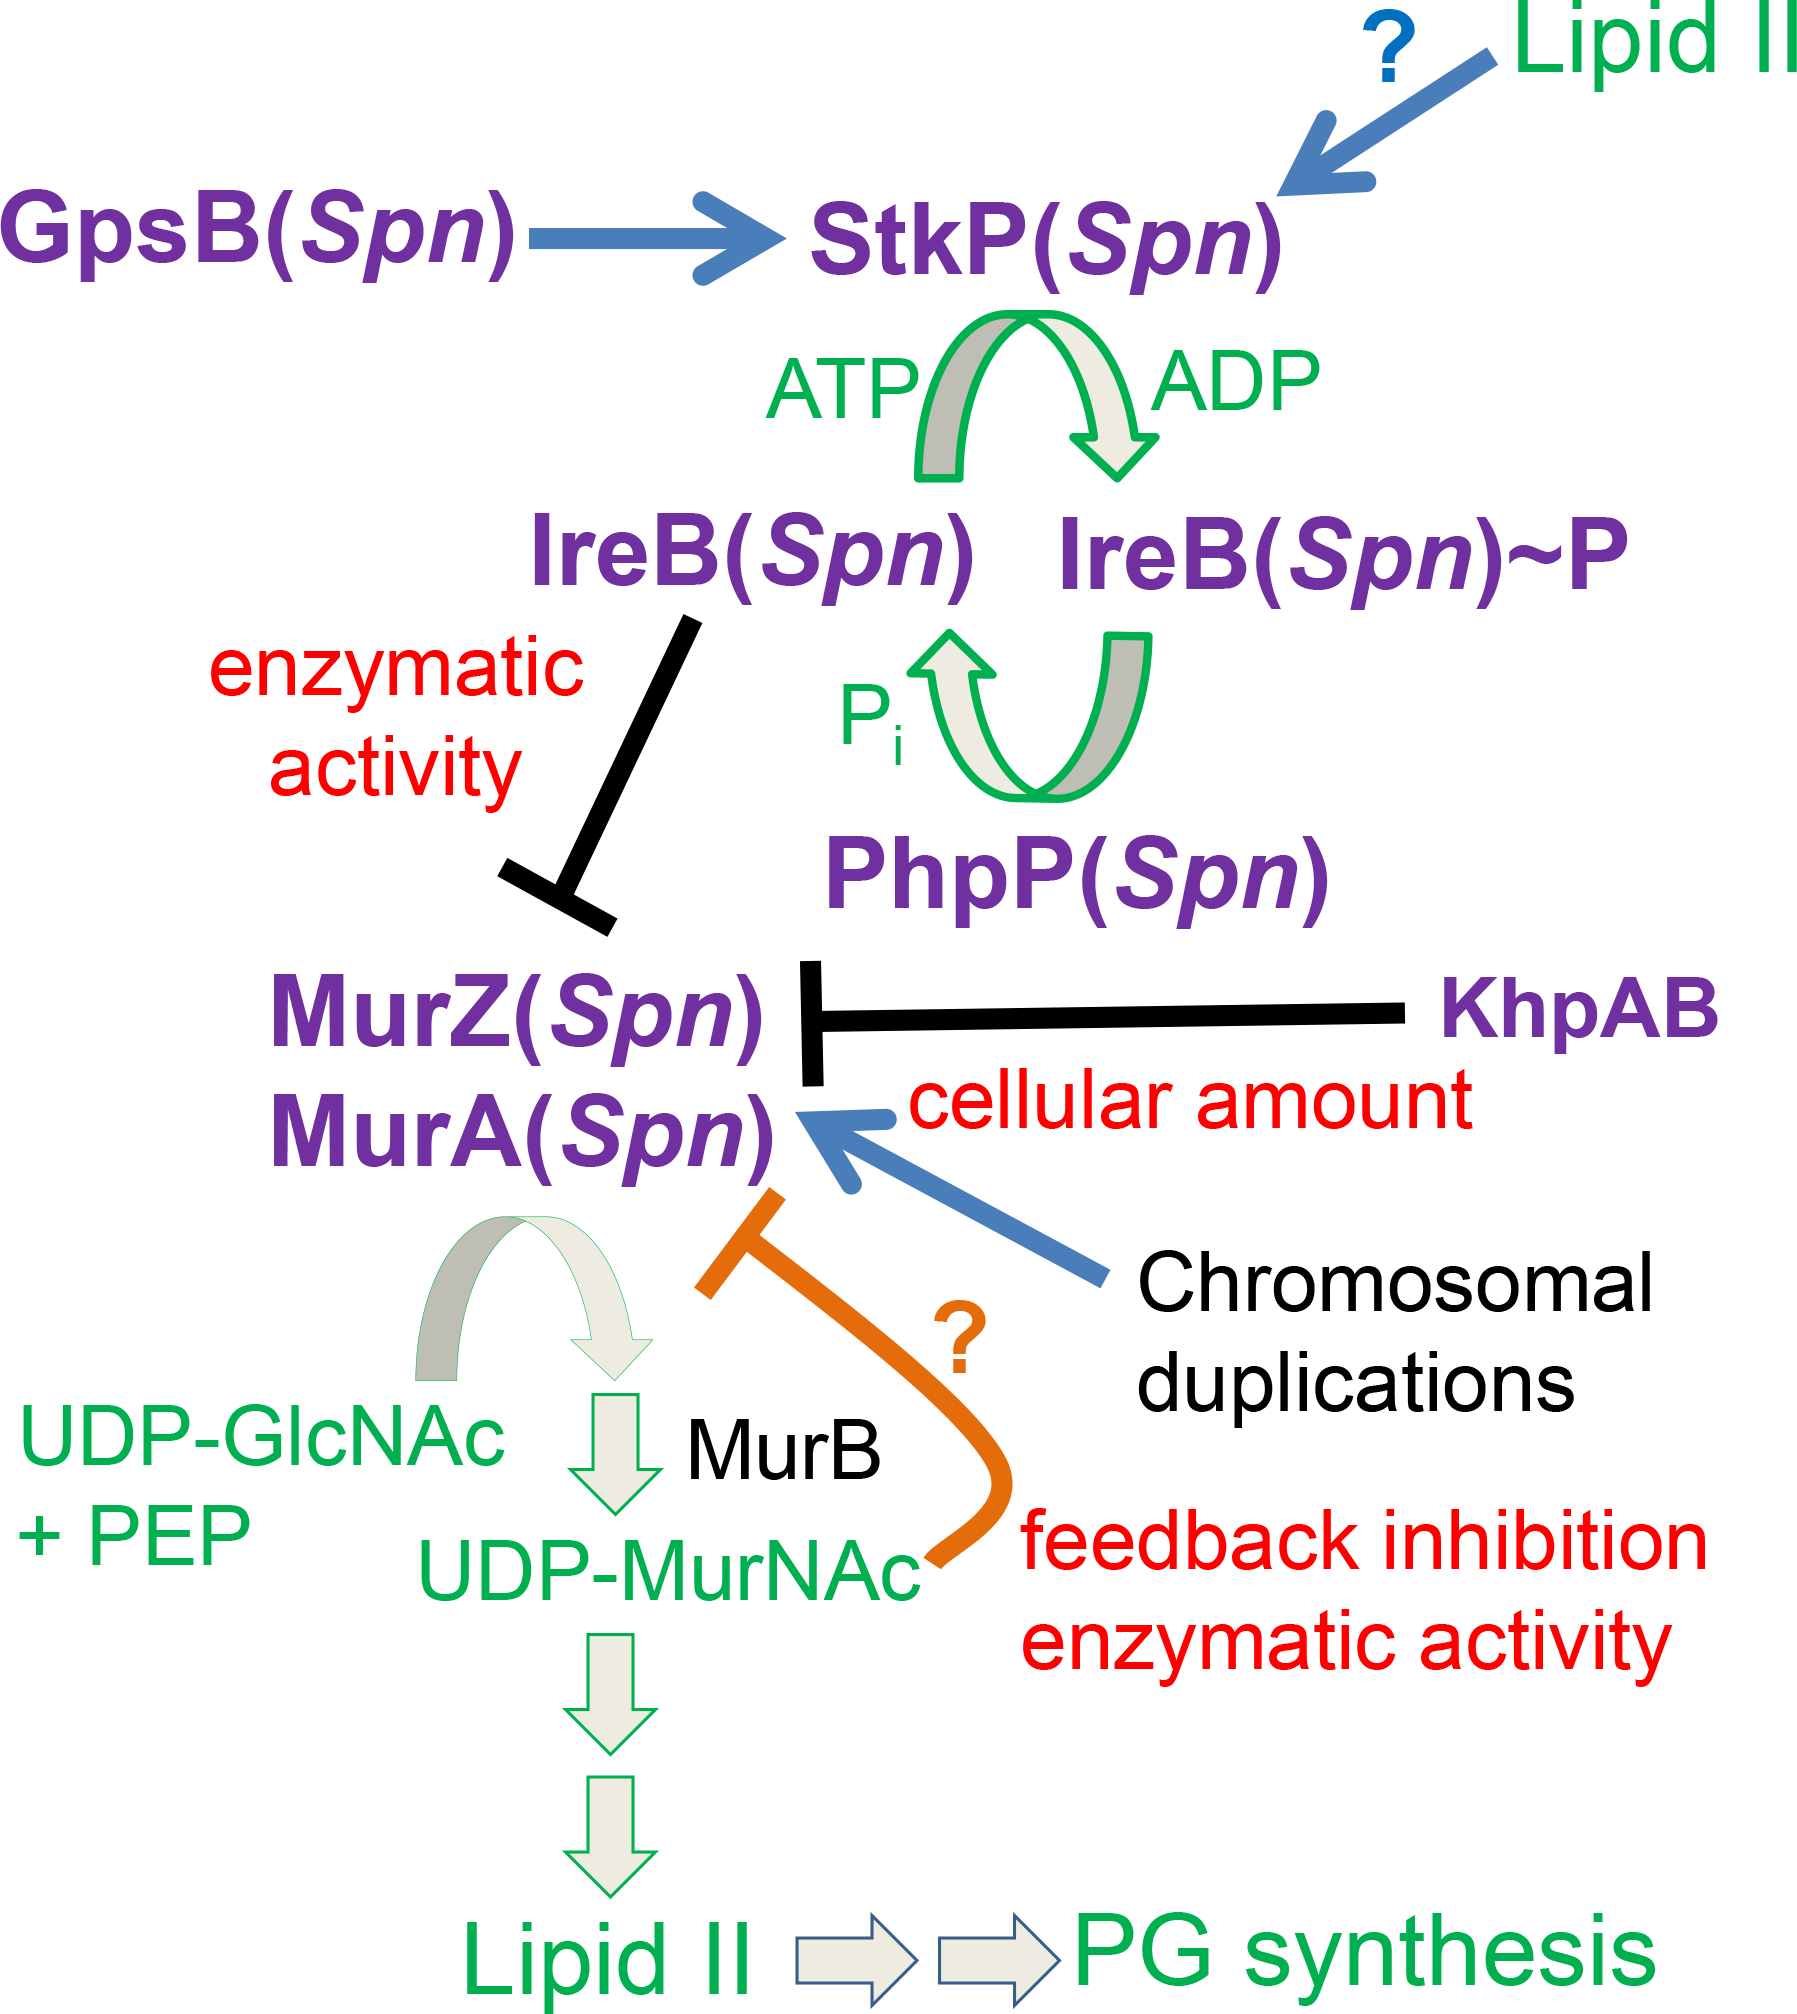
GpsB links peptidoglycan synthases to other proteins that determine the shape of the respiratory pathogen Streptococcus pneumoniae (pneumococcus; Spn) and other low-GC Gram-positive bacteria. GpsB is also required for phosphorylation of proteins by the essential StkP(Spn) Ser/Thr protein kinase. Here we report three classes of frequently arising chromosomal duplications (≈21-176 genes) containing murZ (MurZ-family homolog of MurA) or murA that suppress ΔgpsB or ΔstkP. These duplications arose from three different repeated sequences and demonstrate the facility of pneumococcus to modulate gene dosage of numerous genes. Overproduction of MurZ or MurA alone or overproduction of MurZ caused by ΔkhpAB mutations suppressed ΔgpsB or ΔstkP phenotypes to varying extents. ΔgpsB and ΔstkP were also suppressed by MurZ amino-acid changes distant from the active site, including one in commonly studied laboratory strains, and by truncation or deletion of the homolog of IreB(ReoM). Unlike in other Gram-positive bacteria, MurZ is predominant to MurA in pneumococcal cells. However, ΔgpsB and ΔstkP were not suppressed by ΔclpCP, which did not alter MurZ or MurA amounts. These results support a model in which regulation of MurZ and MurA activity, likely by IreB(Spn), is the only essential requirement for StkP-mediated protein phosphorylation in exponentially growing D39 pneumococcal cells.

Keywords: GpsB peptidoglycan regulator; KhpA/B RNA binding protein; StkP protein kinase; gene duplication and amplification; peptidoglycan precursor synthesis.


Conflict of interest statement

CONFLICT OF INTEREST

The authors declare that they have no conflicts of interests.

Figures

Figure 1.
Figure 1.. Two evolutionary branches of the MurA-family and MurZ-family homologs of S. pneumoniae and other Gram-positive bacteria.
(A) Nomenclature and function of MurA and MurZ homologs from six Gram-positive bacteria S. pneumoniae (Spn) (Du et al.), E. faecalis (Efa) (Vesic & Kristich, 2012), B. subtilis (Bsu) (Kock et al., 2004), B. anthracis (Ban) (Kedar et al., 2008), L. monocytogenes (Lmo) (Rismondo et al., 2017), and S. aureus (Sau) (Blake et al., 2009). (B) Partial evolutionary tree of the MurZ-family and MurA-family homologs from five Gram-positive bacteria S. pneumoniae, E. faecalis, S. aureus, B. subtilis, and L. monocytogenes, and the single MurA-homolog in Gram-negative bacterium E. coli. MurZ(Spn) (Spd_0967)(Spn) is phylogenetically closely related to MurAB(Efa), MurAB(Bsu), MurZ(Sau), and MurZ(Lmo), while MurA(Spn) (Spd_1764) is phylogenetically closely related to MurAA(Efa), MurAA(Bsu), MurA(Sau), and MurA(Lmo). Note that in the original annotation of the S. pneumoniae D39 genome, the MurZ(Spn) homolog was called “MurA1” and the MurA(Spn) homolog was called “MurA2” (Lanie et al., 2007, Slager et al., 2018). For consistency with the field, the revised nomenclature in the table is used.
Figure 2.
Figure 2.. Chromosomal duplications containing murZ or murA are present in ΔgpsB or ΔstkP suppressor strains of S. pneumoniae D39.
(A) Snapshot of genome browser output of ΔgpsB sup strains from genome coordinates 870 to 1100 kb. Three new ΔgpsB suppressor strains contain chromosomal duplication or quadruplication of multiple genes, all of which include murZ. Sup gpsB-8 contains a ≈163 kb duplication of chromosomal region from spd_0889’ to spd_1037’, while sup gpsB-9 and sup gpsB-10 contain a duplication or quadruplication, respectively, of the chromosomal region from spd_0966’ to spd_0986’. sup gpsB-10 has a murZ(D280Y) mutation and no chromosomal duplication. Black lines point to the flanking regions of the duplication found in sup gpsB-8, which are 1324-bp inverted repeats present in phtD (spd_0889) and phtB (spd_1037), encoding 2 of the 3 pneumococcal histidine triad proteins. The red lines point to the flanking regions (spd_0966 and spd_0986) of duplication or quadruplication found in sup gpsB-9, and -10, respectively. spd_0966 and spd_0986 are pseudogenes containing IS1167 degenerate transposase sequences. Thick blue arrows show the gene orientations of phtB, phtD, spd_0966, and spd_0986. (B) Snapshot of genome browser output of ΔstkP sup strains from genome coordinates 750 to 2,000 kb. (C) Sup stkP-1 contains a duplication/deletion between phtD and phtB, and sup stkP-2 contains a duplication between spd_0966 and spd_0986. (D) Large duplications found in sup stkP-3 and -4 are flanked by tRNA + rRNA clusters rRNA/rRNA3 and rRNA/rRNA4 respectively. Sup stkP-3 showed a decrease in sequence reads of the four rRNA-1–4 operons (rRNA-1, rRNA-2, rRNA-3, and rRNA-4) compared to the surrounding region. It is possible that either rRNA-2 or rRNA-3, or both rRNA-2 and rRNA-3, are deleted in this strain, but because of the sequence identity of the rRNA operons, deletion of one or two operons manifest as a decrease of reads for all four operons.
Figure 3.
Figure 3.. Locations of repeated sequences that anchor chromosomal duplications in S. pneumoniae D39.
Blue, red, and green dots are locations of pht genes, IS1167 transposase, and tRNA/rRNA gene clusters, respectively. Duplications ΩZ.1 and ΩZ.2 result in duplication of murZ and surrounding genes, while ΩA.1 and ΩA.2 result in murA duplication. ΩZ.1 is present in sup gpsB-8. ΩZ.2 is present in sup gpsB-9, sup gpsB-10, and sup stkP-2. ΩA.1 is present in sup stkP-3 while ΩA.2 is present in sup stkP-4.
Figure 4.
Figure 4.. murZ(D280Y) and overexpression of murZ or murA partially suppress ΔgpsB growth and morphology phenotypes.
(A and B) Parent D39 Δcps rpsL1 strain (IU1824), murZ(D280Y) ΔgpsB strain (IU13509), and ΔgpsB murZ+//PZn-murZ+ (IU15860) strain were grown overnight in BHI broth with no (IU1824, IU13509) or 0.2 mM (Zn2+/(1/10)Mn2+) (IU15860), respectively. Overnight cultures were diluted to OD620 ≈0.003 in the morning in BHI broth for IU1824 and IU13509 and in BHI broth containing Zn2+/(1/10)Mn2+ for IU15860 as indicated. (A) Left, representative growth curves. Right, averages ± SEMs of doubling times (DT) and maximal growth yields (OD620) during 9 h of growth. n denotes number of independent growths. ***, p< 0.001 when compared to WT strain with one-way ANOVA analysis (GraphPad Prism, Dunnett’s test). DTs and growth yields without asterisks were statistically insignificant compared to values obtained from WT. (B) Representative phase-contrast images taken between at 3 to 3.5 h for IU1824, and between 3.5 to 4.5 h for IU13509 and IU15860. Scale bar = 1 μm. (C and D) Parent D39 Δcps rpsL1 strain (IU1824), ΔgpsB murA+//PZn-murA+ (IU15862), and ΔgpsB//PZn-gpsB+ (IU16370) were grown overnight in BHI broth with no (IU1824) or 0.5 mM (Zn2+/(1/10)Mn2+) (IU15862 and IU16370). Overnight cultures were diluted to OD620 ≈0.003 in the morning in BHI broth for IU1824 and IU16370 and in BHI broth containing (Zn2+/(1/10)Mn2+) as indicated for IU15862. Representative growth curves are shown along with averaged DT and growth yields. (D) Representative phase-contrast images taken at 3 h for IU1824 and IU16370 and between 4 to 4.5 h for IU15862. Box-and-whisker plots of cell dimensions of these strains are shown in Fig. S5.
Figure 5.
Figure 5.. Quantitative western blot assays showing nearly equivalent cellular amounts of MurZ-L-FLAG3 (-F3), MurZ(D280Y)-L-F3, and MurA-L-F3, overproduction levels of MurZ-L-FLAG3 and MurA-L-FLAG3, and lack of change when the other homolog or ClpC is deleted.
Strains tested in (A) and (C) were non-FLAG (F) - tagged murZ WT (IU1824), murZ-L-F3 (IU13502), murZ(D280Y)-L-F3 (IU13600), and murZ-L-F3//PZn-murZ-L-F3 (IU13772). Strains tested in (B) and (D) were non-F-tagged murA WT (IU1824), murA-L-F3 (IU14028), and murA-L-F3//PZn-murA-L-F3 (IU15983). Strains were grown overnight in BHI broth with no additional (Zn2+/(1/10)Mn2+), and diluted to OD620 ≈0.005 in the morning in BHI with no additional (Zn2+/(1/10)Mn2+), or in BHI broth containing 0.1, 0.2, 0.3 or 0.4 mM (Zn2+/(1/10)Mn2+) for IU13772, or in BHI broth containing 0.2, 0.3, 0.4 or 0.5 mM (Zn2+/(1/10)Mn2+) for IU15983. Black arrows point to the time (≈3 h) when samples were collected, except for IU13772 grown in the presence of 0.3 or 0.4 mM (Zn2+(1/10)Mn2+), where samples were collected at 3.6 h (blue arrow). (C) and (D) Quantitative western blotting using anti-FLAG antibody was performed as described in Experimental procedures. Calculated averages and SEMs of relative MurZ-L-F3 or MurA-L-F3 protein amounts were obtained from three or more independent experiments using anti-FLAG antibody. The numbers above each bar are averages ± SEM obtained for the number of independent biological replicates indicated in parentheses. Representative western blots are presented in Fig. S8. (E) Representative western blot showing similar cellular amounts of MurZ-L-F3 in ΔclpC or ΔmurA strains as in WT, similar cellular amounts of MurA-L-F3 in ΔclpC or ΔmurZ strains as in WT, and similar cellular amounts of WT MurZ-L-F3 and WT MurA-L-F3. Lane 1, Wild-type (IU1824); lane 2, murZ-L-F3 (IU13502); lane 3, murZ-L-F3 ΔclpC (IU14082); lane 4, murZ-L-F3 ΔmurA (IU14084); lane 5, murA-L-F3 (IU14028); lane 6, murA-L-F3 ΔclpC (IU14086); lane 7, murA-L-F3 ΔmurZ (IU14088). Numbers above MurZ-L-F3 or below MurA-L-F3 bands are calculated protein amounts (mean ± SEM) relative to murZ-L-F3 (lane 2) or murA-L-F3 (lane 5) based on three independent experiments with ΔclpC strains and two independent experiments with ΔmurZ or ΔmurA strains. 0.67 μg of protein was loaded into each lane. The predicted molecular masses of both MurZ-L-F3 and MurA-L-F3 are 48 kDa; however, MurA-L-F3 (and untagged MurA(Spn) (data not shown)) migrate slower than their predicted molecular weights.
Figure 6.
Figure 6.. Overproduction or absence of MurZ(Spn), but not MurA(Spn), alters growth, morphology, and sensitivity to fosfomycin or penicillin.
(A and B) Parent D39 Δcps rpsL1 strain (IU1824), constructed murZ(D280Y) (IU13438), ΔmurZ (IU13536), and merodiploid murZ+//PZn-murZ+ (IU13393) strains were grown overnight in BHI broth with no additional (Zn2+/(1/10)Mn2+) and diluted to OD620 ≈0.003 in the morning in BHI broth with or without (Zn2+/(1/10)Mn2+) at the concentrations indicated. (A) Representative growth curves and averaged DT and yields. ** p< 0.01; *** p < 0.001 compared to WT strain by one-way ANOVA analysis (GraphPad Prism, Dunnett’s test). (B) Representative phase-contrast images taken between 3.5 to 4 h of growth for all strains and conditions, except for IU13393 with 0.4 mM (Zn2+(1/10)Mn2+), which was taken at 5 h of growth. (C and D) Parent D39 Δcps rpsL1 strain (IU1824), ΔmurA (IU13538), and merodiploid murA+//PZn-murA+ (IU13395) strains were grown similarly to the murZ strains described above. The DTs and growth yields of all strains and conditions were not statistically different from the values obtained for the WT strain. (D) Representative phase-contrast images taken at 3 h of growth for all strains and conditions. All micrographs in (B) and (D) are at the same magnification (scale bar = 1 μm). Box-and-whisker plots of cell dimensions of murZ(D280Y) and strains overexpressing murZ or murA are in Fig. S10. (E) Disc diffusion assays were performed as described in Experimental procedures for strains: WT parent (IU1824), ΔmurZ (IU13536), ΔmurA (IU13538), murZ(D280Y) (IU13438), murZ(C116S) (IU15939), murZ(D280Y) ΔmurA (IU17748), ΔkhpA (IU9036), ΔkhpA ΔmurZ (IU13542), ΔkhpA ΔmurA (IU13546), ΔclpP (IU12462), murZ+//PZn-murZ+ (no Zn) (IU13393), and murZ+//PZn-murZ+ in 0.2 mM (Zn2+/(1/10)Mn2+). Mean diameters of zones of inhibition ± SEM are graphed from at least two independent biological replicates. Means and numbers of replicates (n) are shown at the tops and bottoms of bars, respectively. P values were obtained by the Welch t-test (GraphPad Prism). *, **, and *** denote p<0.05, p<0.01, p<0.001, respectively.
Figure 7.
Figure 7.. MurZ(D280Y), MurZ(E259A), and MurZ(I265V) that suppress ΔgpsB or ΔstkP are located on a face of Domain I of MurZ, away from its active site.
The predicted 3D-structure of MurZ(Spn) from D39 strains generated using the AlphaFold v2.0 webserver is shown in cyan, with important residues illustrated as colored sticks. Catalytic site C116, and other residues important for MurA enzymatic activity include N23 (conformation switching), D306 (initial deprotonation of the UDP substrate), and R398 (product release) (Jackson et al., 2009, Samland et al., 2001, Skarzynski et al., 1996). Although N23 and C116 are in Domain II, and D306 and R398 are in Domain I, these four residues are in close proximity on one side of the molecule. In contrast, D280, E259, and I265, for which amino acid substitutions lead to ΔgpsB suppression, are located on the opposite side Domain I compared to C116. E190, E192 and D195 are in Domain II across the cleft from D280 and do not lead to ΔgpsB suppression when substituted. Residues T198 and E262 correspond to residues MurA(Lmo) N197 and MurA(Lmo) S262 respectively. MurA(Lmo) N197D and MurA(Lmo) S262L are suppressor mutations of ΔgpsB and ΔprkA mutations in Listeria monocytogenes (Wamp et al., 2021).
Figure 8.
Figure 8.. MurZ(Spn) and MurA(Spn) cellular amounts are unchanged in ΔclpP, ΔclpC, ΔclpL, or ΔclpE mutants lacking the ClpP protease or its ATPase subunits.
(A) Representative western blot probed with anti-MurA antibody of samples collected after 3.5 h of growth in the BHI broth. Western blotting was performed as described in Experimental procedures using Licor IR Dye800 CW secondary antibody detected with an Azure Biosystem 600. 10 μL (≈4 μg) of protein samples were loaded in each lane. Lane 1, WT (IU1824); lane 2, ΔmurA (IU13538); lane 3, ΔmurZ (IU13536); lane 4, ΔclpP markerless (IU18663); lane 5, ΔclpP::Pc-erm (IU17146); lane 6, ΔclpC::Pc-erm (IU15889). A standard curve was generated by loading 2.5, 5.0, 10, 15, or 20 μL of WT (IU1824) samples (lanes 8–12). Calculated protein amounts (mean ± SEM) relative to WT (IU1824) are based on two independent experiments. Signals obtained with anti-MurA antibody were normalized with total protein stain in each lane using Totalstain Q-NC (Azure Scientific). (B) and (C) Representative western blot using anti-FLAG antibody of samples obtained from WT parent (IU1824), murZ-L-F3 (IU13502), murZ-L-F3 ΔclpE (IU17150), murZ-L-F3 ΔclpL (IU17152), murZ-L-F3 ΔclpP (IU17154), and murZ-L-F3 ΔclpC (IU14082). (B) Western blot of samples obtained from WT parent (IU1824), murA-L-F3 (IU14028), murA-L-F3 ΔclpE (IU17158), murA-L-F3 ΔclpL (IU17160), murA-L-F3 ΔclpP (IU17162), and murA-L-F3 ΔclpC (IU14086). 3 μg of each protein was loaded onto lanes 1–6, and 1, 2, or 4 μg of either murZ-L-F3 (A) or murA-L-F3 (B) lysates were loaded in lanes 8–10 to generate standard curves for quantitation. Plots of μg of lysate obtained from IU13502 or IU14028 loaded vs chemiluminescence signal intensities are shown to the right of the blots. Calculated protein amounts (mean ± SEM) relative to murZ-L-F3 (lane 2) or murA-L-F3 (lane 2) based on two independent experiments are shown.
Figure 9.
Figure 9.. Primary phenotypes of StkP(Spn) depletion are strongly suppressed by murZ(D280Y).
Parent D39 Δcps rpsL1 strain (IU1824), and merodiploid ΔstkP markerless//PZn-stkP+ strains containing murZ-L-FLAG3 (IU19081) or murZ(D280Y)-L-FLAG3 (IU19079) were grown overnight in BHI broth with no additional (Zn2+/(1/10)Mn2+) (IU1824) or with 0.5 mM (Zn2+(1/10)Mn2+) (IU19081 and IU19079) as described in Experimental procedures. Strains were diluted to OD620 ≈0.003 in the morning with fresh BHI broth containing no (Zn2+/(1/10)Mn2+) or 0.5 mM (Zn2+/(1/10)Mn2+). (A) Growth curves, DT, and maximal growth yields (OD620) during 10 h of growth. (B) Representative phase-contrast images taken at ≈3.5 h of growth. Scale bar = 1 μm. Growth curves and microscopy were performed in two independent experiments. (C) Box-and-whisker plots (whiskers, 5 and 95 percentile) of cell lengths, widths, aspect ratios, and relative cell volumes. P values were obtained by one-way ANOVA analysis (GraphPad Prism, Kruskal-Wallis test). *** p<0.001 compared to WT. (D) Representative western blot using anti-FLAG antibody of samples collected after 3.5 h of growth, where − or + indicates the absence of presence of 0.5 mM (Zn2+/(1/10)Mn2+) in the BHI broth. Western blotting was performed as described in Experimental procedures. 6 μL (≈2 μg) of protein samples were loaded in each lane. A standard curve was generated by loading 3, 6, 9 or 12 μL of IU13502 (murZ-L-FLAG3) samples (lanes not shown). Signal intensities obtained with anti-StkP antibody were normalized in each lane by using Totalstain Q-NC reagent (Azure Biosystems). Calculated protein amounts (mean ± SEM) relative to stkP+ murZ-L-F3 (IU13249) are based on two independent experiments.
Figure 10.
Figure 10.. Tn-seq demonstrates the essentiality of StkP(Spn) and GpsB(Spn) is suppressed by ΔkhpB in cells growing exponentially in BHI broth in 5% CO2.
(A) Top: Predicted 3D structure of StkP(Spn) generated using the AlphaFold v2.0 webserver. P1, P2, P3 and P4 with indicated amino acid numbers are predicted extracellular PASTA domains. Bottom: Mini-Mariner Malgellan6 Tn-Seq transposon insertion profile for the genome region covering sun, phpP, stkP, and spd_1541 in the genomes of the unencapsulated WT parent (D39 Δcps rpsL1, IU1824) or ΔkhpB (IU10592) strain growing exponentially in BHI broth in 5% CO2. The same WT Tn-seq insertion profile was obtained for encapsulated D39 strain IU1781 grown in BHI broth or IU1824 grown in C+Y, pH 6.9 medium in 5% CO2 (data not shown). In vitro transposition reactions containing purified genomic DNA, Magellan6 plasmid DNA, and purified MarC9 mariner transposase, transformation, harvesting of transposon-inserted mutants, growth of pooled insertion libraries exponentially in BHI broth or C+Y, pH 6.9 medium, NextSeq 75 high-output sequencing, and analysis were performed as described in Experimental procedures based on (Lamanna et al., 2022). Sortable data for the profile shown are contained in Appendix A, Tabs C and D. Tn-insertions were recovered for the WT strains in the regions encoding P3 and P4, but not in other regions of stkP. The first TA insertion occurs in the WT strain at a TAT (Y515) codon, where the Tn insertion creates a TAA stop codon, while there is no insertion at the upstream TTA (L512) codon, indicating that StkP(M1-L512) is essential for viability. (B) Tn-Seq transposon insertion profiles for the genome region covering recU, spd_0338, gpsB, and rnpB of in the genomes of the WT parent (D39 Δcps rpsL1, IU1824) or ΔkhpB (IU10592) strain. (C) Representative growth curves of the WT parent (IU1824), ΔkhpA (IU9036), ΔkhpA ΔgpsB (IU16196) and ΔkhpA ΔstkP (IU16910) strains. Similar growth results were obtained with ΔkhpB (IU10592), ΔkhpB ΔgpsB (IU12977), and ΔkhpB ΔstkP (IU16912) strains compared to the strains of ΔkhpA background. The growths of merodiploid strains ΔgpsB//PZn-gpsB+ (IU16370) and ΔstkP::Pc-erm//PZn-stkP+ (IU16933) grown under conditions that result in depletion of GpsB or StkP were shown for comparison.
Figure 11.
Figure 11.. KhpA/B negatively and post-transcriptionally regulates MurZ(Spn), but not MurA(Spn), cellular amounts.
(A) Summary of suppression patterns of ΔgpsB, Δpbp2b, ΔrodA, and ΔmreCD by ΔkhpA/B mutation. The absence of KhpA and/or KhpB increases the cellular amount of FtsA, which bypasses the requirement for essential PBP2b, RodA, RodZ, and MreCD (Lamanna et al., 2022, Zheng et al., 2017). The absence of KhpA/B also moderately increases cellular MurZ amount as shown below, which bypasses the requirement for essential GpsB and StkP as described in the text and Fig. 12. (B) Quantitative proteomic results showing relative amounts of FtsA, FtsZ, MurZ, MurA, ClpC, and ClpP in ΔkhpA ΔkhpB (IU10596) or ΔkhpB (IU10592) strains compared to wild-type (IU1824). *** p < 0.001. Proteomics was performed as described in Experimental procedures, and data are contained in Appendix A, Tab E. (C) Representative Western blots using anti-FLAG antibody to determine the cellular amounts of MurZ-L-FLAG3 and MurA-L-FLAG3 in cells growing exponentially in BHI broth. Lane 1, WT parent (IU1824); lane 2, murZ-L-F3 (IU13502); lane 3, murZ-L-F3 ΔkhpA (IU13545); lane 4, murZ-L-F3 ΔkhpB (IU14014); lane 5, murZ-L-F3 ΔkhpA ΔkhpB (IU14016); lane 6, murA-L-F3 (IU14028); lane 7, murA-L-F3 ΔkhpA (IU14030). 0.67 μg of total protein from each strain were loaded in lanes 1–7. For lanes 8 to 11, 0.33, 0.67, 1.33, and 2 μg, respectively, of murZ-L-FLAG3 (IU13502) lysates were loaded to generate the standard curve at right, which showed proportionality between protein amounts and signal intensities over the range of signal intensities obtained. (C) Relative average (± SEM) of cellular amounts of MurZ-L-F3 or murZ transcripts in mutants compared to WT from 3 independent experiments. P values were obtained relative to WT by one-way ANOVA analysis (Dunnett’s multiple comparison test, GraphPad Prism). * P<0.05; ** P<0.01; ns: not significantly different. (E) Relative average (± SEM) cellular amount of MurA-L-F3 protein in a ΔkhpA mutant compared to WT from 3 independent experiments. P value was obtained relative to WT by one sample t-test (GraphPad Prism). * p<0.05.
Figure 12.
Figure 12.. Summary model for regulation of MurZ and MurA enzymatic activities by StkP-mediated phosphorylation in S. pneumoniae D39.
GpsB(Spn) and possibly other ligands, such as Lipid II, stimulate the phosphorylation of a negative regulator of MurZ(Spn) and MurA(Spn) enzymatic activity, but not their cellular amounts, in the first committed step of Lipid II synthesis for PG synthesis. By genetic criteria presented here, the negative regulator is unphosphorylated IreB(Spn). Phosphorylated IreB(Spn)~P does not bind to MurZ(Spn) or MurA(Spn), resulting in full enzymatic activity in pneumococcal cells growing exponentially in rich media. The absence of GpsB(Spn) significantly reduces phosphorylation of IreB(Spn) leading to inhibition of MurZ(Spn) and MurA(Spn) enzymatic activities and no growth. This inhibition can be relieved by inactivation of the cognate PhpP protein phosphatase, which allows residual phosphorylation to IreB(Spn)~P. The absence of the StkP protein kinase and the need for protein phosphorylation in pneumococcal cells growing exponentially in rich media can be suppressed by inactivation or absence of the IreB(Spn) negative regulator, by amino-acid changes in a regulatory domain of MurZ(Spn), which is enzymatically predominant over MurA(Spn), or by overexpression of murZ(Spn) or murA(Spn) in spontaneous chromosomal duplications. Moderate MurZ(Spn) overproduction sufficient to suppress the absence of StkP also occurs in the absence of the KhpAB RNA-binding protein, which also negatively regulates FtsA amount. This pathway provides a positive feedback loop, such that cells growing rapidly in rich media produce Lipid II, which may activate StkP(Spn) to fully phosphorylate IreB(Spn) and maximize MurZ(Spn) and MurA(Spn) enzymatic activities for the production of even more Lipid II for PG synthesis. Evidence for the direct interaction between unphosphorylated IreB(Spn) and MurZ(Spn) will be presented elsewhere (Merrin Joseph, unpublished result). Structures predicted by AlphaFold v2.0 also suggest that MurZ(Spn) and MurA(Spn) enzymatic activity is subject to negative pathway feedback inhibition by binding of UDP-MurNAc (UDP-N-acetylmuramic acid) near the catalytic sites of the enzymes (Mizyed et al., 2005, Schonbrunn et al., 2000). See text for additional details.

Update of

Similar articles

Cited by

References

    1. Aguilan JT, Kulej K, and Sidoli S (2020) Guide for protein fold change and p-value calculation for non-experts in proteomics. Mol Omics 16: 573–582. - PubMed
    1. Alonso CA, Dominguez C, Heras J, Mata E, Pascual V, Torres C, and Zarazaga M (2017) Antibiogramj: A tool for analysing images from disk diffusion tests. Comput Methods Programs Biomed 143: 159–169. - PubMed
    1. Baylay AJ, Ivens A, and Piddock LJ (2015) A novel gene amplification causes upregulation of the PatAB ABC transporter and fluoroquinolone resistance in Streptococcus pneumoniae. Antimicrob Agents Chemother 59: 3098–3108. - PMC - PubMed
    1. Beilharz K, Novakova L, Fadda D, Branny P, Massidda O, and Veening JW (2012) Control of cell division in Streptococcus pneumoniae by the conserved Ser/Thr protein kinase StkP. Proc Natl Acad Sci U S A 109: E905–913. - PMC - PubMed
    1. Blake KL, O’Neill AJ, Mengin-Lecreulx D, Henderson PJ, Bostock JM, Dunsmore CJ, Simmons KJ, Fishwick CW, Leeds JA, and Chopra I (2009) The nature of Staphylococcus aureus MurA and MurZ and approaches for detection of peptidoglycan biosynthesis inhibitors. Mol Microbiol 72: 335–343. - PubMed

Publication types

Substances

LinkOut - more resources