. 2023 Jul 14;14(1):4129.
doi: 10.1038/s41467-023-39672-2.

Lactate-dependent transcriptional regulation controls mammalian eye morphogenesis

Affiliations

Lactate-dependent transcriptional regulation controls mammalian eye morphogenesis

Nozomu Takata et al. Nat Commun. .

Abstract

Mammalian retinal metabolism favors aerobic glycolysis. However, the role of glycolytic metabolism in retinal morphogenesis remains unknown. We report that aerobic glycolysis is necessary for the early stages of retinal development. Taking advantage of an unbiased approach that combines the use of eye organoids and single-cell RNA sequencing, we identify specific glucose transporters and glycolytic genes in retinal progenitors. Next, we determine that the optic vesicle territory of mouse embryos displays elevated levels of glycolytic activity. At the functional level, we show that removal of Glucose transporter 1 and Lactate dehydrogenase A gene activity from developing retinal progenitors arrests eye morphogenesis. Surprisingly, we uncover that lactate-mediated upregulation of key eye-field transcription factors is controlled by the epigenetic modification of histone H3 acetylation through histone deacetylase activity. Our results identify an unexpected bioenergetic independent role of lactate as a signaling molecule necessary for mammalian eye morphogenesis.


Conflict of interest statement

The authors declare no competing interests.

Figures

Fig. 1
Fig. 1. Single cell transcriptomics of mouse eye organoids during optic vesicle evagination.
AF Immunostaining of sections of optic vesicles from mouse embryos and eye organoids was performed using Laminin, Rax and GFP antibodies. DAPI and Phalloidin were used to label nuclei and F-actin, respectively. Insets show the merged images with bright fields and GFP channels at each embryonic and organoid stage. Black arrows in insets indicate evaginating OVs. Representative micrographs are shown as similar results were obtained from three independent experiments. G Schematic diagram showing the processes of OV evagination in eye organoids divided into four main phases. During phase 1 (day 3.5), forebrain identity is acquired; in phase 2 (day 4), weak and scattered Rax expression starts to be detected (eye field stage); in phase 3 (day 6), OV budding starts and Rax expression is increased; in phase 4 (day 7), through a ballooning process OVs fully evaginate and enlarge, and Rax expression its higher in the future neural retina territory (NR). Regions with lower levels of Rax expression will become the retina pigment epithelium (RPE). H Following single-cell RNA sequencing (scRNAseq) of the eye organoids, t-SNE plot analysis of phase 2 and phase 3 shows the obvious transcriptomic differences between these 2 stages. I t-SNE plot analysis shows each transcriptionally distinguishable cluster by unique colors. The bioinformatic analysis partitioned the cells of those two phases into 10 groups (clusters 0–9 are visualized using t-SNE). Each cell type is annotated based on a combination of known cell fate markers. Scale bars, 100 µm (AF).
Fig. 2
Fig. 2. Glycolysis regulates optic vesicle morphogenesis in eye organoids.
A Violin plots identify higher expression of the early eye differentiation markers Six3, Rax, Pax6 and Lhx2 on cluster 1. They also express Slc2a1 (Glut1), Slc2a3 (Glut3) and Ldha. Lhx5 is a forebrain marker. BH Pharmacological inhibition of glucose catabolism and LDH activity by 2-Deoxy-d-Glucose, 2-DG (2 mM) and GNE-140 (20 µM) respectively, shows that formation of RaxGFP+-expressing OVs (arrowheads) is arrested and the expression levels of eye markers such as Rax and Six3 is severely reduced (E, F, H). Insets indicate Rax-GFP expression (DH). Representative micrographs are shown as similar results were obtained from three independent experiments (CH). I Quantitative PCR analysis of a set of key eye field transcription factors known to be necessary during the process of eye morphogenesis. Scale bars, 100 µm (CH). Unpaired Student’s t test (two-tailed) was performed (I). * or *** indicates a p-value is less than 0.05, or 0.001, respectively (I). Data are presented as mean values +/−SEM (I). Source data are provided as a Source Data file. n = 3 biologically independent experiments were performed.
Fig. 3
Fig. 3. Active glucose uptake takes place in the eye field territory of mouse embryos.
AC A strong glucose uptake signal was initially detected mostly in the presumptive OVs at E8.0 (arrowheads), and in the midbrain and tail bud region at the 5-6 somite stage (E8.5). Representative micrographs are shown as similar results were obtained from three independent experiments. DI Glucose tracer uptake was impaired in the presumptive OV territory of Glut1, Rax and Six3 mutant embryos compared with that in their heterozygous littermates. J Quantification of 2-NBDG fluorescence intensity in those embryos. 2-NBDG intensity in the anterior neural plate (ANP) was measured relative to the heart primordium. KP Bright field images and immunostaining showing that OV morphogenesis in Glut1 and Ldha conditional null embryos was impaired. Rax expression was reduced, while expression of the forebrain marker Lhx5 was not dramatically affected in those mutant embryos. The Delta allele was generated by germline deletion using Ella-Cre mice. Only one flox allele remains upon conditional Cre expression. Q Quantification of Rax expression relative to DAPI signals. R Schematic representation of the glycolysis process during eye morphogenesis. Scale bars, 100 µm (AI, KP). Unpaired Student’s t test (two-tailed) was performed (J, Q). ** or *** indicates a p-value is less than 0.01 or 0.001, respectively (J, Q). Data are presented as mean values +/−SEM (J, Q). Source data are provided as a Source Data file. n = 3 biologically independent experiments were performed.
Fig. 4
Fig. 4. 13C-isotope labeling reveals the profile of glycolytic intermediates during eye morphogenesis.
A, B The direct quantification of glucose consumption using 13C glucose time-course tracing was performed in cultured eye organoids and measured by LC-MS/MS analysis. Amongst all detected glycolytic intermediates, the main 13C glucose-derivatives were pyruvate and lactate, while the levels of citrate, one of the signature metabolites of the TCA cycle were extremely low. The M + 0, M + 1, M + 2 and M + 3 metabolites were measured as % of the total pool to distinguish unlabeled and labeled metabolites. The labeled lactate during glycolysis saturated up to 80%. In the TCA cycle, citrate shows that only about 20% of the succinate pool was 13C labeled. CF To evaluate glycolysis and mitochondrial respiration, seahorse analysis was performed to measure eye organoids-derived extracellular acidification rate (ECAR) and oxygen consumption rate (OCR). Injecting glucose (Glu) elevated ECAR whereas lactate (Lac) did not. Oligomycin (Oligo), an inhibitor of ATP synthase necessary for oxidative phosphorylation further increased ECAR levels. Subsequent addition of either 2-DG or GNE-140 depleted the ECAR to the basal level. G, H 13C-glucose labeling under three conditions: 13C-glucose = control (white scheme), 13C-glucose + LDHi = LHDi (red scheme), 13C-lactate in glucose free media mimicking the lack of glucose uptake = lactate (green scheme). Treatment with LDHi (which prevents OV morphogenesis) significantly reduced 13C-labeled lactate; however, it did not change the levels of pyruvate, citrate and alanine. 13C-lactate was not dramatically metabolized into TCA cycle specific metabolites as seen in M + 2 citrate. One-way ANOVA followed by Tukey’s post-hoc test was performed (H). ****p < 0.0001, ***p < 0.001, *p < 0.05, n.s. not significant (H). Data are presented as mean values +/−SEM (H). Source data are provided as a Source Data file. n = 3 biologically independent experiments were performed.
Fig. 5
Fig. 5. Lactate is required for eye morphogenesis by regulating eye transcriptional programs.
A, B The addition of sodium L-lactate, which does not change the pH, significantly rescued the OV phenotype (arrowheads) in the presence of 20 µM GNE-140 (LDHi). C Quantification analysis using RT-qPCR confirmed that Rax and Six3 expression were also rescued by the addition of sodium L-lactate (25 mM). D Generation and genotyping of Ldhadelta/flox;Rax-Cre conditional mouse embryos (CKO) and derivation of ESCs. The delta allele was generated by germline deletion using Ella-Cre mice. Only one flox allele remains upon conditional Cre expression. Representative micrographs are shown as similar results were obtained from three independent experiments. E Genetic deletion of LDHA in the eye field-specific region leads to defects in optic vesicle formation in Ldha mutant organoids. The addition of lactate rescued the eye defects as indicated by the formation of OVs (arrowheads). FI Immunostaining and RT-qPCR analyses showed that Ldha-depleted organoids recovered Rax and Six3 expression in the presence of 25 mM lactate (arrowheads); however, Ldha expression in the mutant OVs is not detected (F). J RNA-sequencing was performed to compare LDH block (LDHi) vs LDHi plus sodium L-lactate. Addition of lactate resulted in significant transcriptional changes as indicated by heatmap analysis that identified changes in the expression of various genes known to regulate eye formation (arrows). Scale bars, 100 µm (B, EH). One-way ANOVA followed by Tukey’s post-hoc test was performed (C, I). ****p < 0.0001, ***p < 0.001, **p < 0.01, n.s. not significant (C, I). Data are presented as mean values +/−SEM (C, I). Source data are provided as a Source Data file. n = 3 biologically independent experiments were performed.
Fig. 6
Fig. 6. HDAC and CBP/p300 activity specifically regulate eye developmental genes.
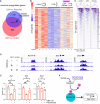
A Venn diagram reveals genes whose expression is dependent on lactate. B Heatmap of 414 lactate dependent differentially expressed genes. C Global histone H3K27 acetylation (H3K27ac) chromatin immunoprecipitation sequencing (ChIPseq) was performed in the following two conditions: 1) addition of the LDH inhibitor (20 µM), 2) addition of the LDH inhibitor in the presence of lactate (25 mM). The ChIP occupancy heatmaps showing H3K27ac plots at transcription start sites (TSS) (Enhancers/Promoters, +/−2 kb) of the differentially expressed genes identified from the RNA-seq analysis. D Bioinformatic analysis was performed and the ChIPseq data was visualized using the free software IGV (version 2.4.14) around coding and regulatory regions such as putative promoters and/or enhancers of some typical eye gene loci (Rax, Six3). Relatively higher peaks are seen in comparison with those upon adding the LDH inhibitor. This peak reduction when adding LDHi was recovered upon lactate treatment. E The pan-HDAC inhibitor Panobinostat was added to the organoids in the presence of LDHi from day 4 to day 5. Dual inhibition by LDHi and HDACi rescued eye marker genes at day 5, whereas pan-neural gene, Sox2 did not change dramatically as seen by qPCR. F Potential mechanisms regulating the eye developmental program through H3K27ac involving histone acetyltransferases and deacetylases. Panobinostat, a potent inhibitor depletes histone deacetylases (HDACs) mediated H3K27-deacetylation process. One-way ANOVA followed by Tukey’s post-hoc test was performed (E). **p < 0.01, *p < 0.05, n.s. nonsignificant (E). Data are presented as mean values +/−SEM (E). Source data are provided as a Source Data file. n = 3 biologically independent experiments were performed.
Fig. 7
Fig. 7. Bioenergetics-independent role of lactate during eye morphogenesis.
Glycolysis-derived lactate possesses non-metabolic functions that contribute to transcriptional regulation through epigenetic pathways involving histone H3 acetylation writer and eraser. Higher glucose uptake begins in the anterior neural plate (ANP) prior to optic vesicle (OV) morphogenesis. While the activity of Glut1 and Ldha is required for canonical glycolysis, the final product of glycolysis, lactate, acts as a signaling molecule being likely an endogenous HDAC inhibitor during eye morphogenesis. This non-canonical regulation is ATP-production independent and pivotal for specific eye developmental programs. cyto cytoplasm, nuc nucleus, enh enhancers, prom promoters.

Similar articles

Cited by

References

    1. Warburg O. On respiratory impairment in cancer cells. Science. 1956;124:269–270. doi: 10.1126/science.124.3215.269. - DOI - PubMed
    1. Warburg O. On the origin of cancer cells. Science. 1956;123:309–314. doi: 10.1126/science.123.3191.309. - DOI - PubMed
    1. Warburg O, Wind F, Negelein E. The metabolism of tumors in the body. J. Gen. Physiol. 1927;8:519–530. doi: 10.1085/jgp.8.6.519. - DOI - PMC - PubMed
    1. Vander Heiden MG, Cantley LC, Thompson CB. Understanding the Warburg effect: the metabolic requirements of cell proliferation. Science. 2009;324:1029–1033. doi: 10.1126/science.1160809. - DOI - PMC - PubMed
    1. Hurley JB, Lindsay KJ, Du J. Glucose, lactate, and shuttling of metabolites in vertebrate retinas. J. Neurosci. Res. 2015;93:1079–1092. doi: 10.1002/jnr.23583. - DOI - PMC - PubMed

Publication types