. 2023 Jul 14;14(1):4221.
doi: 10.1038/s41467-023-40022-5.

Oxidative phosphorylation is a metabolic vulnerability of endocrine therapy and palbociclib resistant metastatic breast cancers

Affiliations

Oxidative phosphorylation is a metabolic vulnerability of endocrine therapy and palbociclib resistant metastatic breast cancers

Rania El-Botty et al. Nat Commun. .

Abstract

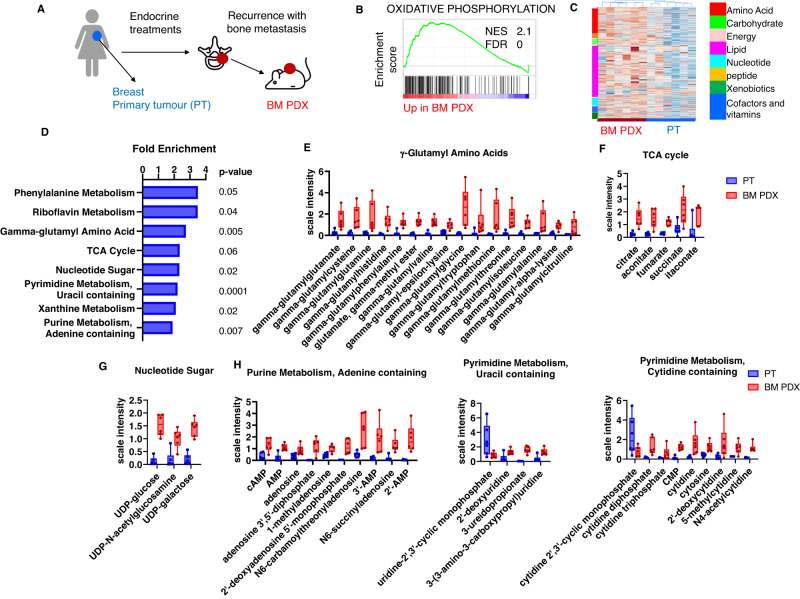
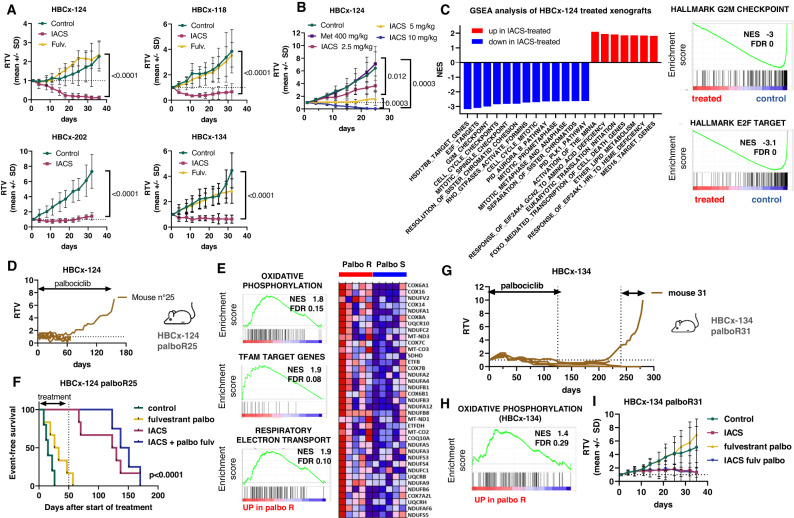
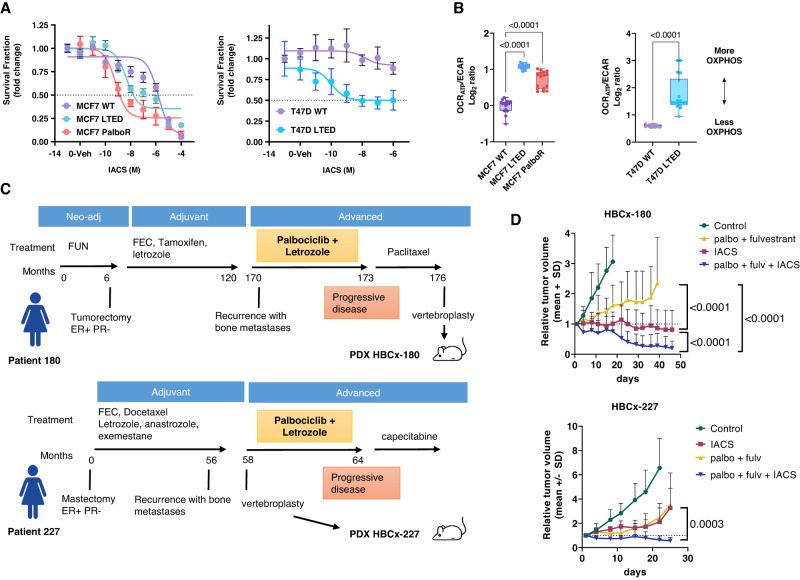
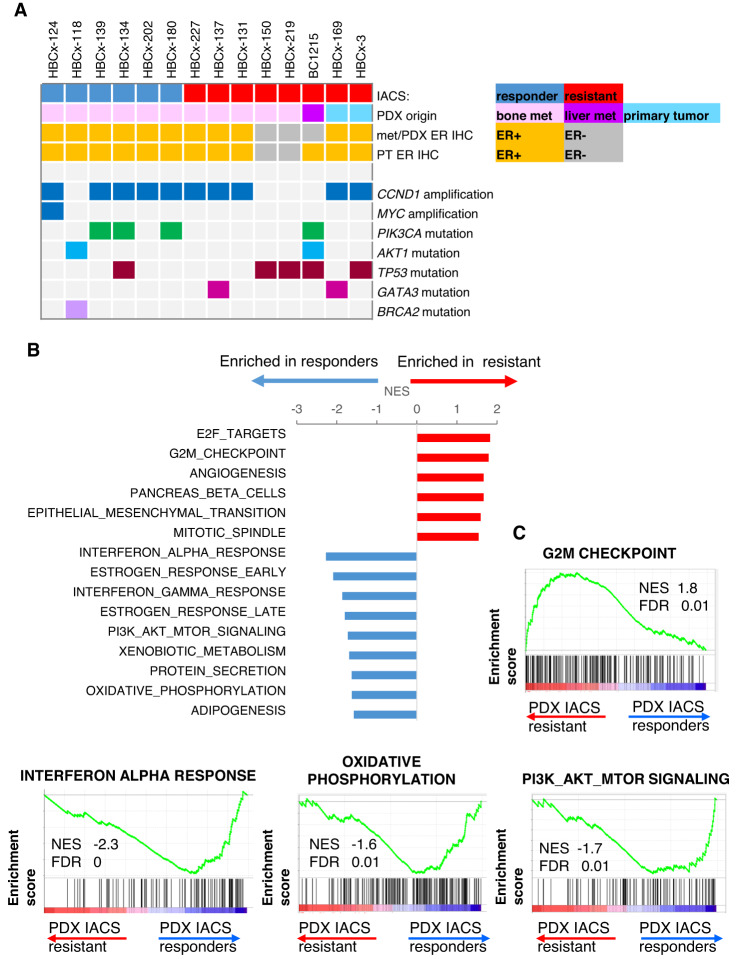
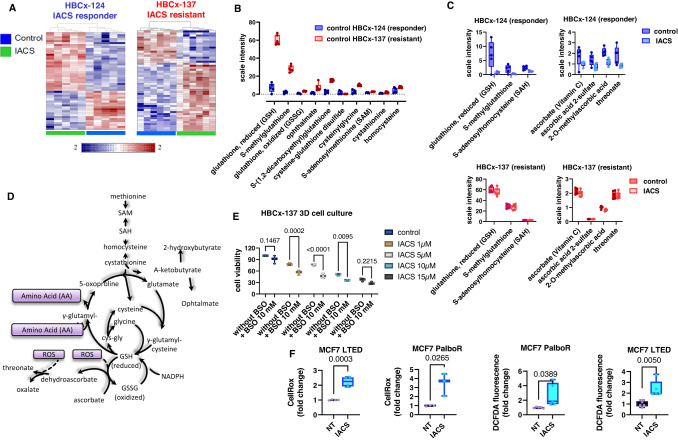
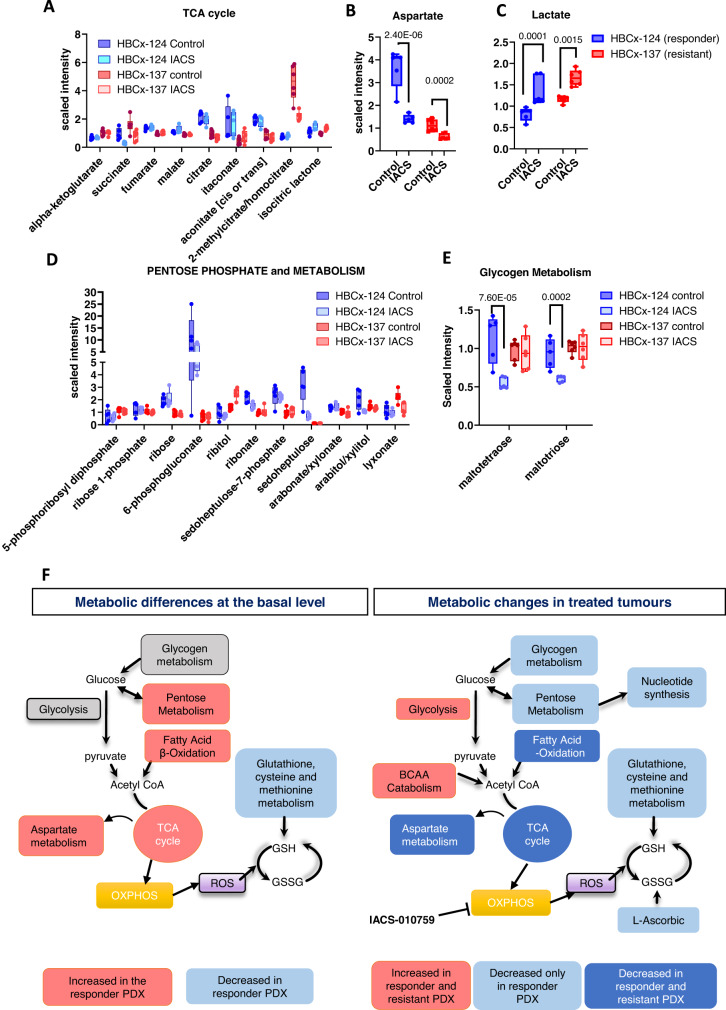
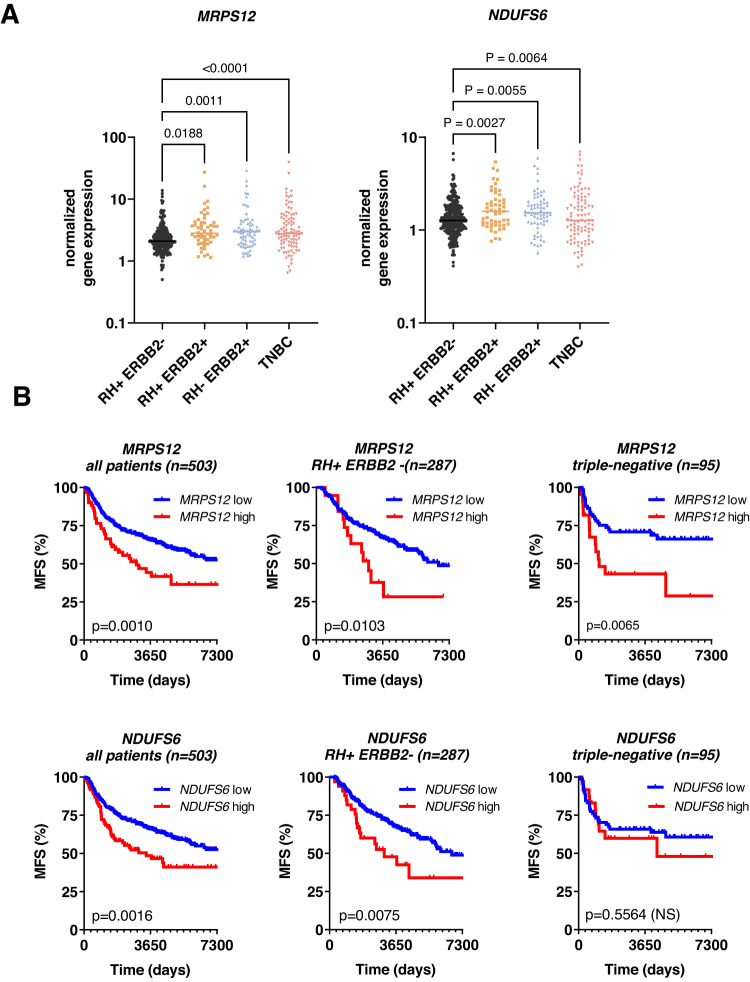
Resistance to endocrine treatments and CDK4/6 inhibitors is considered a near-inevitability in most patients with estrogen receptor positive breast cancers (ER + BC). By genomic and metabolomics analyses of patients' tumours, metastasis-derived patient-derived xenografts (PDX) and isogenic cell lines we demonstrate that a fraction of metastatic ER + BC is highly reliant on oxidative phosphorylation (OXPHOS). Treatment by the OXPHOS inhibitor IACS-010759 strongly inhibits tumour growth in multiple endocrine and palbociclib resistant PDX. Mutations in the PIK3CA/AKT1 genes are significantly associated with response to IACS-010759. At the metabolic level, in vivo response to IACS-010759 is associated with decreased levels of metabolites of the glutathione, glycogen and pentose phosphate pathways in treated tumours. In vitro, endocrine and palbociclib resistant cells show increased OXPHOS dependency and increased ROS levels upon IACS-010759 treatment. Finally, in ER + BC patients, high expression of OXPHOS associated genes predict poor prognosis. In conclusion, these results identify OXPHOS as a promising target for treatment resistant ER + BC patients.


Conflict of interest statement

The authors declare no competing interests.

Figures

Fig. 1
Fig. 1. Transcriptomic and metabolomics reprogramming in bone metastases-derived PDX as compared to patients’ breast primary tumours.
A Biopsies of bone metastases (BM) from patients progressing after adjuvant treatments were engrafted in Swiss nude mice to generate PDX models. B Enrichment plot of oxidative phosphorylation hallmark identified in the Gene Set Enrichment Analysis (GSEA) of BM PDX (n = 7 PDX) as compared to patients’ breast primary tumours (PT) (n = 4 patients), including four pairs of matched patients/PDX samples. NES: normalised enrichment score. FDR false discovery rate. C Hierarchical clustering analysis of metabolic profiles of primary breast tumours (n = 6 patients) and BM PDX samples (n = 6 PDX), including four matched patients/PDX samples. D Metabolite pathway enrichment analysis (MPEA) of differentially regulated metabolites between BM PDX and patients’ PT. P value were calculated with a right-tailed Fisher’s exact test. No correction for multiple testing. E Min/Max Whiskers plots showing levels of metabolites of γ-glutamyl amino acids in BM PDX (PDX) and patients’ primary tumours (PT), F Min/Max Whiskers plots showing levels of metabolites of TCA cycle in BM PDX and PT), G Min/Max Whiskers plots showing levels of metabolites of nucleotide sugar in BM PDX and PT), H Min/Max Whiskers plots showing levels of metabolites of purine and pyrimidine metabolism in BM PDX and PT. In all Min/Max Whiskers plots, n = 6 (PT and BM PDX). PT patients’ primary tumours, BM PDX bone metastases-derived PDX. Source data are provided as a Source Data file. n number of different patients’ tumours or PDX models.
Fig. 2
Fig. 2. Energy metabolism in BM PDX and OXPHOS targeting.
A In vivo response to IACS-010759 treatment in PDX of ER + BM. Mean ± SD. HBCx-124: n = 3 mice (control) and 4 mice (IACS and fulvestrant). HBCx-118: n = 4 mice/group. HBCx-202: n = 6 mice/group. HBCx-134 n = 5 mice (control and IACS) and n = 8 mice (fulvestrant). P values were calculated with the Mann–Whitney test (two-tailed). B Response of HBCx-124 to different doses of IACS-010759 and to metformin (n = 7 mice/group) P values were calculated with the Mann–Whitney test (two-tailed). C GSEA analysis of HBCx-124 xenografts after 1 week of IACS treatment. D Establishment of the palbociclib-resistant HBCx-124 palboR25 PDX model. E Enrichment plots of oxidative phosphorylation, TFAM target genes and respiratory electron transport hallmarks from the GSEA enrichment analysis of HBCx-124 palboR25 PDX as compared to the parental palbo responder (palbo S) HBCx-124. NES normalised enrichment score. FDR false discovery rate. Oxidative phosphorylation heatmap. F Kaplan–Meier survival analysis of HBCx-124 palboR25 PDX treated by fulvestrant and palbociclib, IACS-010759 and the combination of palbociclib + fulvestrant and IACS-010759 n = 6 mice (control), n = 7 mice (fulv palbo and IACS, n = 5 mice (IACS + palbo fulv). Log-rank (Mantel–Cox) test. G Establishment of the palbociclib-resistant HBCx-134 palboR31 PDX model. H Enrichment plots of oxidative phosphorylation, NES normalised enrichment score, FDR false discovery rate. Oxidative phosphorylation heatmap. I Response to IACS, fulvestrant and palbo and IACS + fulvestrant and palbo in the HBCx-134 palbo31 PDX. n = 4 mice (control), n = 5 mice (IACS, palbo fulv), n = 6 mice (IACS + palbo fulv). Mean ± SD. RTV relative tumour volume. Source data are provided as a Source Data file. n number of mice.
Fig. 3
Fig. 3. OXPHOS targeting in cell lines and PDX models of palbociclib-resistant patients.
A Effect of IACS-010759 on in vitro models of ER+ breast cancer sensitive and resistant cells. Relative viability of MCF7 WT/LTED/ PalboR and of T47D WT/LTED derivatives cells treated for 72 h with IACS (10−11 to 10−4 M). Data represent mean survival fraction ±SEM relative to untreated cells (n = 3 independent experiments). Statistical analysis of MCF7 WT/LTED/PalboR was performed with the Two-way ANOVA test (Bonferroni corrected). Statistical analysis of T47D WT/LTED was performed with the unpaired multiple t-test. B Sensitive and resistant cells were subjected to Seahorse XFe96 Mito Stress Test and the ATP-dependent oxygen consumption rate (OCRATP)/extracellular acidification rate (ECAR) ratio was measured in real-time as an index of OXPHOS dependency. OCR and ECAR readings were determined for ten technical replicates from at least three biological replicates. Box and whisker plots with Min and Max values are represented. One-way ANOVA; Dunnett’s corrected. C Clinical history of patients corresponding to PDX HBCx-180 and HBCx-227. D In vivo response to fulvestrant and palbociclib, IACS-010759 and the combination of palbociclib + fulvestrant and IACS-010759 in HBCx-180 and HBCx-227 (mean ± SD). HBCx-180: n = 8 mice (control, IACS, palbo fulv + IACS) and n = 7 mice (palbo fulv). HBCx-227, n = 9 mice (control), n = 7 mice (IACS), n = 8 mice (palbo fulv), n = 5 mice (palbo fulv. + IACS). Mann–Whitney test, Two-tailed. RTV relative tumour volume. Source data are provided as a Source Data file. n number of mice.
Fig. 4
Fig. 4. Genomic analyses of PDX models.
A Oncoplot showing IACS response, the origin of PDX (bone metastasis, liver metastasis or breast primary tumour), the ER IHC status and the genomic alterations present in each PDX. B Top enriched hallmarks identified in the GSEA analysis of IACS responder and IACS resistant untreated ER + PDX models. Normalised enrichment scores (NES). C Enrichment plots of G2M checkpoint, interferon alpha response, OXPHOS and PI3K/AKT/mTOR hallmarks significantly associated with IACS response or resistance. NES normalised enrichment score, FDR false discovery rate adjusted p value.
Fig. 5
Fig. 5. Pharmacodynamic metabolomic analysis of HBCx-124 (IACS-responder) and HBCx-137 (IACS-resistant) PDX.
A Clustering results shown as heatmaps of the top differentially expressed metabolites in control and IACS-treated xenografts of HBCx-124 (n = 5 mice/group) and HBCx-137 PDX (n = 6 mice/group). Distance measure using Euclidean, and clustering algorithm using ward. B Levels of different metabolites of glutathione metabolism in control xenografts of HBCx-124 (n = 5 mice/group) and HBCx-137 PDX (n = 6 mice/group). Min/Max whisker plots with individual values. P and q values are shown in supplementary data 2. C Levels of different metabolites of glutathione and ascorbate metabolism in control and treated xenografts of HBCx-124 (n = 5 mice/group) and HBCx-137 PDX (n = 6 mice/group). Min/Max whisker plots with individual values. P and q values are shown in Supplementary Data 2. n number of mice. D Methionine, cysteine, glutathione and ascorbate metabolism. E Cell viability of HBCx-137 derived 3D cell culture exposed to different concentrations of IACS with and without BSO (10 mM). (n = 3 technical replicates). Two-way ANOVA test, Šídák’s multiple comparisons test. F MCF7-LTED and PalboR cells were treated with 1 μM IACS for 72 h and ROS levels were measured using CellROX and DCFDA staining. CellROX: n = 4 (MCF7 LTED), n = 3 (MCF7 palboR), DCFDA: n = 5 (MCF7 LTED and palboR). Unpaired Student t-tests (two-tailed). n number of technical replicates. Source data are provided as a Source Data file.
Fig. 6
Fig. 6. Effect of OXPHOS inhibition on energy metabolism.
A Min/Max whisker plots showing the levels of TCA cycle metabolites in HBCx-124 (n = 5 mice/group) and HBCx-137 PDX (n = 6 mice/group) control and IACS-treated xenografts. (Mean ± SD). P and q values are shown in Supplementary Data 2. Level of aspartate (B) and lactate (C) in HBCx-124 (n = 5 mice/group) and HBCx-137 PDX (n = 6 mice/group) control and IACS-treated xenografts. (Mean ± SD). Min/Max whisker plots. (Two-way ANOVA, FDR corrected). D Metabolites levels of the pentose phosphate pathway metabolism (P and q values are shown in Supplementary Data 2.) in HBCx-124 (n = 5 mice/group) and HBCx-137 PDX (n = 6 mice/group) control and IACS-treated xenografts. (Mean ± SD). Min/Max whisker plots. E Glycogen metabolism in HBCx-124 (n = 5 mice/group) and HBCx-137 PDX (n = 6 mice/group) control and IACS-treated xenografts. (Mean ± SD). Min/Max whisker plots. (Two-way ANOVA, FDR corrected). F Overview of metabolic differences between HBCx-124 and HBCx-137 PDX and of metabolic changes in IACS-treated tumours. Source data are provided as a Source Data file. n number of mice.
Fig. 7
Fig. 7. RT-PCR analysis of OXPHOS-related genes in a cohort of 503 breast tumours.
A Scatter plot showing NDUFS6 and MRPS12 expression in different sub-groups of breast cancer: RH + ERBB2- (n = 287 patients), RH + ERBB2+ (n = 54 patients), RH- ERBB2+ (n = 67 patients) and TNBC (n = 95 patients). Scatter dot plots, median and individual values are shown. P values: one-way Anova, Turkey corrected. RH hormone receptor, ERBB2 Receptor tyrosine-protein kinase erbB-2, TNBC triple-negative breast cancer. Source data are provided as a Source Data file. B Metastasis-free survival (MFS) of breast cancer patients according to MRPS12 and NDUFS6 low and high expression (optimal cut-off). P values were calculated with the log-rank (Mantel–Cox) test. n number of patients.

Comment in

References

    1. Dodson A, et al. Breast cancer biomarkers in clinical testing: analysis of a UK national external quality assessment scheme for immunocytochemistry and in situ hybridisation database containing results from 199 300 patients. J. Pathol. Clin. Res. 2018;4:262–273. doi: 10.1002/cjp2.112. - DOI - PMC - PubMed
    1. Early Breast Cancer Trialists’ Collaborative G. Effects of chemotherapy and hormonal therapy for early breast cancer on recurrence and 15-year survival: an overview of the randomised trials. Lancet365, 1687–1717 (2005). - PubMed
    1. Turner NC, Neven P, Loibl S, Andre F. Advances in the treatment of advanced oestrogen-receptor-positive breast cancer. Lancet. 2017;389:2403–2414. doi: 10.1016/S0140-6736(16)32419-9. - DOI - PubMed
    1. Pandey, K. et al. Molecular mechanisms of resistance to CDK4/6 inhibitors in breast cancer: a review. Int. J. Cancer145, 1179–1188 (2018). - PMC - PubMed
    1. Turner NC, et al. Overall survival with palbociclib and fulvestrant in advanced breast cancer. N. Engl. J. Med. 2018;379:1926–1936. doi: 10.1056/NEJMoa1810527. - DOI - PubMed

Publication types