. 2023 Jul 14;14(1):4214.
doi: 10.1038/s41467-023-39919-y.

Increased body mass index is linked to systemic inflammation through altered chromatin co-accessibility in human preadipocytes

Affiliations

Increased body mass index is linked to systemic inflammation through altered chromatin co-accessibility in human preadipocytes

Kristina M Garske et al. Nat Commun. .

Abstract

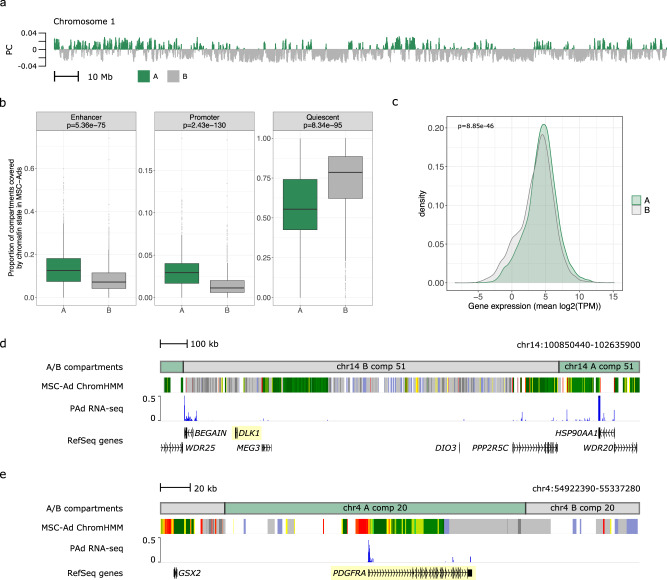
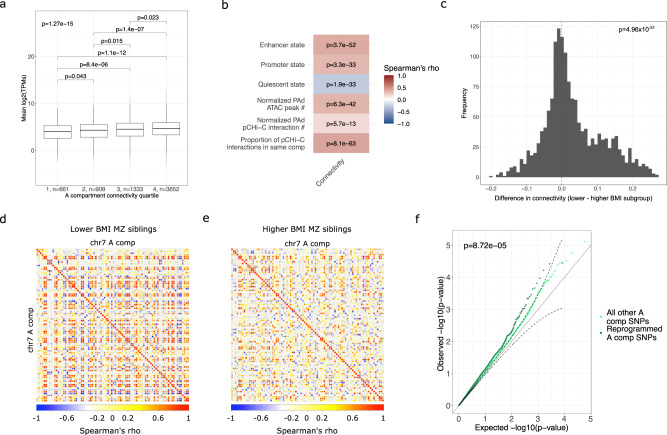
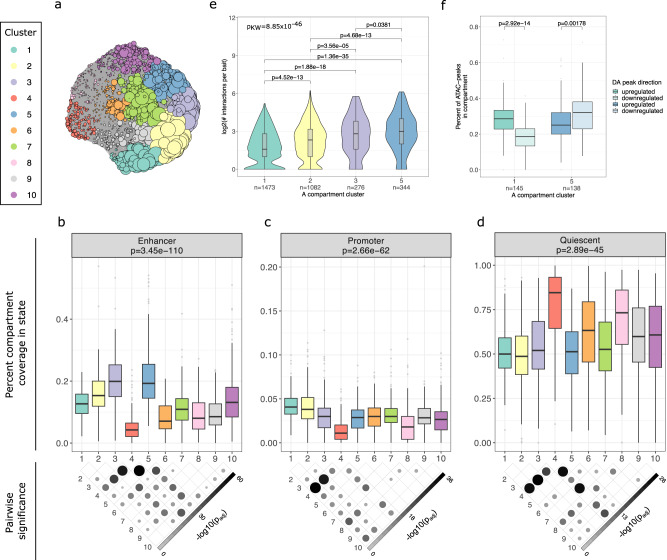
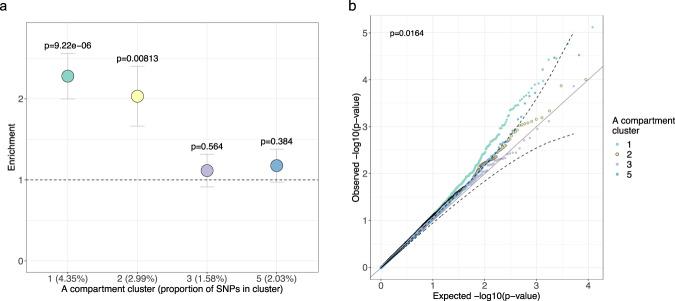
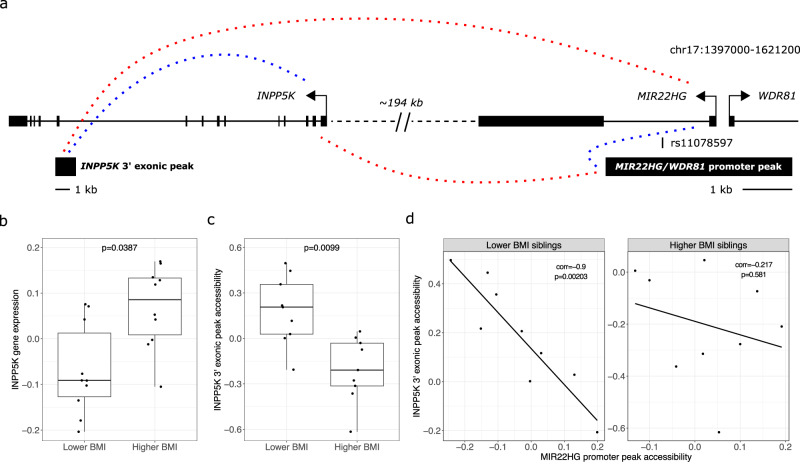
Obesity-induced adipose tissue dysfunction can cause low-grade inflammation and downstream obesity comorbidities. Although preadipocytes may contribute to this pro-inflammatory environment, the underlying mechanisms are unclear. We used human primary preadipocytes from body mass index (BMI) -discordant monozygotic (MZ) twin pairs to generate epigenetic (ATAC-sequence) and transcriptomic (RNA-sequence) data for testing whether increased BMI alters the subnuclear compartmentalization of open chromatin in the twins' preadipocytes, causing downstream inflammation. Here we show that the co-accessibility of open chromatin, i.e. compartmentalization of chromatin activity, is altered in the higher vs lower BMI MZ siblings for a large subset ( ~ 88.5 Mb) of the active subnuclear compartments. Using the UK Biobank we show that variants within these regions contribute to systemic inflammation through interactions with BMI on C-reactive protein. In summary, open chromatin co-accessibility in human preadipocytes is disrupted among the higher BMI siblings, suggesting a mechanism how obesity may lead to inflammation via gene-environment interactions.


Conflict of interest statement

The authors declare no competing interests.

Figures

Fig. 1
Fig. 1. A/B compartment identification using ATAC-seq co-accessibility in human primary preadipocytes.
a PAd A/B compartments on chromosome 1. Each bar represents a 100-kb bin and the height of the bar is the projection onto the first eigenvector of the 100-kb bin co-accessibility matrix across chromosome 1. The sign switches at A/B compartment boundaries; positive values correspond to A compartments (green) and negative values correspond to B compartments (gray). b Coverage of enhancer, promoter, and quiescent ChromHMM chromatin states in the A (n = 1551 compartments) and B (n = 1557 compartments) compartments. P values correspond to the two-sided Wilcoxon rank-sum test comparing the A compartment to B compartment coverage for each chromatin state. Boxplot center represents the median coverage of the indicated chromatin state in the compartment type, the upper and lower bounds of the box represent the 75th and 25th percentile, respectively, and the upper and lower whiskers represent the highest (non-outlier) and lowest (non-outlier) values, respectively. c Density distribution of the gene expression (mean log2(TPM)) in the A (green) and B (gray) compartments shows higher expression in the A compartments. P value corresponds to the two-sided Wilcoxon rank-sum test comparing the gene expression in the A (n = 6554 expressed genes) compartments to the gene expression in the B (n = 5708 expressed genes) compartments. Genome browser snapshots of two preadipocyte marker genes: d DLK1, an early preadipocyte marker, is located within a B compartment on chromosome 4 and is not expressed; and e PDGFRA, a late preadipocyte marker, is located within an A compartment on chromosome 14 and is expressed. The ChromHMM state track is directly from Roadmap Epigenomics on the WashU Epigenome Browser. PC indicates principal components; MSC-Ad mesenchymal stem cell-derived adipocyte cultured cells, and PAd preadipocyte. Source data are provided as a Source Data file.
Fig. 2
Fig. 2. The A compartment co-accessibility differs between the lower and higher BMI twins and contributes to genotype-by-BMI interactions affecting CRP in the UK Biobank.
a Boxplots show the mean expression of genes in the A compartments, stratified into quartiles of the A compartment connectivity. The number of expressed genes in each quartile is noted. The overall p value refers to the Kruskal–Wallis two-sided test for expression differences across the A compartment connectivity quartiles. Pairwise comparisons are from the post hoc Dunn test after correction for multiple testing using the Holm procedure. Boxplot center represents the median expression of the indicated gene set in the indicated compartment type, the upper and lower bounds of the box represent the 75th and 25th percentile, respectively, and the upper and lower whiskers represent the highest (non-outlier) and lowest (non-outlier) values, respectively. b Heatmap shows the correlation of the A compartment connectivity with ChromHMM chromatin states and this study’s PAd ATAC-seq and pCHi-C data. P values correspond to the significance of Spearman’s rank correlation FDR. c Histogram of the differences in the A compartment connectivity between the lower and higher BMI MZ twins. The red dashed line at x = 0 denotes the null hypothesis that there are not genome-wide co-accessibility differences between the twins. The p value corresponds to the one-sample, two-sided Wilcoxon test for the co-accessibility differences. The lower BMI twins exhibit higher A compartment connectivity compared to the higher BMI twin siblings. Correlation plots show that the co-accessibility of the A compartments on chromosome 7 is stronger in d the lower BMI MZ siblings relative to e the higher BMI MZ siblings. This is a representative image from all 22 autosomal chromosomes. f Q-Q plots for the uniform distribution of the p values for genotype-by-BMI interaction effects on CRP in the UKB, stratified by whether SNPs land in the A compartments with altered co-accessibility or not. Confidence intervals (dashed lines) were calculated for the altered A compartment p values. The p value corresponds to the two-sided Wilcoxon rank-sum test for differences in the p value distribution between the altered and unaltered A compartments. Source data are provided as a Source Data file.
Fig. 3
Fig. 3. The A compartment clustering reveals differential accumulation of chromatin states and gene regulatory landscapes.
a iGraph layout of the A compartment clusters after UMAP dimensionality reduction and Louvain clustering. Each circle represents an A compartment. Colors represent the ten clusters that were identified. The size of the circles is proportional to the level of co-accessibility of that A compartment, showing that clusters 1, 2, 3, and 5 have the highest levels of co-accessibility. The A compartment cluster coverage of enhancer (b), promoter (c), and quiescent (d) ChromHMM chromatin states are indicated with boxplots. Overall p values (top) correspond to the two-sided Kruskal–Wallis test comparing the coverage across the A compartment clusters. The p value map below the plot denotes which pairwise differences are significant (p < 0.05) in the post hoc Dunn test, after correcting for multiple testing using the Holm procedure. The number of compartments in each cluster is listed in Supplementary Table 4. e Violin plots with inlaid boxplots show the number of pCHi-C interactions per promoter in the four A compartment clusters. The overall p value corresponds to the two-sided Kruskal–Wallis test and the pairwise comparisons denote the p values from the post hoc Dunn test, after correcting for multiple testing using the Holm procedure. The violin plot shows the kernel probability density of the data. f Boxplots show the proportion of ATAC peaks in the cluster A compartments that are upregulated (higher accessibility in D1 relative to PAd) or downregulated (lower accessibility in D1 relative to PAd) after 24 h of PAd differentiation into adipocytes. The p values correspond to the two-sided paired Wilcoxon rank-sum test for differences between the proportion of up- or down-regulated peaks in each of the compartment clusters separately. See also Supplementary Figs. 7, 8, Supplementary Data 5, 6, and Supplementary Table 4. For all boxplots, the center represents the median gene density of the compartment type, the upper and lower bounds of the box represent the 75th and 25th percentile, respectively, and the upper and lower whiskers represent the highest (non-outlier) and lowest (non-outlier) values, respectively. Source data are provided as a Source Data file.
Fig. 4
Fig. 4. The A compartment cluster 1 contributes significantly to the heritability of CRP and is enriched for genotype-by-BMI interaction effects on CRP in the UK Biobank.
a Dotplot shows the enrichment of heritability for CRP in the different A compartment clusters relative to the null hypothesis of the uniform contribution from all SNPs. Partitioned LD-score regression (LDSC), was performed using the C-reactive protein (CRP) summary statistics from the UK Biobank round 2 GWAS results from 343,524 individuals, hosted at the Neale Lab website (http://www.nealelab.is/uk-biobank/). Error bars represent the heritability enrichment standard error (SE) and the data were presented as the enrichment of heritability for CRP calculated from LDSC ± the enrichment SE. The SE for the proportion of h2 and enrichment were calculated from the block jackknife resampling using the LDSC method. The p value is calculated using the proportion of heritability and the proportion of heritability SE from the block jackknife resampling, and computing a z-score (two-sided test for significance of enrichment). The x-axis tick marks list the A compartment cluster with the proportion of SNPs in that cluster in parentheses. b Q-Q plots for the uniform distribution of the p values for the genotype-by-BMI interaction effects on CRP in the UKB, stratified by which of the A compartment clusters the SNP lands in. Confidence intervals (dashed lines) were calculated for the A compartment cluster 3. The overall p value corresponds to the Kruskal–Wallis test for differences among all cluster p value distributions. Cluster 1 has a higher accumulation of low p value SNPs than cluster 5 in the post hoc Dunn test (p = 0.041 after correcting for multiple testing using the Holm procedure). CRP indicates C-reactive protein. Source data are provided as a Source Data file.
Fig. 5
Fig. 5. An example of a disruption in ATAC peak co-accessibility in the higher BMI MZ siblings and how it is linked to the twins’ differential expression of INPP5K.
a Schematic of the genomic locus containing the MIR22HG promoter ATAC-seq peak that harbors a GWAS SNP rs11078597 for CRP, TGs, and ALT. Dashed lines represent significant correlations between peak accessibility and gene expression. Red dashed lines indicate positive correlations and blue dashed lines indicate negative correlations. Boxplots show the b differential expression of INPP5K (n = 10 pairs of MZ twins) and c differential accessibility of an ATAC-seq peak toward the 3’ end of the INPP5K gene (n = 9 pairs of MZ twins) between the lower and higher BMI MZ siblings’ preadipocyte data. P values correspond to the two-sided paired t-test. The boxplot center represents the median expression of the indicated gene set in the indicated compartment type, the upper and lower bounds of the box represent the 75th and 25th percentile, respectively, and the upper and lower whiskers represent the highest (non-outlier) and lowest (non-outlier) values, respectively. d The Spearman’s rank correlation between the MIR22HG promoter peak and the INPP5K exonic peak is shown for the lower (left, n = 9 lower BMI MZ siblings) and higher (right, n = 9 higher BMI MZ siblings) BMI MZ siblings separately. The significance of the difference in correlation was assessed using Fisher’s z-transformation (p = 0.027). Source data are provided as a Source Data file.

References

    1. Hotamisligil GS. Inflammation and metabolic disorders. Nature. 2006;444:860–867. doi: 10.1038/nature05485. - DOI - PubMed
    1. Lavie CJ, Arena R, Alpert MA, Milani RV, Ventura HO. Management of cardiovascular diseases in patients with obesity. Nat. Rev. Cardiol. 2018;15:45–56. doi: 10.1038/nrcardio.2017.108. - DOI - PubMed
    1. Cercato C, Fonseca FA. Cardiovascular risk and obesity. Diabetol. Metab. Syndr. 2019;11:74. doi: 10.1186/s13098-019-0468-0. - DOI - PMC - PubMed
    1. Petrilli CM, et al. Factors associated with hospital admission and critical illness among 5279 people with coronavirus disease 2019 in New York City: prospective cohort study. BMJ. 2020;369:m1966. doi: 10.1136/bmj.m1966. - DOI - PMC - PubMed
    1. Docherty AB, et al. Features of 20 133 UK patients in hospital with covid-19 using the ISARIC WHO Clinical Characterisation Protocol: prospective observational cohort study. BMJ. 2020;369:m1985. doi: 10.1136/bmj.m1985. - DOI - PMC - PubMed

Publication types