. 2023 Jul 14;14(1):4216.
doi: 10.1038/s41467-023-39670-4.

Distinct evolution of type I glutamine synthetase in Plasmodium and its species-specific requirement

Affiliations

Distinct evolution of type I glutamine synthetase in Plasmodium and its species-specific requirement

Sourav Ghosh et al. Nat Commun. .

Abstract

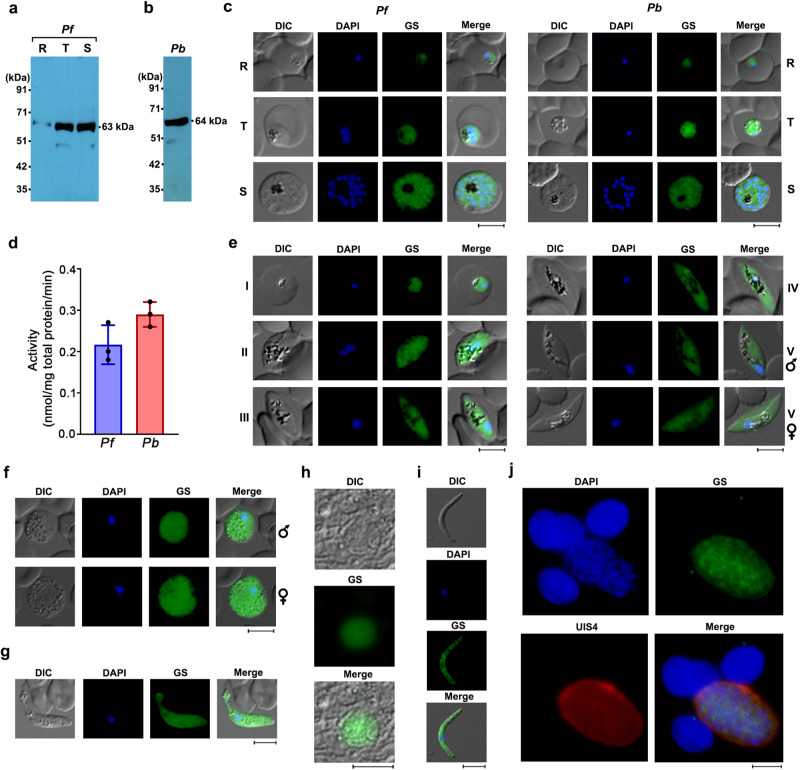
Malaria parasite lacks canonical pathways for amino acid biosynthesis and depends primarily on hemoglobin degradation and extracellular resources for amino acids. Interestingly, a putative gene for glutamine synthetase (GS) is retained despite glutamine being an abundant amino acid in human and mosquito hosts. Here we show Plasmodium GS has evolved as a unique type I enzyme with distinct structural and regulatory properties to adapt to the asexual niche. Methionine sulfoximine (MSO) and phosphinothricin (PPT) inhibit parasite GS activity. GS is localized to the parasite cytosol and abundantly expressed in all the life cycle stages. Parasite GS displays species-specific requirement in Plasmodium falciparum (Pf) having asparagine-rich proteome. Targeting PfGS affects asparagine levels and inhibits protein synthesis through eIF2α phosphorylation leading to parasite death. Exposure of artemisinin-resistant Pf parasites to MSO and PPT inhibits the emergence of viable parasites upon artemisinin treatment.


Conflict of interest statement

The authors declare no competing interests.

Figures

Fig. 1
Fig. 1. Multiple sequence alignment and homology modeling of Plasmodia GS.
a Multiple sequence alignment of Plasmodia GS (Pf, Pv and Pb) with type I GS of Mt, St and Hp. The alignment was carried out with SeaView Version 3.2 (http://pbil.univ-lyon1.fr/software/seaview3). The secondary structures predicted as α-helices and β-strands are represented as red cylinders and blue arrows, respectively. The conserved amino acid residues in the catalytic and flexible loops of ‘bifunnel’ active site - Asp59 and Asp73 present in the aspartate loop, Tyr212 present in the tyrosine loop, Phe287 and Asn296 present in the asparagine loop, and Glu361 present in the glutamate loop are highlighted with green asterisks. The residues that are involved in the substrate and ligand interactions - Ser61, Glu137, Glu139, Glu245, Glu252, Gly297, His301, Ser305, Arg355, Arg373, Arg378, Glu393 and Arg395 are highlighted with brown asterisks. The tyrosine residue that undergoes adenylylation in Mt and St GS are highlighted with pink asterisk. b Monomeric and oligomeric structures of Pf, Pv and Pb GS. Pv and Pb GS structures were modeled based on the cryoEM structure of Pf GS (PDB ID: 6PEW). Plasmodia GS-specific peptide inserts are represented in blue (Insert 1) and red (Insert 2). c Monomeric and oligomeric structures of Mt GS (PDB ID: 2WGS).
Fig. 2
Fig. 2. Inhibition and regulation of Plasmodium GS.
a Schematic representation of GS enzymatic reaction. b,c Coomassie gel pictures of rPfGS and rPbGS purified using Ni2+-NTA resin and their Western blot analysis using anti-his tag antibodies, respectively. Lane M: Protein molecular weight marker (kDa). d HPLC chromatogram of rPfGS and rPbGS enzyme assays. bd n = 3 independent experiments. e, f Effect of MSO on rPfGS and rPbGS activity, respectively. g, h Effect of PPT on rPbGS and rPbGS activity, respectively. Percentage of activities (mean ± SD) with respect to the control (without inhibitor) are shown and the assays were independently carried out with 0.1, 0.5, 1.0, and 2.0 mM concentrations of glutamate. n = 3 independent protein preparations. i, j Comparison of the feedback inhibition of rPfGS and rE.coli GS in the presence of MgCl2 at 1 mM (i) and 5 mM (j) concentrations of amino acids and AMP. “6AAs” represents the mixture of all the six amino acids. For “6AAs” of 5 mM concentration, tryptophan alone was used at 2.5 mM concentration because of its limited solubility and the rest were used at 5 mM concentration. The percentage of activities with respect to the control (without feedback inhibitor) are shown (mean ± SD; n.s - not significant, *P < 0.05, **P < 0.01, ***P < 0.001, unpaired t-test; two-sided). n = 3 independent protein preparations. k Western blot analysis of rPfGS, rPbGS and rE.coli GS adenylylation with anti-AMP-tyrosine antibody. The doublet was observed for rE.coli GS could be because of the oligomerization of rE.coli GS having ~3 kDa higher molecular weight due to the presence of histidine tag and enterokinase recognition and cleavage sites, with endogenous E. coli GS. l Western blot analysis of endogenous GS immunoprecipitated from Pf and Pb parasite lysates. 15 μl of 150 μl parasite lysates and 10 μl of 30 μl immunoprecipitation eluates were used. m Western blot analysis of adenylylation in immunoprecipitated PfGS and PbGS. rE.coli GS was used as a control. 0.1 μg of eluted protein was used. IP - immunoprecipitation. km n = 2 independent experiments. For eh individual data points are shown with respective light-shaded colors. Source data are provided as a Source Data file.
Fig. 3
Fig. 3. Characterization of rPfGS lacking the first and second peptide inserts.
a Schematic representations showing deletions of first and second peptide inserts. b HPLC chromatograms of ΔI1rPfGS and ΔI2rPfGS enzyme assays. Specific activities (mean ± SD shown below represent four different protein preparations. Lack of enzyme activity in ΔI2rPfGS was also verified with MnCl2 and for a prolonged incubation of 6 h. c Effect of MSO and PPT on ΔI1rPfGS activity. Individual data points are shown with the respective light shaded colors. d Feedback inhibition of ΔI1rPfGS in the presence of MgCl2 and MnCl2 at 5 mM concentrations of amino acids and AMP. For c and d percentage of activities (mean ± SD) with respect to control (without inhibitor/feedback inhibitor) are shown. n = 3 different protein preparations. e Comparison of Plasmodia and bacterial GS I dodecamer channels. Mt, St, and Hp structures were retrieved from PDB. f Comparison of rPfGS and ΔI1rPfGS thermal stabilities. Percentage of inhibition of the activities (mean ± SD) with respect to unexposed controls are shown. n = 3 different protein preparations. Recombinant proteins were exposed to the respective temperatures for one hour before performing assays at 37 °C. g Chromatograms showing the dissociation of oligomers in rPfGS and ΔI1rPfGS. Protein preparations were exposed to 37 °C or 42 °C for 15 min and subjected immediately to size-exclusion chromatography. h, Western analysis of rPfGS (~65 kDa) and ΔI1rPfGS (~63 kDa) in 12.7 and 15.9 ml elution volume fractions. i Estimation of rPfGS molecular weights eluted at 12.7 and 15.9 ml based on the elution of standard proteins. For gi n = 2 independent protein preparations. j Unique hydrogen bond interactions of PfGS and ΔI2rPfGS are shown for subunit A. Four subunits are represented in green (subunit A), pink (subunit B), yellow (subunit C) and cyan (subunit D). Interactions without the subunit background are shown below. k Superimposition of MD simulation structures of two adjacent subunits from upper and lower hexamers of PfGS (grey) and ΔI2rPfGS (red). (n.s - not significant, **P < 0.01, ***P < 0.001, unpaired t-test; two-sided). Source data are provided as a Source Data file.
Fig. 4
Fig. 4. Expression of GS in the life cycle of Plasmodia.
a Western analysis of GS expression in the lysates of Pf rings, trophozoites and schizonts. Equal number of rings (R), trophozoites (T) and schizonts (S) were used from 10 ml of tightly synchronized cultures. b Western analysis of GS expression in Pb parasite lysate. 50 μg of total protein was used. c Immunofluorescence analysis of GS expression in Pf and Pb rings (R), trophozoites (T) and schizonts (S). Scale bar = 5 μM. For ac, n = 3 independent experiments. d GS activity in the parasite lysates of Pf and Pb. The activity (mean ± SD) was determined with respect to the total protein. n = 3 independent preparations. e Immunofluorescence analysis of GS expression in Pf gametocytes (Stage I-V). Scale bar = 5 μM. f Immunofluorescence analysis of GS expression in Pb gametocytes. Scale bar = 5 μM. gi Immunofluorescence analysis of GS expression in Pb ookinete, oocyst and sporozoite, respectively. Scale bar for ookinete and sporozoite = 5 μM. Scale bar for oocyst = 20 μM. j, Immunofluorescence analysis of GS expression in Pb exo-erythrocytic stage. UIS4 antibody was used to identify the exo-erythrocytic stage. Scale bar = 20 μM. All the images were captured using 60x/100x objective. Oocyst image was captured using 20x objective. For ej n = 2 independent experiments. Source data are provided as a Source Data file.
Fig. 5
Fig. 5. Conditional knock sideways of GS in Pf.
a Schematic representation of conditional knock sideways approach to mislocalize PfGS. b Genomic DNA PCR confirmation for PfGScKS parasites. Lane 1 and 4: 1.76 kb product amplified with GS-specific forward and reverse primers. Lane 2 and 5: 2.64 kb product amplified with GS-specific forward and GFP-specific reverse primers to confirm the in-frame fusion. Lane 3 and 6: 1.82 kb product amplified with GS-specific forward and 3’ UTR-specific reverse primer to confirm the integration. Lane M: 1 kb ladder. c RT-PCR confirmation for PfGScKS parasites. Lane 1 and 3: 2.51 kb product amplified with GS-specific forward and GFP-specific reverse primers. Lane 2 and 4: 1.63 kb product amplified with GS-specific forward and reverse primers. Lane M: 1 kb ladder. d Western blot confirmation for GS-FKBP-GFP fusion in PfGScKS parasites. Upper panel: Confirmation of 120 kDa fusion protein in PfGScKS parasites with GFP antibody. Middle panel: Confirmation with PfGS antibody. Lower panel: Parasite GAPDH as a loading control. e Live imaging of GS-FKBP-GFP localization in PfGScKS parasites. Images were captured using 100x objective. Scale bar = 5 μM. For be n = 3 independent experiments. f Specific activity of rPfGS-FKBP-GFP fusion protein in comparison with rPfGS. (mean ± SD; **P < 0.001, unpaired t-test; two-sided). n = 4 independent assays performed with two different protein preparations. g Asexual stage growth analysis of Pf3D7 and PfGScKS parasites in RPMINgln, RPMIPgln and RPMI-gln medium, and PfGScKS+Lyn parasites in RPMIPgln medium. (mean ± SD; ***P ≤ 0.001, Two-way ANOVA). Rapa - rapamycin. n = 4 independent experiments. h Live fluorescence analysis of GS mislocalization in rapamycin-treated PfGScKS+Lyn asexual stages. Images were captured using 100x objective. Scale bar = 5 μM. i Analysis of gametocyte maturation in cKS-induced PfGScKS+Lyn parasites in RPMIPgln medium. (mean ± SD; n.s - not significant, **P < 0.01, ***P < 0.001, Two-way ANOVA) Rapa - rapamycin. n = 3 independent experiments. j Live fluorescence analysis of GS mislocalization in rapamycin-treated PfGScKS+Lyn gametocytes, respectively. Images were captured using 100x objective. Scale bar = 5 μM. n = 3 independent experiments. Source data are provided as a Source Data file.
Fig. 6
Fig. 6. Characterization of PbGSKO in the asexual stages.
a Double crossover recombination strategy utilized for the generation of PbGSKO parasites. b Genomic DNA PCR confirmation for GS deletion in Pb. Lane 1 and 3: GS amplification (2.04 kb). Lane 2 and 4: PbGAPDH amplification (1.25 kb). Lane M: 1 kb ladder. c RT-PCR confirmation for GS deletion. Lane 1 and 3: GS amplification (1.66 kb). Lane 2 and 4: GAPDH amplification (1.01 kb). Lane M: 1 kb ladder. d Southern blot analysis to confirm GS deletion. e Western blot confirmation of GS deletion. 50 μg total protein was loaded. GAPDH was used as control. f Immunofluorescence confirmation for GS deletion. Scale bar = 10 μM. For bf n = at least 2 independent experiments. g Growth analysis of PbWT (n = 13) and PbGSKO (n = 13) in Balb/c mice. 105 parasites were used to initiate infections. (mean ± SD; n.s - not significant, Two-way ANOVA). h Mortality curves of mice infected with PbWT (n = 13) and PbGSKO (n = 12) parasites in Balb/c mice. (n.s - not significant, log-rank (Mantel-Cox) test). i Percentage of infected reticulocytes in parasitized red cells of PbWT (n = 5) and PbGSKO-infected mice (n = 5). (mean ± SD; n.s - not significant, Two-way ANOVA). j Growth analysis of PbWT (n = 13) and PbGSKO (n = 12) in C57BL/6 mice. 105 parasites were used to initiate infections. (mean ± SD; n.s - not significant, Two-way ANOVA). k Mortality curves of mice infected with PbWT (n = 13) and PbGSKO (n = 12) parasites in C57BL/6 mice. (n.s - not significant, log-rank (Mantel-Cox) test). l Quantification of Evans blue extravasation in the brain samples of mice infected with PbWT and PbGSKO parasites (n = 3). (mean ± SD; n.s - not significant, unpaired t-test; two-sided). UI - uninfected mouse. mo Estimation of plasma glutamine (m), ammonia (n) and ATP (o) in PbWT- and PbGSKO-infected Balb/c and C57BL/6 mice (n = 3). (mean ± SD; n.s - not significant, unpaired t-test; two-sided). Source data are provided as a Source Data file.
Fig. 7
Fig. 7. Sexual and exo-erythrocytic stage development of PbGSKO parasites.
a Number of male and female gametocytes observed in Giemsa-stained smears of Balb/c mice (n = 6) prepared on day 8 post-infection. b Number of exflagellation centers observed in glutamine-free (Gln-) and glutamine-containing (Gln+) exflagellation medium for the blood collected on day 8 post-infection. n = 7 different Balb/c mice. c In vitro ookinete formation in glutamine-free (Gln-) and glutamine-containing (Gln+) medium. n = 3 different Balb/c mice. For ac (mean ± SD; n.s - not significant, unpaired t-test; two-sided). d Giemsa-stained images for in vivo ookinetes observed in smears prepared from the blood bolus collected at 21 h post-fed mosquito guts. Images were captured using 100x objective. Scale bar = 5 μM. e In vivo ookinete formation in the mosquito guts dissected at 21 h post-feeding. f Mercurochrome staining for the day 10 post-fed mosquito guts. Black arrows indicate oocysts. Images were captured using 20x objective. Scale bar = 20 μM. g In vivo oocyst formation in the mosquito guts dissected on day 10 post-feeding. h Bright field images of salivary glands from day 16 post-fed mosquitoes. Black arrows indicate sporozoites. Scale bar = 20 μM. i In vivo sporozoite formation in the mosquito salivary glands dissected on day 17 post-feeding. For di n = 30 mosquitoes from three independent batches. (n.s - not significant, **P < 0.01, unpaired t-test; two-sided) j Growth curve analysis performed for Balb/c mice infected with sporozoites assessing the ability of PbGSKO sporozoites to undergo exo-erythrocytic stage development. Appearance of blood stage parasites was monitored by Giemsa smears prepared form peripheral blood. n = 3. (mean ± SD; n.s - not significant, Two-way ANOVA). km Immunofluorescence analysis of PbGSKO ookinete (k), sporozoite (l) and exo-erythrocytic stage (m) with PbGS antibodies. n = 2 independent experiments. Scale bar for ookinete and sporozoite = 5 μM. UIS4 antibody was used to identify the exo-erythrocytic stages. Scale bar for exo-erythrocytic stage = 20 μM. Images were captured using 60x/100x objective. Source data are provided as a Source Data file.
Fig. 8
Fig. 8. Differential Inhibition of Pf and Pb parasites by MSO and PPT.
a Effect of MSO on in vitro cultures of Pf in RPMI-gln medium. n = 4 independent experiments. b Giemsa-stained images of Pf parasites treated with MSO. c Effect of PPT on in vitro cultures of Pf in RPMI-gln medium. n = 3 independent experiments. d Giemsa-stained images of Pf parasites treated with PPT. e Effect of MSO and PPT on in vitro single-cycle cultures of Pb maintained in RPMI-gln medium. Giemsa-stained images of MSO and PPT-treated Pb schizonts are provided for 1 mM concentration. A growth assessment was carried out based on 3H-hypoxanthine uptake and verified by Giemsa-stained smears. n = 3 independent experiments. f Effect of MSO and PPT on in vivo Pb growth in Balb/c mice. Pb infections were initiated by injecting 105 parasites intraperitoneally on day 0. Mice were treated with the respective doses of MSO and PPT for four consecutive days starting from day 4. n = 3 different mice. Giemsa-stained images of MSO and PPT-treated Pb parasites are provided for 20 mg/kg treatment. Images for Giemsa-stained parasites were captured using 100x objective. Scale bar = 5 μM. For a, c, e, and f the data represent mean ± SD. Source data are provided as a Source Data file.
Fig. 9
Fig. 9. Targeting GS in Pf affects asparagine levels and protein synthesis.
a, c In vitro metabolic labeling of Pf (a) and Pb (c) cultures with [35S]-Methionine and -Cysteine. Percentage of inhibition (mean ± SD) for treated parasites based on 35S counts with respect to solvent control is shown. b, d SDS-PAGE analysis of protein labeling for Pf (b) and Pb (d) parasites. Phosphorimager scan was performed after overnight exposure. n = 3 independent experiments. e Quantification of aspartate, glutamate, asparagine and glutamine levels in Pf cultures treated with 50 (n = 4) and 250 μM (n = 6) MSO. In vitro experiments were carried out in RPMI-gln medium. f Quantification of aspartate, glutamate, asparagine and glutamine levels in PbGSKO parasites (n = 4). For e and f relative fold changes of the amino acids with respect to control are plotted after normalizing them with the levels of serine, threonine, histidine, arginine and tyrosine. Box and whisker plots display minimum/maximum points (whiskers), 25th/75th percentile (boxes) and median (center line). g, h Western analysis of total and phosphorylated eIF2α levels in Pf and Pb parasites, respectively. 10 ml of synchronized Pf cultures having rings were treated in vitro with 250 μM MSO for 6 h in RPMI-gln medium. Shorter treatment of Pf rings was preferred since eIF2α phosphorylation occurs at late asexual stages. n = 4 independent experiments. For Pb, infected mouse blood containing rings was incubated in vitro with 250 μM MSO for 6 h in RPMI-gln medium. n = 2 independent experiments. i Functional classification of downregulated proteins in MSO-treated Pf parasites. j List of downregulated asparagine-rich proteins in MSO-treated Pf parasites. Proteins containing ≥10% asparagine or at least one asparagine repeat with 5 or more asparagine residues were considered asparagine-rich. For i and j proteins identified in both the untreated controls of two independent experiments and either undetectable or significantly downregulated (≥1.5 fold) in MSO-treated Pf parasites are represented. List of other downregulated proteins is provided in Supplementary Fig. 7a. Source data and silver-stained gels representing phosphorimager scans are provided as a Source Data file.
Fig. 10
Fig. 10. Effect of MSO and PPT on Pf and Pv clinical isolates and ART-resistant PfCam3.IR539T strain.
a Effect of MSO on in vitro growth of Pf (n = 7) and Pv (n = 6) clinical isolates in RPMI-gln. b Effect of PPT on in vitro growth of Pf (n = 7) and Pv (n = 6) clinical isolates in RPMI-gln. A growth assessment was carried out based on 3H-hypoxanthine uptake and verified by Giemsa-stained smears. c Effect of ART/DHA and MSO combination on the growth of ART-resistant PfCam3.IR539T parasites in RSA were performed with RPMI-gln medium. The percentage of growth inhibition of ART/DHA and MSO combination treatment was determined at 96 h with respect to ART/DHA-treated parasites. The percentage of growth inhibition of MSO treatment alone was determined at 96 h with respect to untreated parasites. d Effect of ART/DHA and PPT combination on the growth of ART-resistant PfCam3.IR539T parasites in RSA were performed with RPMI-gln medium. The percentage of growth inhibition of ART/DHA and PPT combination treatment was determined at 96 h with respect to ART/DHA-treated parasites. The percentage of growth inhibition of PPT treatment alone was determined at 96 h with respect to untreated parasites. Growth assessment was carried out based on 3H-hypoxanthine uptake and verified by Giemsa-stained smears and flow cytometry. (mean ± SD; **P < 0.01, ***P < 0.001, Two-way ANOVA) n = 3 independent experiments. e Model depicting the distinct evolution of Plasmodium GS and its significance in P. falciparum. Lack of feedback inhibition by amino acids and absence of adenylylation in Plasmodium GS are represented. Blue arrows highlight the requirement of GS in supporting Pf asparagine-rich proteome and the role of glutamine as a reservoir of nitrogen source in ART-resistance. FV- food vacuole; Mito - mitochondrion; RBC - red blood cell. The model was created with BioRender.com.

References

    1. Gardner MJ, et al. Genome sequence of the human malaria parasite Plasmodium falciparum. Nature. 2002;419:498–511. doi: 10.1038/nature01097. - DOI - PMC - PubMed
    1. Payne SH, Loomis WF. Retention and loss of amino acid biosynthetic pathways based on analysis of whole-genome sequences. Eukaryot. Cell. 2006;5:272–276. doi: 10.1128/EC.5.2.272-276.2006. - DOI - PMC - PubMed
    1. Olszewski KL, Llinás M. Central carbon metabolism of Plasmodium parasites. Mol. Biochem. Parasitol. 2011;175:95–103. doi: 10.1016/j.molbiopara.2010.09.001. - DOI - PMC - PubMed
    1. Krishnan A, Soldati-Favre D. Amino acid metabolism in apicomplexan parasites. Metabolites. 2021;11:61. doi: 10.3390/metabo11020061. - DOI - PMC - PubMed
    1. Francis SE, Sullivan DJ, Jr., Goldberg DE. Hemoglobin metabolism in the malaria parasite Plasmodium falciparum. Annu. Rev. Microbiol. 1997;51:97–123. doi: 10.1146/annurev.micro.51.1.97. - DOI - PubMed

Publication types