. 2023 Jul 14;14(7):428.
doi: 10.1038/s41419-023-05931-9.

Efferocytosis by bone marrow mesenchymal stromal cells disrupts osteoblastic differentiation via mitochondrial remodeling

Affiliations

Efferocytosis by bone marrow mesenchymal stromal cells disrupts osteoblastic differentiation via mitochondrial remodeling

Emily R Quarato et al. Cell Death Dis. .

Abstract

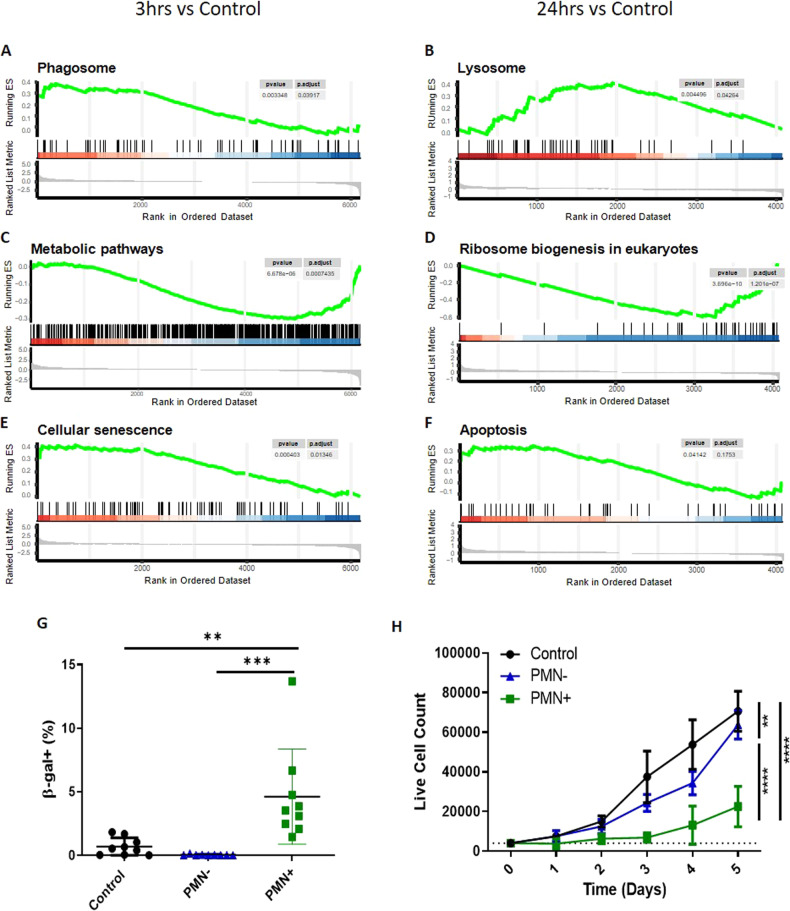
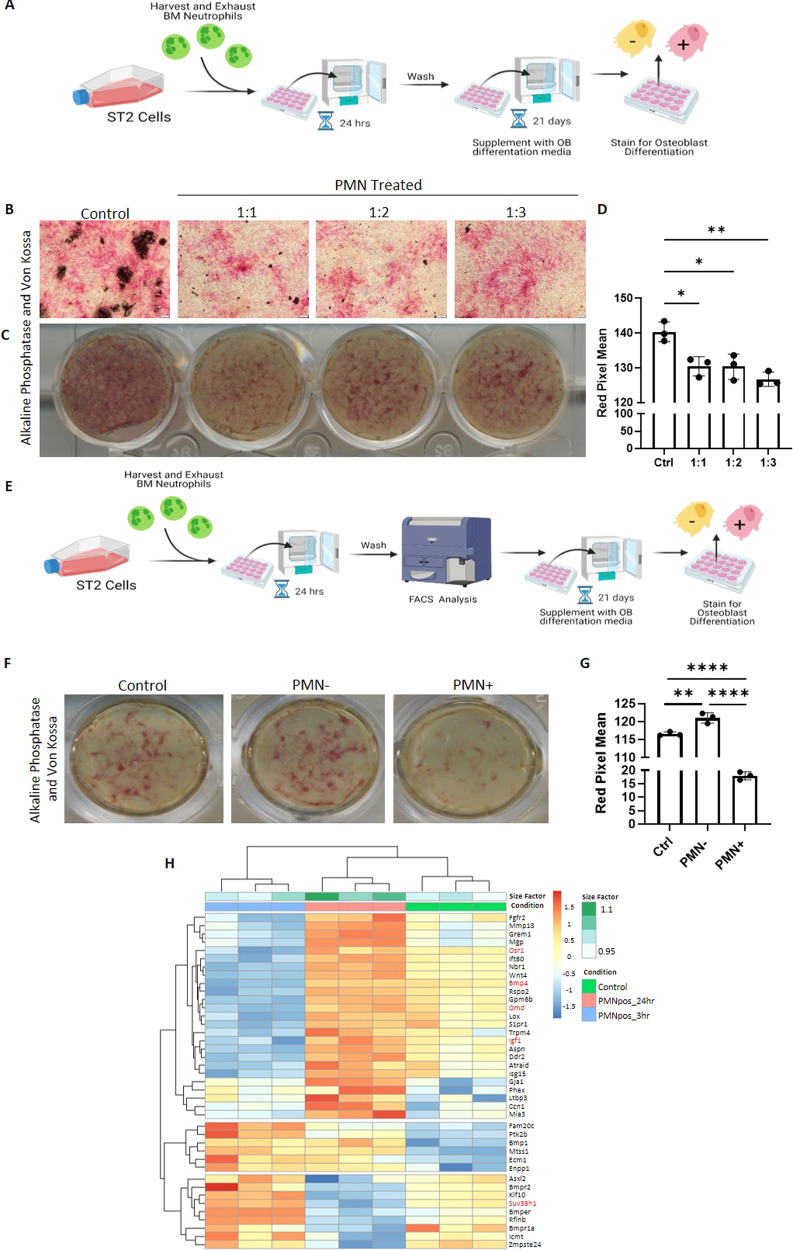
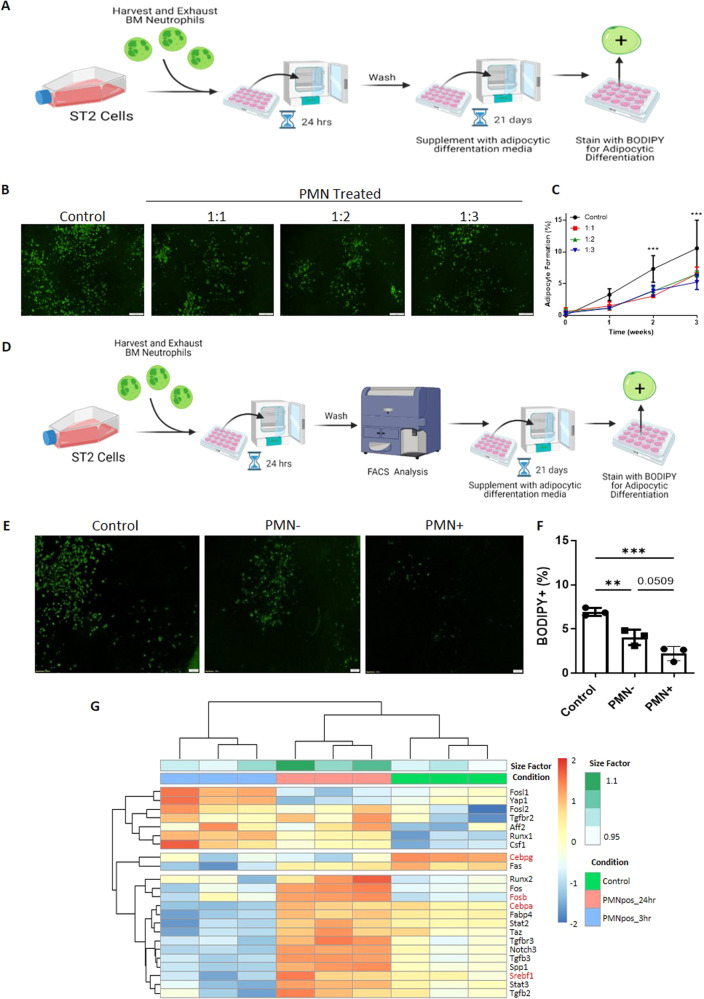
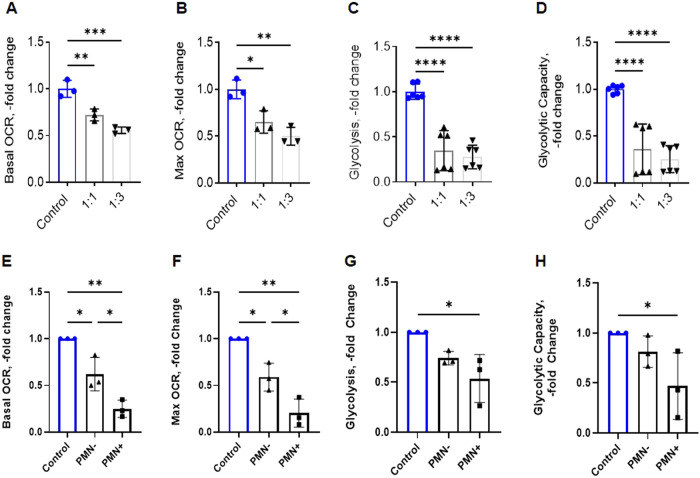
The efficient clearance of dead and dying cells, efferocytosis, is critical to maintain tissue homeostasis. In the bone marrow microenvironment (BMME), this role is primarily fulfilled by professional bone marrow macrophages, but recent work has shown that mesenchymal stromal cells (MSCs) act as a non-professional phagocyte within the BMME. However, little is known about the mechanism and impact of efferocytosis on MSCs and on their function. To investigate, we performed flow cytometric analysis of neutrophil uptake by ST2 cells, a murine bone marrow-derived stromal cell line, and in murine primary bone marrow-derived stromal cells. Transcriptional analysis showed that MSCs possess the necessary receptors and internal processing machinery to conduct efferocytosis, with Axl and Tyro3 serving as the main receptors, while MerTK was not expressed. Moreover, the expression of these receptors was modulated by efferocytic behavior, regardless of apoptotic target. MSCs derived from human bone marrow also demonstrated efferocytic behavior, showing that MSC efferocytosis is conserved. In all MSCs, efferocytosis impaired osteoblastic differentiation. Transcriptional analysis and functional assays identified downregulation in MSC mitochondrial function upon efferocytosis. Experimentally, efferocytosis induced mitochondrial fission in MSCs. Pharmacologic inhibition of mitochondrial fission in MSCs not only decreased efferocytic activity but also rescued osteoblastic differentiation, demonstrating that efferocytosis-mediated mitochondrial remodeling plays a critical role in regulating MSC differentiation. This work describes a novel function of MSCs as non-professional phagocytes within the BMME and demonstrates that efferocytosis by MSCs plays a key role in directing mitochondrial remodeling and MSC differentiation. Efferocytosis by MSCs may therefore be a novel mechanism of dysfunction and senescence. Since our data in human MSCs show that MSC efferocytosis is conserved, the consequences of MSC efferocytosis may impact the behavior of these cells in the human skeleton, including bone marrow remodeling and bone loss in the setting of aging, cancer and other diseases.


Conflict of interest statement

The authors declare no competing interests.

Figures

Fig. 1
Fig. 1. MSCs can conduct efferocytosis.
A, B Representative flow cytometry gating scheme and quantification of ST2 cells incubated with eFluoro670 labelled end stage neutrophils (PMNs) for 24 h. N = 6. Mean ± SD shown on graph. C, D Representative microscopy images showing uptake of end stage neutrophils (GFP+) by ST2 cells (mCherry+) and the resulting void in the cytoplasm. Videos E, F Confocal microscopy video (middle right) and z-stack captured of ST2 cells up taking end stage neutrophil (GFP+).
Fig. 2
Fig. 2. MSCs upregulate efferocytic receptor-pathways following efferocytosis.
A ST2 experimental setup (B) Principal component analysis (PCA) of 3 and 24 h sorted efferocytic ST2 cells via bulk RNA sequencing. C Heat map and (D, E) read count of efferocytic and intracellular processing genes at 3 h or 24 h vs the control analyzed via a DESeq2 with a benjamini-hochberg FDR correction. F Schematic representation of primary mMSC experimental setup (G) Principal component analysis of 4 h sorted efferocytic mMSCs cells fed apoptotic thymocytes via bulk RNA sequencing. H Heat map and (I, J) Read count of efferocytic and intracellular processing genes at 4 h SCAT vs SC analyzed via a DESeq2 with a benjamini-hochberg FDR correction.
Fig. 3
Fig. 3. Efferocytosis by MSCs decreased expression of metabolism genes and increases stress response genes.
GSEA analysis of efferocytic ST2 cell (PMN+) vs control at 3 h (A, C, E) and at 24 h (B, D, F). Gene signatures for the (A, B) processing machinery, (C, D) metabolic pathways and biogenesis, and (E, F) cellular fate. G ST2 cells incubated with excess (1:10) of end stage neutrophils (PMN) for 24 h and then stained for Beta-galactosidase (β-Gal) and analyzed via flow cytometry. Graphs show N = 9 wells (3 wells/experiment), quantified showing Mean + SD. **p < 0.01, ***p < 0.001, (ANOVA with post Tukey test). H ST2 cells challenged with excess neutrophils (1:10) for 24 h and then sorted alongside controls into PMN +/− and replated and counted daily over a 5-day timespan. Graphs show N = 4 wells, quantified showing Mean + SD. **p < 0.01, ****p < 0.0001, (ANOVA with post Tukey test).
Fig. 4
Fig. 4. Efferocytosis of end stage neutrophils disrupts osteoblastic differentiation.
A Experimental Schematic (B–D) Bone marrow-derived ST2 cells incubated with increasing concentrations of end stage neutrophils (PMN) for 24 h, then differentiated into osteoblasts using supplemented media for 21 days and stained for alkaline phosphatase (red) and Von Kossa. Representative Images of 3, quantified showing Mean+SD. *p < 0.05, **p < 0.01, (ANOVA). E Experimental Schematic for sorted samples (F, G) ST2 cells challenged with excess neutrophils (1:10) and then sorted alongside controls into PMN +/−, differentiated into osteoblasts using supplemented media for 21 days, and then stained for alkaline phosphatase and Von Kossa. Representative Images of 3, quantified showing Mean + SD. **p < 0.01, ****p < 0.0001, (ANOVA with post Tukey test). H Heat map of genes related to osteogenesis at 3 h or 24 h vs the control.
Fig. 5
Fig. 5. Efferocytosis of end stage neutrophils disrupts adipocytic differentiation.
A Experimental Schematic (B, C) Bone marrow-derived ST2 cells incubated with increasing concentrations end stage neutrophils (PMN) for 24 h, then differentiated into adipocytes using supplemented media for 21 days and stained for lipid deposits with BODIPY staining. Representative images of 3, quantified showing Mean + SD. ***p < 0.001, (ANOVA). D Experimental Schematic for sorted samples (E, F) ST2 cells challenged with excess neutrophils (1:10) and then sorted alongside controls into PMN +/−, differentiated into adipocytes using supplemented media for 21 days, and then stained for lipid deposits with BODIPY staining. Representative Images of 3, quantified showing Mean+SD. **p < 0.01, ***p < 0.001, (ANOVA with post Tukey test). G Heat map of genes related to adipogenesis at 3 h or 24 h vs the control.
Fig. 6
Fig. 6. Oxidative Phosphorylation and Glycolysis disrupted in efferocytic MSCs.
A–D Mitochondrial oxygen consumption rate (OCR), glycolysis, and glycolytic capacity measured with the Seahorse XF technology of bone marrow-derived ST2 cells incubated with increasing dosage of end stage neutrophils (PMN). Graphs show actual data points (each point contains 8 technical replicates) and calculated Mean + SD. *p < 0.05, **p < 0.01, ***p < 0.001, ****p < 0.0001 (ANOVA). E–H Mitochondrial oxygen consumption rate (OCR), glycolysis, and glycolytic capacity measured with the Seahorse XF technology of ST2 cells challenged with excess neutrophils (1:10) and then sorted alongside controls into PMN +/−. Graphs show biological data points (each containing 8 technical replicates) and calculated Mean + SD. *p < 0.05, **p < 0.01, (ANOVA with post Tukey test).
Fig. 7
Fig. 7. Efferocytosis shifts MSC mitochondria toward fission.
A Heat map of mitochondrial biogenesis and dynamic genes and pathways at 3 h or 24 h vs the control in ST2 cells. Key genes regulating mitochondrial dynamics are highlighted in red (fission) and blue (fusion). B, C Representative images of control and efferocytically challenged (PMN+) hMSCs stained with MitoTracker Red (mitochondria) and DAPI (nucleus). PMN stained with Calcein AM. Highlighted regions are magnified and shown as inserts on the right of each image. ImageJ analysis of mitochondrial connectivity shown as numbers of connected pixels (Mean ± SD, n = 25). D Mitochondria from control and challenged (PMN+) hMSCs stained with tetramethyl rhodamine ethyl ester (TMRE) to measure mitochondrial membrane potential. Graphs show the biological data points N = 3, Mean + SD, *p < 0.05, (t-test). E Quantification of efferocytosis by hMSCs incubated excess (1:10) end stage neutrophils (hPMNs) over 24 h. N = 4 at each time point. Means ± SD are shown. (F) Representative microscopy images showing uptake of end stage neutrophil (GFP+) by hMSC (mCherry+) and the resulting voids in the cytoplasm (white arrows). G Experimental Schematic for samples treated with a mitochondrial inhibitor (MDivi). H–J Quantification via flow cytometry of viability, end stage neutrophil (PMNs) engulfment, and efficiency (mean fluorescent intensity, MFI) of hMSCs pre-treated with 25 μM Mdivi for 1 h and then given end stage PMN for 24 h. K Quantification of Alkaline Phosphatase (ALP) via qPCR of hMSCs pre-treated with 25 μM Mdivi for 1 h and then given end stage PMN for 3 h. N = 3, Mean ± SD shown on graphs **p < 0.01, ***p < 0.001, (t-test or ANOVA).

References

    1. Saas P, Daguindau E, Perruche S. Concise Review: Apoptotic Cell‐Based Therapies–Rationale, Preclinical Results and Future Clinical Developments. Stem Cells. 2016;34:1464–73. doi: 10.1002/stem.2361. - DOI - PubMed
    1. Elliott MR, Ravichandran KS. The dynamics of apoptotic cell clearance. Dev cell. 2016;38:147–60. doi: 10.1016/j.devcel.2016.06.029. - DOI - PMC - PubMed
    1. Rabinovitch M. Professional and non-professional phagocytes: an introduction. Trends Cell Biol. 1995;5:85–7. doi: 10.1016/S0962-8924(00)88955-2. - DOI - PubMed
    1. Parnaik R, Raff MC, Scholes J. Differences between the clearance of apoptotic cells by professional and non-professional phagocytes. Curr Biol. 2000;10:857–60. doi: 10.1016/S0960-9822(00)00598-4. - DOI - PubMed
    1. Bianconi E, Piovesan A, Facchin F, Beraudi A, Casadei R, Frabetti F, et al. An estimation of the number of cells in the human body. Ann Hum Biol. 2013;40:463–71. doi: 10.3109/03014460.2013.807878. - DOI - PubMed

Publication types