. 2023 Oct;33(10):745-761.
doi: 10.1038/s41422-023-00849-5. Epub 2023 Jul 14.

The complete and fully-phased diploid genome of a male Han Chinese

Affiliations

The complete and fully-phased diploid genome of a male Han Chinese

Chentao Yang et al. Cell Res. 2023 Oct.

Abstract

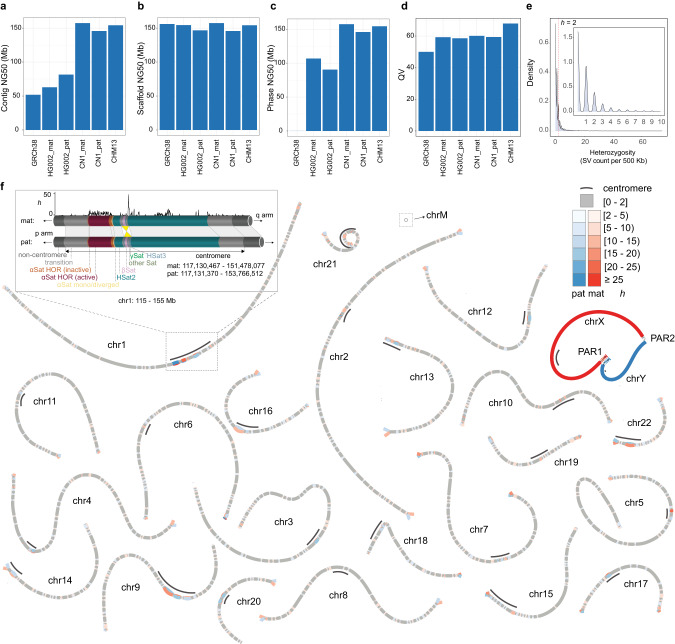
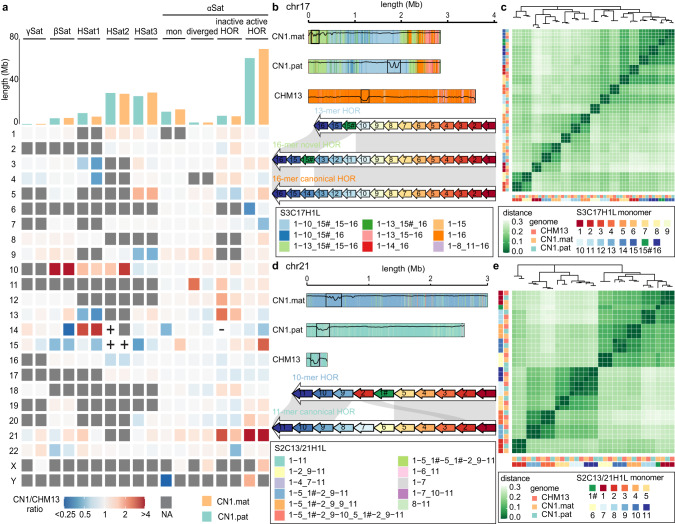
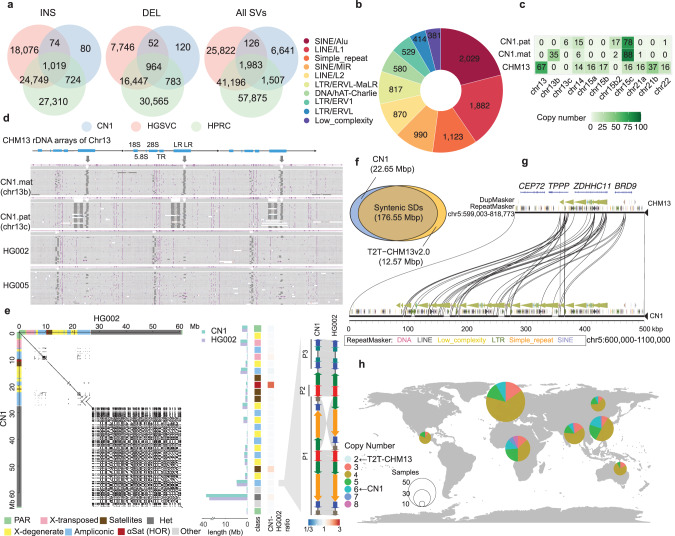
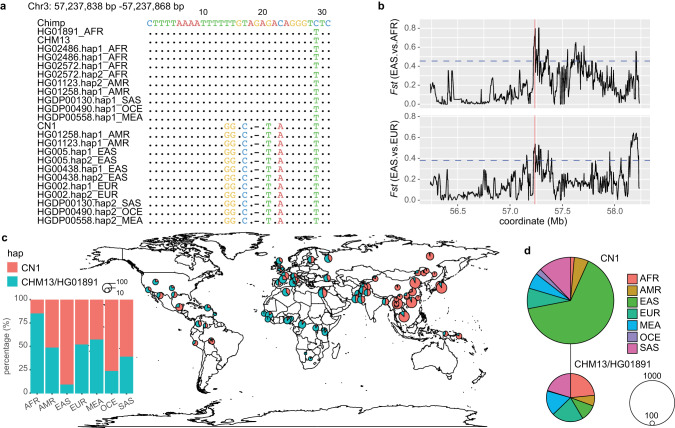
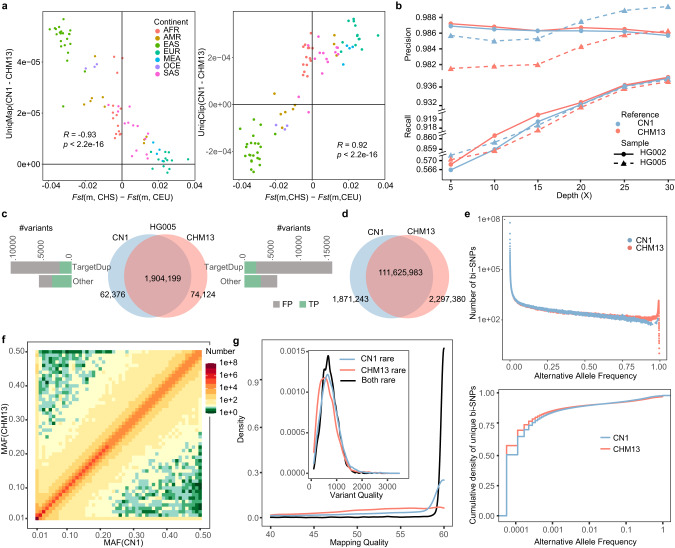
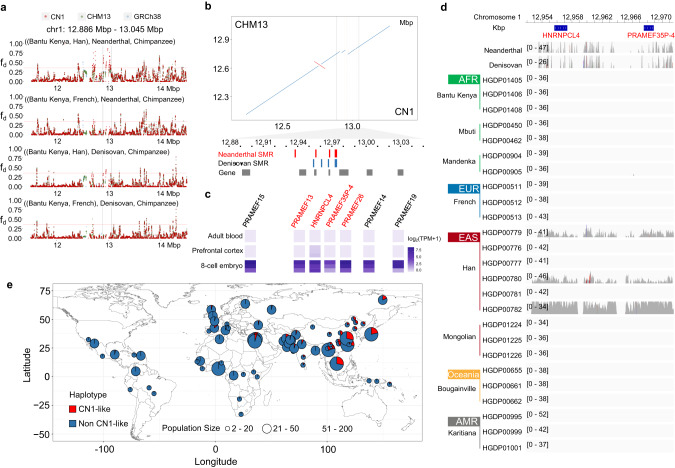
Since the release of the complete human genome, the priority of human genomic study has now been shifting towards closing gaps in ethnic diversity. Here, we present a fully phased and well-annotated diploid human genome from a Han Chinese male individual (CN1), in which the assemblies of both haploids achieve the telomere-to-telomere (T2T) level. Comparison of this diploid genome with the CHM13 haploid T2T genome revealed significant variations in the centromere. Outside the centromere, we discovered 11,413 structural variations, including numerous novel ones. We also detected thousands of CN1 alleles that have accumulated high substitution rates and a few that have been under positive selection in the East Asian population. Further, we found that CN1 outperforms CHM13 as a reference genome in mapping and variant calling for the East Asian population owing to the distinct structural variants of the two references. Comparison of SNP calling for a large cohort of 8869 Chinese genomes using CN1 and CHM13 as reference respectively showed that the reference bias profoundly impacts rare SNP calling, with nearly 2 million rare SNPs miss-called with different reference genomes. Finally, applying the CN1 as a reference, we discovered 5.80 Mb and 4.21 Mb putative introgression sequences from Neanderthal and Denisovan, respectively, including many East Asian specific ones undetected using CHM13 as the reference. Our analyses reveal the advances of using CN1 as a reference for population genomic studies and paleo-genomic studies. This complete genome will serve as an alternative reference for future genomic studies on the East Asian population.


Conflict of interest statement

The authors declare no competing interests.

Figures

Fig. 1
Fig. 1. Haplotype-resolved assembly of CN1 diploid genome.
ad The contig NG50, scaffold NG50, phase NG50, and QV of GRCh38, HG002, CN1, and CHM13. e Whole-genome distribution of the heterozygosity rate (h). The heterozygosity rate is calculated as the SV count in each 500 kb window. f Visualization of the heterozygous regions between two haplotypes using bubbles. Here, h = 2 was set as the threshold for displaying bubbles. The homozygous regions are shown as single paths (grey), and the heterozygous regions at each heterozygosity rate are marked as bubbles. Regions with different h are shown in different shades. Centromeres (black lines) carry much higher h than other regions. The insert plot shows the structural variations in the centromere of chr1. αSat and HSat2 are the most divergent (window = 50 kb, step = 10 kb). An inversion, covering βSat and γSat, is shown between the paternal and maternal genomes (light yellow).
Fig. 2
Fig. 2. Variations in the peri/centromeric regions among the CN1.mat, CN1.pat and CHM13.
a Heatmap shows the length differences of each component of the pericentromeric region of the chromosomes between the two haploid genomes of CN1 and CHM13. “+” indicates presence in CN1 haploid genome but absence in CHM13; “−” indicates absence in CN1 haploid but presence in CHM13. The top bar plot shows each satellite’s length in CN1. NA means that the satellite is absent in both CN1 and CHM13. b Composition of the active HOR in the three haploids of chr17. The canonical 16-mer S3C17H1L.1-16 is the dominant HOR in CHM13, while two novel HORs, S3C17H1L.1-13_15#_15-16 and S3C17H1L.1-10_15#_15-16, are the dominant forms in CN1. Each color box represents one HOR SV. The DNA methylation level (ranging from 0 to 1) is plotted with the line along each active HOR, and the identified CDRs are delineated by boxes. c Clustering the monomer consensus sequences of the active HOR in the three haploids of chr17 according to the monomer consensus sequence alignment. The novel monomer S3C17H1L.15# clusters with the canonical S3C17H1L.1.15, with substantial sequence divergence. Shade indicates the p-distance between every two monomer consensus sequences. d Composition of the active HOR in the three haploids of chr21. The canonical 16-mer S2C13/21H1L.1-16 dominates CHM13 and CN1 paternal chr21, while the novel 10-mer HOR S2C13/21H1L.1-5_1#-2_9-11 is dominant in the CN1 maternal chr21. The DNA methylation level (ranging from 0 to 1) is plotted along each active HOR, and the identified CDRs are delineated by boxes. Color boxes represent HOR SVs. e Clustering of monomer consensus sequences of the active HOR in the three haploids of chr21 according to the monomer consensus sequence alignment. Shade indicates the p-distance between every two monomer consensus sequences.
Fig. 3
Fig. 3. SVs between CN1 and CHM13.
a Comparison of SVs between CN1 and CHM13 based on HGSVC and HPRC databases. b Repeat annotation of novel SVs, top 10 for plot. c Copy number of rDNA models across three haploid genomes, CN1.mat, CN1.pat, and CHM13. d Illustration of chr13 rDNA model in CN1, HG002, and HG005. CHM13 chr13 rDNA model is shown on the top, and the ONT read alignments in the different haploids/individuals are shown below. Compared to the CHM13 reference, the CN1.mat chr13 rDNA model has one 4.4 kb deletion in LR, and the CN1.pat chr13 rDNA model has an additional 1 kb deletion in LR. In HG002 and HG005, only a few copies of rDNA array contain the 1.1 kb deletion in LR. Each row represents a read alignment, with insertions shown as purple triangles and deletions shown as dark lines. e Comparison of CN1-Y and HG002-Y. The dot plot on the left shows the overall synteny between the two Y chromosomes, with a large inversion in the last ampliconic region. The middle barplot shows the size comparison for the different subregions on the two Y chromosomes. The major size differences are found in centromere, DYZ19, and heterochromatin. The synteny plot on the right shows the largest inversion on Y in one arm of palindrome P1 in the last ampliconic region. P1, P2 and P3 indicate palindromes 1, 2 and 3, respectively. f Venn diagram shows the syntenic and non-syntenic SDs (except chrY) of CN1 (blue) and CHM13 (orange). g Syntenic comparison of ZDHHC11 and its flanking region between CN1 and CHM13 genomes. The copy number of ZDHHC11 is expanded in CN1. h Global map shows the distribution of ZDHHC11 copy number across 317 human samples from the Simons Genome Diversity Project (SGDP). Color indicates the ZDHHC11 copy number and the size of the circles indicates the individual number examined in each super-population. There are two and six copies of ZDHHC11 in CN1 and CHM13, respectively.
Fig. 4
Fig. 4. A CN1 accelerated region is under positive selection in Asian Population.
a Alignment of chr3:57,237,838–57,237,868 sequences of CN1, chimpanzee and the haplotypes from different super-populations. Dots indicate identical base alignment. b Fst (EAS vs EUR and EAS vs AFR) scores around CN1 chr3:57,237,838–57,237,868 (red line) and its flanking region (window = 10 kb, step size = 2 kb). Blue dashed lines indicate the Fst cutoff with P < 0.05. c Global map shows the distribution of CN1 and CHM13/HG01891 haplotype frequency in 75 populations. The color and size of the circles represent the haplotype and the number of haplotypes, respectively. African, American, East Asian, European, Middle Eastern, Oceanian, and South Asian are denoted as AFR, AMR, EAS, EUR, MEA, OCE, and SAS, respectively. d Haplotype network of CN1 chr3:57,237,838–57,237,868. Most CN1-type haplotypes are found in EAS, while most CHM13/HG01891-type haplotypes are found in AFR. The color and size of the circles represent the super-population and the number of haplotypes, respectively.
Fig. 5
Fig. 5. Reference bias using CN1 and CHM13 genomes for population genomic analyses.
a The mapping statistics (left, unique mapping rate; right, unique clipping read rate) and their Pearson’s correlation with the difference in genetic distance (Fst) between the targeted population and the Southern Chinese (CHS) and Northern and Western European (CEU). Both graphs are plotted using n = 80 populations. b The performance of SNP calling in two benchmark samples from GIAB, a European individual (HG002) and an East Asian individual (HG005), using CN1 or CHM13 as a reference. Recall rates are displayed on a truncated y-axis. c Venn diagram shows the comparison of heterozygous SNVs called on CN1 and CHM13 genomes using ~30× HG005 sequencing data. Reference-dependent unique SNVs were compared with the GIAB benchmarked truth set, and classified as the true positives (TPs) and the false positives (FPs). TargetDup SNVs, caused by CNVs between the two references, are the major source of reference-dependent SNVs and introduce more FPs and comparable TPs in CHM13 than in CN1. d Venn diagram shows the comparison of bi-SNPs called from the 8869 Chinese cohort on CN1 and CHM13. e The alternative allele frequency distribution of bi-SNPs from 8869 Chinese genomes called on both CN1 and CHM13 genomes (upper). The alternative allele frequency distribution of the unique SNPs called on either CN1 or CHM13 genome (lower). f Heatmap shows the MAF of SNPs called on CN1 and CHM13. Most SNPs exhibit similar MAF in both references, while a few show distinct MAF between the two references (rare with CN1 but common with CHM13, and vice versa). More CN1 rare SNPs (upper left) are found than CHM13 rare SNPs (lower right). g Density distribution of mapping quality and variant quality of “Both rare” (rare SNPs called with both CHM13 and CN1), “CN1 rare” (rare with CN1 but common with CHM13), and “CHM13 rare” (rare with CHM13 but common with CN1) SNPs.
Fig. 6
Fig. 6. A pIR from archaic genomes in the East Asian population identified using CN1 as a reference.
a Distribution of modified D-statistics fd values along chromosome 1 in ABBA-BABA test. Four comparisons were set in topology ((P1, P2), P3, Outgroup), where outgroup was Chimpanzee, P1 was Bantu Kenya, P2 was Han (EAS) or French (EUR), and P3 was Neanderthal or Denisovan genome. Three reference genomes were used, and the window coordinates in CHM13 and GRCh38 were converted into those in CN1 by LiftOver. The interval between the two vertical lines highlights the pIR in Han. The red horizontal line represents the empirical cutoff (fd = 0.35). b Local synteny between CN1 and CHM13. Red vertical lines indicate the genomic positions of the annotated genes in CN1. SMRs for Neanderthal and Denisovan are marked in red and blue, respectively. c Expression profiling of four newly annotated genes (red) and flanking genes located in the pIR in CN1. d Mapping depths of different modern human population genomes onto CN1. Each of the depth tracks ranges from zero to the whole-genome depth, respectively. e Global distribution of CN1-like haplotype frequency in 75 populations.

References

    1. Popejoy AB, Fullerton SM. Genomics is failing on diversity. Nature. 2016;538:161–164. doi: 10.1038/538161a. - DOI - PMC - PubMed
    1. Sirugo G, Williams SM, Tishkoff SA. The missing diversity in human genetic studies. Cell. 2019;177:26–31. doi: 10.1016/j.cell.2019.02.048. - DOI - PMC - PubMed
    1. Martin AR, et al. Clinical use of current polygenic risk scores may exacerbate health disparities. Nat. Genet. 2019;51:584–591. doi: 10.1038/s41588-019-0379-x. - DOI - PMC - PubMed
    1. Duncan L, et al. Analysis of polygenic risk score usage and performance in diverse human populations. Nat. Commun. 2019;10:3328. doi: 10.1038/s41467-019-11112-0. - DOI - PMC - PubMed
    1. Ballouz S, Dobin A, Gillis JA. Is it time to change the reference genome? Genome Biol. 2019;20:159. doi: 10.1186/s13059-019-1774-4. - DOI - PMC - PubMed

Publication types

Supplementary concepts