. 2023 Sep;37(9):1868-1878.
doi: 10.1038/s41375-023-01966-1. Epub 2023 Jul 14.

Culture expansion of CAR T cells results in aberrant DNA methylation that is associated with adverse clinical outcome

Affiliations

Culture expansion of CAR T cells results in aberrant DNA methylation that is associated with adverse clinical outcome

Lucia Salz et al. Leukemia. 2023 Sep.

Abstract

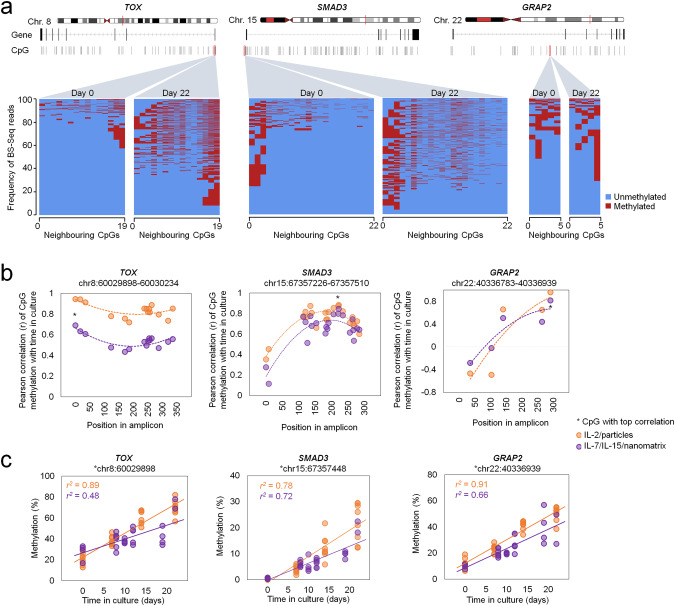
Chimeric antigen receptor (CAR) T cells provide new perspectives for treatment of hematological malignancies. Manufacturing of these cellular products includes culture expansion procedures, which may affect cellular integrity and therapeutic outcome. In this study, we investigated culture-associated epigenetic changes in CAR T cells and found continuous gain of DNAm, particularly within genes that are relevant for T cell function. Hypermethylation in many genes, such as TCF7, RUNX1, and TOX, was reflected by transcriptional downregulation. 332 CG dinucleotides (CpGs) showed an almost linear gain in methylation with cell culture time, albeit neighboring CpGs were not coherently regulated on the same DNA strands. An epigenetic signature based on 14 of these culture-associated CpGs predicted cell culture time across various culture conditions. Notably, even in CAR T cell products of similar culture time higher DNAm levels at these CpGs were associated with significantly reduced long-term survival post transfusion. Our data demonstrate that cell culture expansion of CAR T cells evokes DNA hypermethylation at specific sites in the genome and the signature may also reflect loss of potential in CAR T cell products. Hence, reduced cultivation periods are beneficial to avoid dysfunctional methylation programs that seem to be associated with worse therapeutic outcome.


Conflict of interest statement

The medical faculty of RWTH Aachen and Miltenyi Biotec have submitted a patent application on the epigenetic signatures described in this manuscript. LS is involved in Meneldor B.V. (https://meneldor.nl), an investment fund with focus on biotech and pharma. DS, TH, IB and OH are employees of Miltenyi Biotec B.V. & Co. K.G. JF is involved in Pryzen UG (https://pryzen.de). ME is a consultant to Ferrer and Quimatryx. WW is involved in Cygenia GmbH (www.cygenia.com) that may provide services for epigenetic analyses. Apart from this, the authors do not have a conflict of interest.

Figures

Fig. 1
Fig. 1. CAR T cells accumulate DNA methylation changes during culture expansion.
a Different culture conditions for expansion of untransduced T cells (UT) and CAR T cells for up to 22 days. b Growth curves of UT and CAR T cells during small scale in vitro expansion. Arrows indicate (re-)stimulation of T cells with particles. c Principal component analysis (PCA) of DNA methylation profiles. The arrows indicate trajectories with culture time (shades of blue) for the different culture conditions. d Volcano plot showing differentially methylated CpG sites (hypermethylated in red, hypomethylated in blue) in d0 (UT) versus d22 samples (UT and CAR). e Bubble plots of the top-10 Gene Ontology (GO) terms for significantly hyper- and hypomethylated CpGs after 22 days of culture expansion (Gene ratio = differentially methylated/total number genes in this pathway; bubble size = absolute number of genes in the set; color code depicts significance level). f The scatter plots compare mean methylation changes (mean Δß-value) during in vitro expansion in T cells (UT and CAR; d0 versus d22) as compared to culture of hematopoietic stem and progenitor cells (HSPCs), human umbilical vein endothelial cells (HUVECs), or mesenchymal stromal cells (MSCs), respectively. The percentages of CpG sites with more than 10% mean DNAm change are highlighted (red = hypermethylated in both cell types; blue = hypomethylated in both cell types; black = divergently methylated; r = Pearson correlation coefficient). Here, all CpGs that were shared between the 450 K and EPIC platform are depicted.
Fig. 2
Fig. 2. Culture expansion of T cells leads to down-regulation of relevant genes for T cell function.
a Mean average (MA) plot of RNA-Seq data illustrating differentially expressed genes in T cells after 22 days of culture expansion (adjusted p < 0.05, n = 4). b Correlation of gene expression changes with DNA methylation changes during culture expansion (day 0 versus day 22) for CpGs that are localized on promoter regions (left) or in the gene body (right) of the corresponding genes. If multiple CpGs occurred in these regions the mean DNAm was calculated to provide a single dot per gene. c Gene Ontology classification of differential gene expression upon expansion of T cells shown as bubble plots of the top 30 GO-terms ranked by gene ratio for significantly up- and down-regulated genes in T cells after 22 days of culture expansion. For the down-regulated genes four categories are highlighted in red, which revealed also highest enrichment for hypermethylated CpGs (illustrated in Fig. 1e). d Heatmap of gene expression levels (indicated as log counts per million; logCPM) of genes that are significantly down-regulated during long-term culture and within these four Gene Ontology categories.
Fig. 3
Fig. 3. Neighboring CpGs stochastically gain methylation during culture expansion.
a Culture-associated DNA methylation (DNAm) patterns were analyzed in genomic regions of three genes (TOX, SMAD3, and GRAP2) with bisulfite amplicon sequencing (BS-Seq). The heatmaps represent the sequel of methylated and non-methylated sites within individual reads of the three amplicons, respectively. Results are exemplarily depicted for one sample at day 0 and day 22. b Pearson correlation of DNAm at neighbouring CpG sites within the amplicons of TOX, SMAD3, and GRAP2 for T cells expanded with two culture conditions (orange: IL2/particles, n = 8; purple: IL-7/IL15/nanomatrix, n = 5). The position of CpG sites within the amplicons are depicted (asterisk marks CpG with highest Pearson correlation). c The linear correlation of DNAm with culture time is exemplarily depicted for those CpGs with highest correlation.
Fig. 4
Fig. 4. Epigenetic predictions for time in culture expansion of CAR T cells.
a Heat map showing DNA methylation (DNAm) levels of the 332 CpGs with almost linear gain (Pearson correlation r > 0.9; 336 CpGs) or loss of methylation (r < −0.9; 3 CpGs) with time in culture for different T cell preparations in the training set and an independent validation set. DNAm levels (β-values) are indicated by the color code. b Epigenetic predictions based on 35 CpGs (elastic-net) correlate with time in culture for the training (r2 = 0.99; n = 15) and the validation dataset (r2 = 0.90; n = 13). c The 35 CpG epigenetic predictor for time in culture was subsequently applied on DNAm profiles of three clinical studies: NCT02772198 (n = 43), NCT03144583 (n = 45) and NCT03373071 (n = 26). The interleukins supplemented during expansion and the real time of culture (shaded areas) are indicated. d The DNAm profiles of these three studies were subsequently stratified into those with or without later occurrence of cytokine release syndrome (CRS) or immune effector cell-associated neurotoxicity syndrome (ICANS). The box plot indicates predicted time in culture (interquartile range (IQR) and whiskers denote the 1.5 × IQR; p calculated with Student’s t-test). e The association of DNA methylation levels in individual culture-associated CpGs of CAR T cells was tested with overall survival post transplantation. The scatter plot depicts hazard ratios (HR per 10% DNAm difference) and p-values for the 332 culture-associated CpGs (adjusted for disease and clinical trial; not adjusted for multiple testing of 332 CpGs) in the testing dataset of three clinical trials (GSE179414; n = 114). Yellow dots demarcate the 35 CpGs of the elastic-net predictor for time in culture.
Fig. 5
Fig. 5. Culture-associated DNA methylation changes in CAR T cells are indicative for therapeutic outcome.
a The association of cultivation-time-associated DNA methylation (DNAm) changes with overall survival was tested in a target identification cohort comprising three clinical trials (subset of GSE179414; n = 82). Multivariate Cox regression analysis revealed that 14 CpG sites out of the 332 CpGs with highest correlation with culture time were associated with overall survival (hazard ratios adjusted for disease and clinical trial (Adj. HR); not adjusted for multiple testing of 332 CpGs). b For these 14 CpGs, association with overall survival was further tested for the target identification cohort (orange; n = 82) and the target validation cohort (turquoise; n = 32). Hazard ratios (adjusted for disease and clinical trial) and confidence intervals (CI) are depicted (*p < 0.01). c A multivariable epigenetic predictor for culture time based on the 14 CpGs was subsequently trained (r2 = 0.94; n = 15) and validated (r2 = 0.70; n = 13) in independent datasets (as depicted in Fig. 4a). d Cox proportional hazards model (adjusted for disease and clinical trial) for the epigenetic predictions of time in culture based on the 14 CpGs. Longer predicted time in culture of CAR T cells was at higher risk for death (*p-value < 0.01; ***p < 0.0001). e. Kaplan–Meier estimates of overall survival for the target identification (n = 82) and validation cohorts (n = 32). Subgroups were divided into low and high estimates of culture-associated DNAm based on the 14 CpG predictor. f Box plot showing the comparison of predicted time in culture between patient cohorts without/with cytokine release syndrome (CRS) or immune effector cell-associated neurotoxicity syndrome (ICANS). Boxes indicate the interquartile range (IQR) and whiskers denote the 1.5 × IQR (*p < 0.01).

References

    1. Elsallab M, Levine BL, Wayne AS, Abou-El-Enein M. CAR T-cell product performance in haematological malignancies before and after marketing authorisation. Lancet Oncol. 2020;21:e104–e16. doi: 10.1016/S1470-2045(19)30729-6. - DOI - PMC - PubMed
    1. Kersten MJ, Spanjaart AM, Thieblemont C. CD19-directed CAR T-cell therapy in B-cell NHL. Curr Opin Oncol. 2020;32:408–17. doi: 10.1097/CCO.0000000000000668. - DOI - PubMed
    1. Maude SL, Laetsch TW, Buechner J, Rives S, Boyer M, Bittencourt H, et al. Tisagenlecleucel in Children and Young Adults with B-Cell Lymphoblastic Leukemia. N Engl J Med. 2018;378:439–48.. doi: 10.1056/NEJMoa1709866. - DOI - PMC - PubMed
    1. Ferrer G, Álvarez-Errico D, Esteller M. Biological and Molecular Factors Predicting Response to Adoptive Cell Therapies in Cancer. JNCI: J Natl Cancer Inst. 2022;114:930–9. doi: 10.1093/jnci/djac088. - DOI - PMC - PubMed
    1. Greenberg MVC, Bourc'his D. The diverse roles of DNA methylation in mammalian development and disease. Nat Rev Mol Cell Biol. 2019;20:590–607. doi: 10.1038/s41580-019-0159-6. - DOI - PubMed

Publication types