. 2023 Jul 14;11(1):150.
doi: 10.1186/s40168-023-01593-z.

Neotropical bee microbiomes point to a fragmented social core and strong species-level effects

Affiliations

Neotropical bee microbiomes point to a fragmented social core and strong species-level effects

Jordan G Kueneman et al. Microbiome. .

Abstract

Background: Individuals that band together create new ecological opportunities for microorganisms. In vertical transmission, theory predicts a conserved microbiota within lineages, especially social bees. Bees exhibit solitary to social behavior among and/or within species, while life cycles can be annual or perennial. Bee nests may be used over generations or only once, and foraging ecology varies widely. To assess which traits are associated with bee microbiomes, we analyzed microbial diversity within solitary and social bees of Apidae, Colletidae, and Halictidae, three bee families in Panama's tropical forests. Our analysis considered the microbiome of adult gut contents replicated through time, localities, and seasons (wet and dry) and included bee morphology and comparison to abdominal (dissected) microbiota. Diversity and distribution of tropical bee microbes (TBM) within the corbiculate bee clade were emphasized.

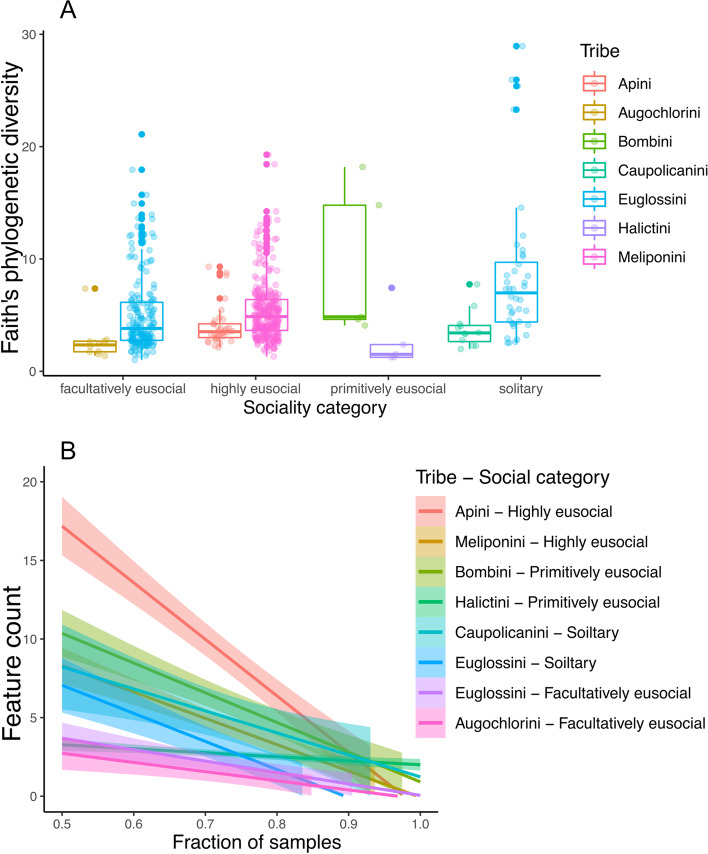
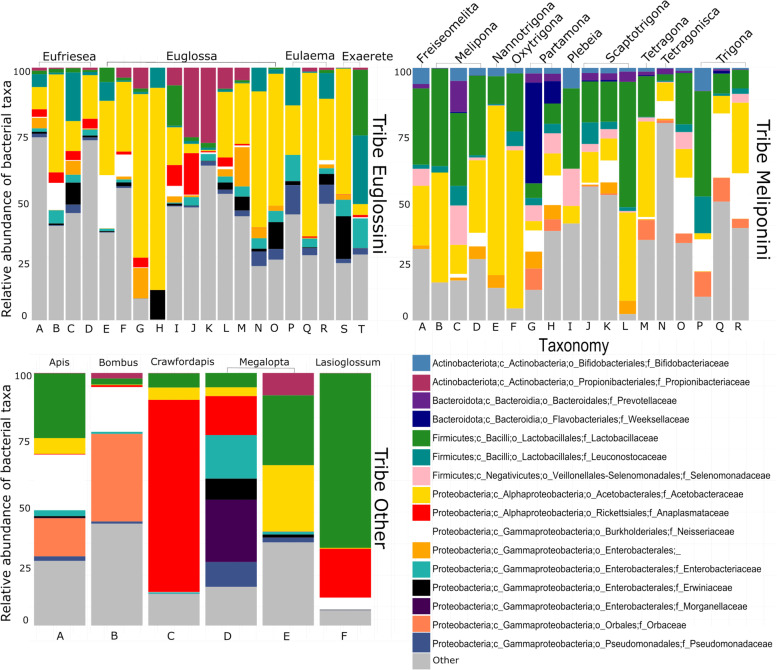
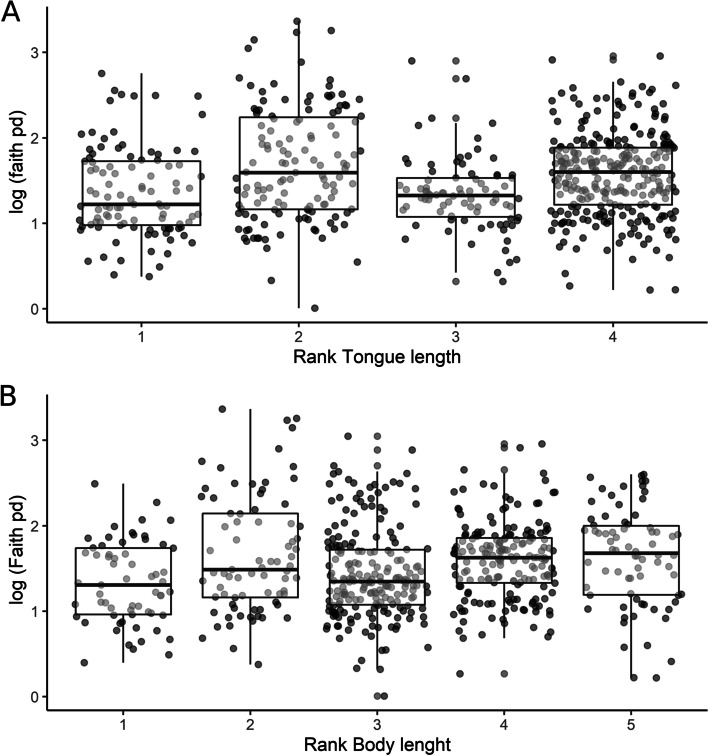
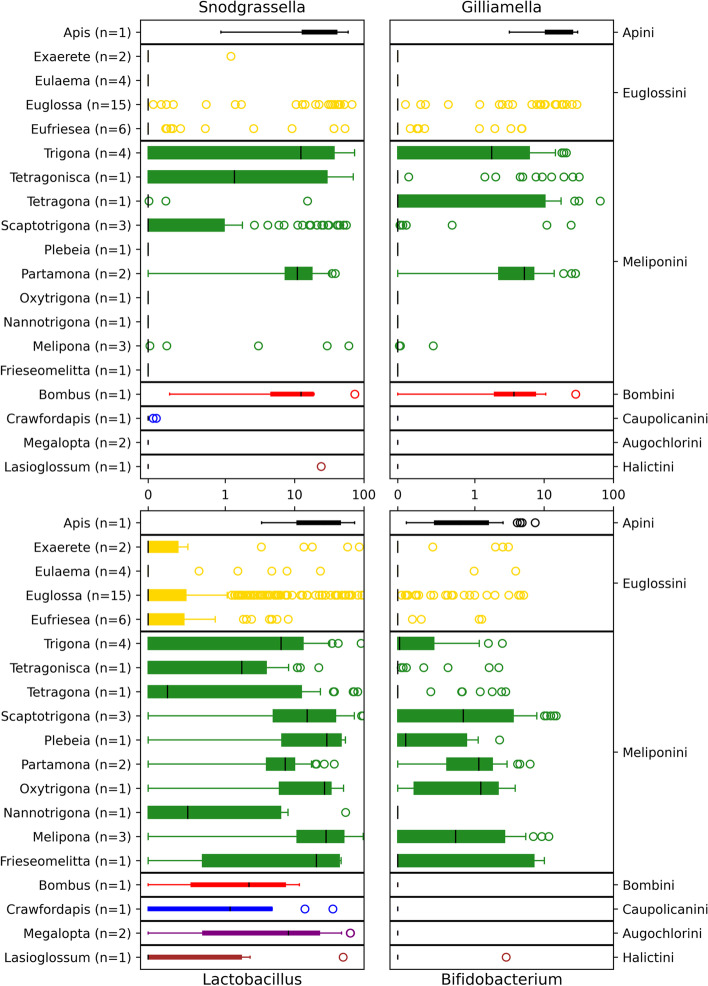
Results: We found the eusocial corbiculate bees tended to possess a more conserved gut microbiome, attributable to vertical transmission, but microbial composition varied among closely related species. Euglossine bees (or orchid bees), corbiculates with mainly solitary behavior, had more variable gut microbiomes. Their shorter-tongued and highly seasonal species displayed greater diversity, attributable to flower-visiting habits. Surprisingly, many stingless bees, the oldest corbiculate clade, lacked bacterial genera thought to predate eusociality, while several facultatively social, and solitary bee species possessed those bacterial taxa. Indeed, nearly all bee species displayed a range of affinities for single or multiple variants of the "socially associated" bacterial taxa, which unexpectedly demonstrated high sequence variation.

Conclusions: Taken together, these results call into question whether specific bacterial associates facilitate eusocial behavior, or are subsequently adopted, or indicate frequent horizontal transmission between perennial eusocial colonies and other social, facultatively social, and solitary bees. Video Abstract.


Conflict of interest statement

The authors declare no competing interests.

Figures

Fig. 1
Fig. 1
A Map of land cover in Panama displaying 10 locations sampled from 2018 to 2019. Site numbers (1–10) correspond to samples described in Supplemental metadata (tropical moist forest (1–3), tropical wet forest (4), premontane wet forest (5 and 7), tropical dry forest (6, 8, and 9), premontane rain forest (10), as described in [33]). B The phylogenetic relationships of bee tribes included in the study (following [34])
Fig. 2
Fig. 2
A Faith’s phylogenetic diversity of bee samples arranged by social category and colored by bee tribe. The overall statistical difference between social categories is χ2=8.54, df = 3, p = 0.036. B The core feature counts by the fraction of samples. Linear regressions show 95% confidence intervals (above zero) colored by tribe and social category
Fig. 3
Fig. 3
The proportional abundance of ASVs in the microbiome of diverse bees collected across locations in Panama. Proportional abundances are arranged in three groups, tribe Euglossini (N=20), tribe Meliponini (N=18), and tribe Other (N=6). Taxonomy is arranged in descending relative abundance within the respective panels. Panel 1 Tribe Euglossini is arranged as follows: (A) Eufriesea pulchra, (B) Eufriesea rufocauda, (C) Eufriesea anisochlora, (D) Eufriesea chrysopyga, (E) Eulaema meriana, (F) Eulaema nigrita, (G) Eulaema bombiformis, (H) Euglossa cognata, (I) Euglossa championi, (J) Euglossa sapphirina, (K) Euglossa tridentata, (L) Euglossa asarophora, (M) Euglossa bursigera, (N) Euglossa imperialis, (O) Euglossa mixta, (P) Euglossa crassipunctata, (Q) Euglossa deceptrix, (R) Euglossa dodsoni, (S) Exaerete frontalis, (T) Exaerete smaragdina. Panel 2 Tribe Meliponini is arranged as follows: (A) Frieseomelitta nigra, (B) Melipona phenax, (C) Melipona triplaridis, (D) Melipona panamica, (E) Nannotrigona perilampoides, (F) Oxytrigona mellicolor, (G) Partamona peckolti, (H) Partamona musarum, (I) Plebeia frontalis, (J) Scaptotrigona panamensis, (K) Scaptotrigona barrocoloradensis, (L) Scaptotrigona luteipennis, (M) Tetragona ziegleri, (N) Tetragonisca angustula, (O) Trigona fulviventris, (P) Trigona almathea, (Q) Trigona ferricauda, (R) Trigona corvina. Panel 3 Tribe Other is arranged as follows: (A) Apis mellifera, (B) Bombus volucelloides, (C) Crawfordapis lutcuosa, (D) Megalopta amoena, (E) Megalopta genalis, (F) Lasioglossum umbripenne
Fig. 4
Fig. 4
A comparison of the microbiome of bee species sampled from the same location, during the dry season and wet season (excluding transitional months). The magnitude and direction of effect sizes vary across the bee species studied. Four panels show the mean effect sizes (Hedge’s G—bias-corrected standardized mean difference) across 10 studied species for alpha diversity (ASV Richness, Faith’s Phylogenetic Diversity, Shannon, and Evenness). Negative (red) values indicate a reduction in the dry season, while positive values (blue) indicate an increase in the dry season. Point size is scaled by sample size. Overall standard mean difference (SMD) and random effect model p-values are provided for each metric. Vertical color bars indicate bee tribes (Tribe Meliponini (N=7; green), Tribe Euglossini (N=2; yellow), and Apini (N=1; black)
Fig. 5
Fig. 5
Bee morphometric data for all bee samples relative to microbiome diversity. Tongue length is the trait that best predicts microbial richness among bees. A Faith’s phylogenetic diversity arranged by rank tongue length (1 is the longest and 4 is the shortest), showing significant differences across subcategories. B Faith’s phylogenetic diversity of bee species arranged by body length (1 is the longest and 5 is the shortest), showing significant differences across subcategories
Fig. 6
Fig. 6
Plots the CCGM and their distributions (percent relative abundance per sample) for all bee genera. The number of species included in each bee genus is reported. Boxplots are color-coded by bee tribes

References

    1. Szathmáry E, Smith JM. The major evolutionary transitions. Nature. 1995;374:227–232. doi: 10.1038/374227a0. - DOI - PubMed
    1. Wcislo WT. The roles of seasonality, host synchrony, and behaviour in the evolutions and distributions of nest parasites in Hymenoptera (Insecta), with special reference to bees (Apoidea) Biol Rev. 1987;62:515–543. doi: 10.1111/j.1469-185X.1987.tb01640.x. - DOI
    1. Roubik DW. Ecology and social organisation of bees. Encyclopedia of Life Sciences. 2012. 10.1002/9780470015902.a0023596.
    1. Hamilton WD. Kinship, recognition, disease, and intelligence: constraints of social evolution. 1987.
    1. Koch H, Abrol DP, Li J, Schmid-Hempel P. Diversity and evolutionary patterns of bacterial gut associates of corbiculate bees. Mol Ecol. 2013;22:2028–2044. doi: 10.1111/mec.12209. - DOI - PubMed

Publication types

LinkOut - more resources