. 2023 Oct 4;31(10):3034-3051.
doi: 10.1016/j.ymthe.2023.07.008. Epub 2023 Jul 14.

Targeting RNA oxidation by ISG20-mediated degradation is a potential therapeutic strategy for acute kidney injury

Affiliations

Targeting RNA oxidation by ISG20-mediated degradation is a potential therapeutic strategy for acute kidney injury

Meng Jia et al. Mol Ther. .

Abstract

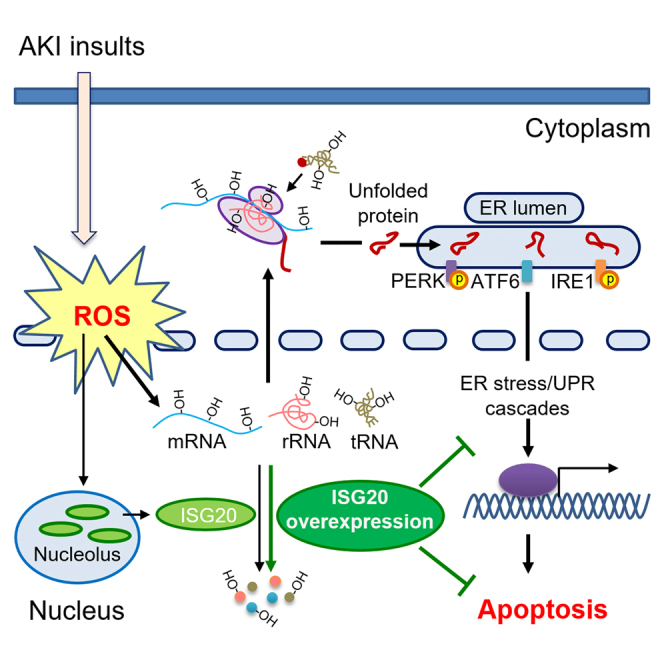
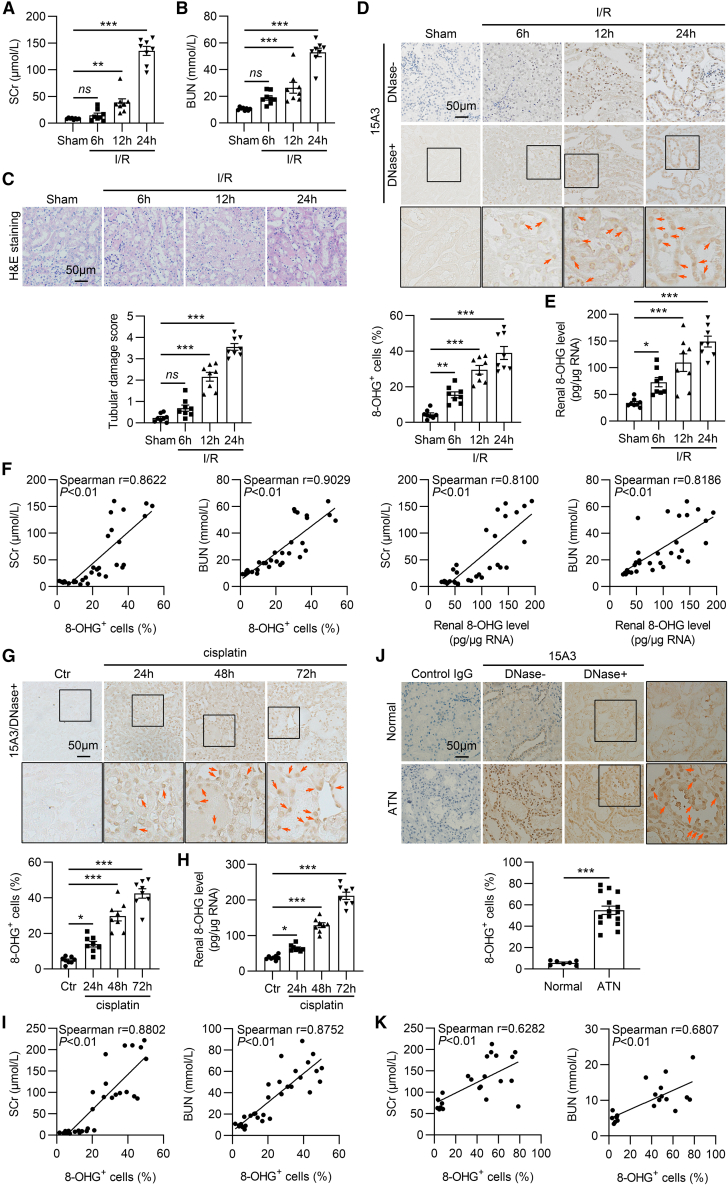
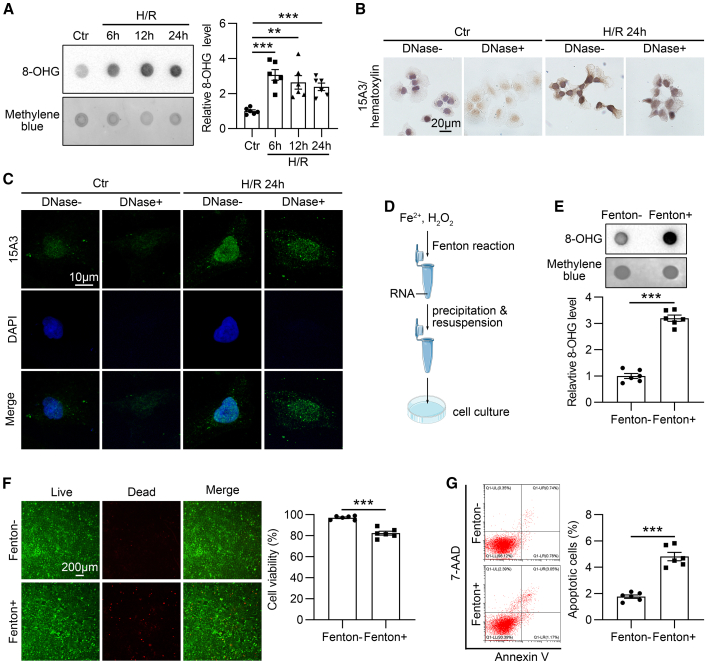
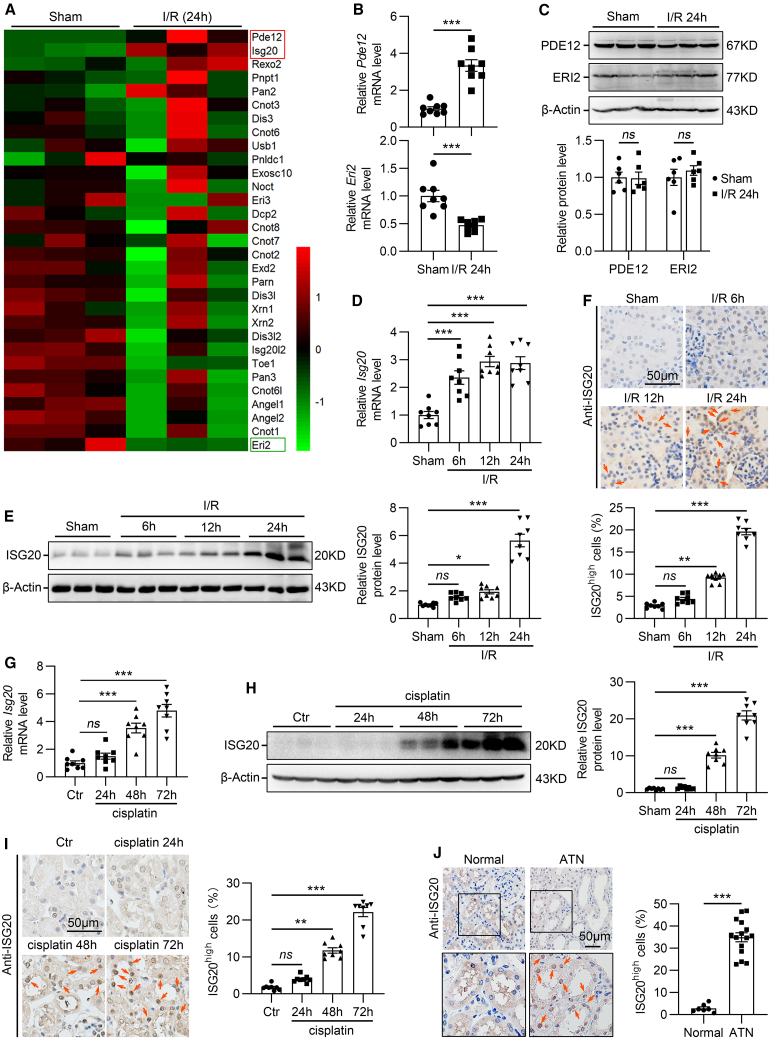
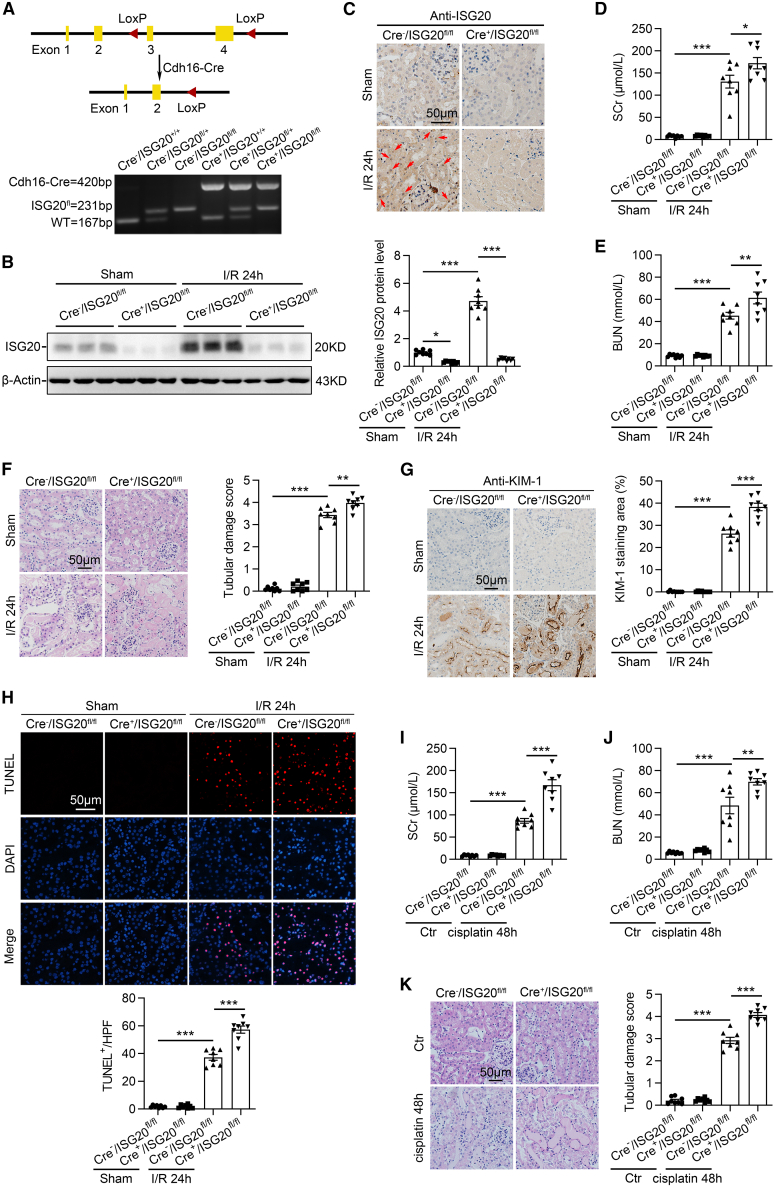
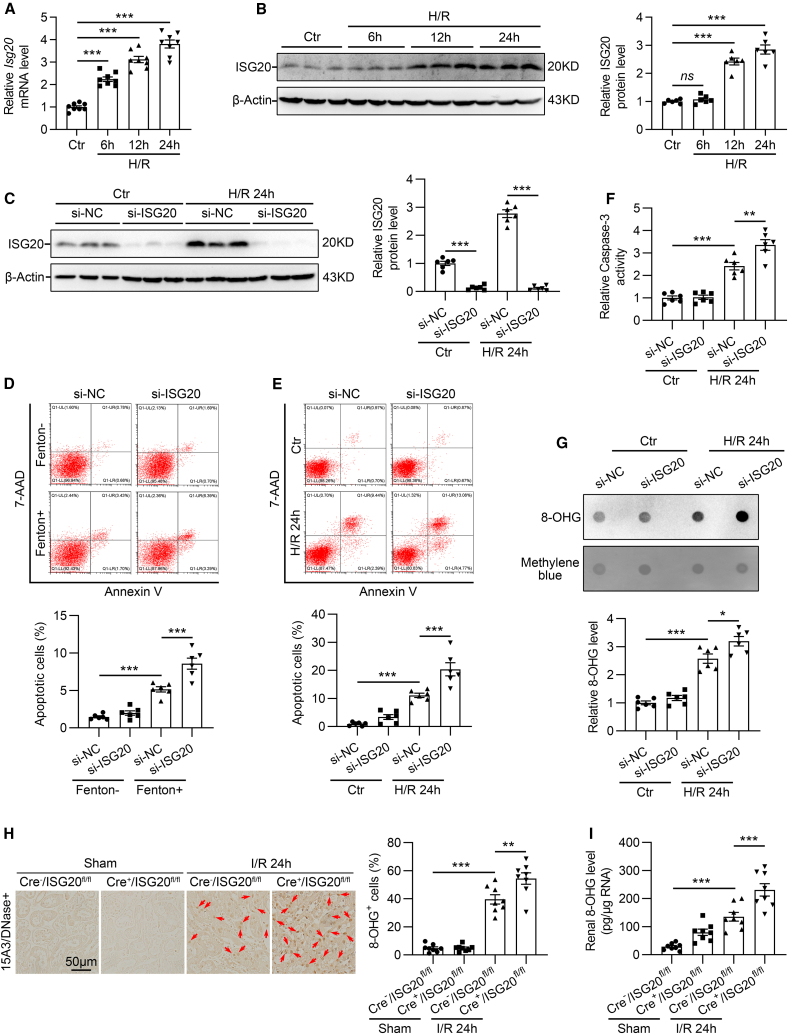
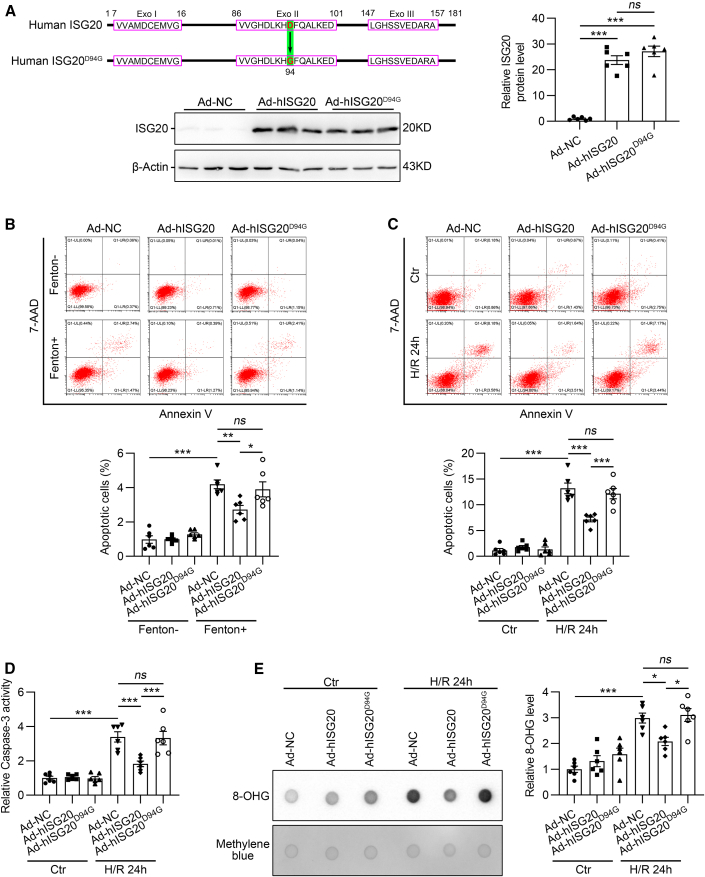
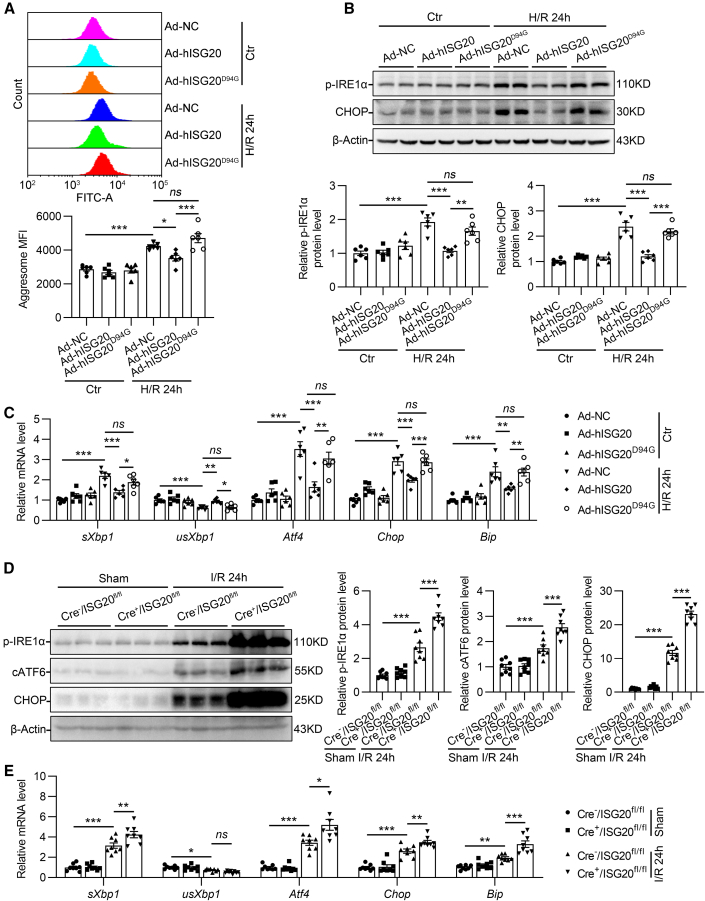
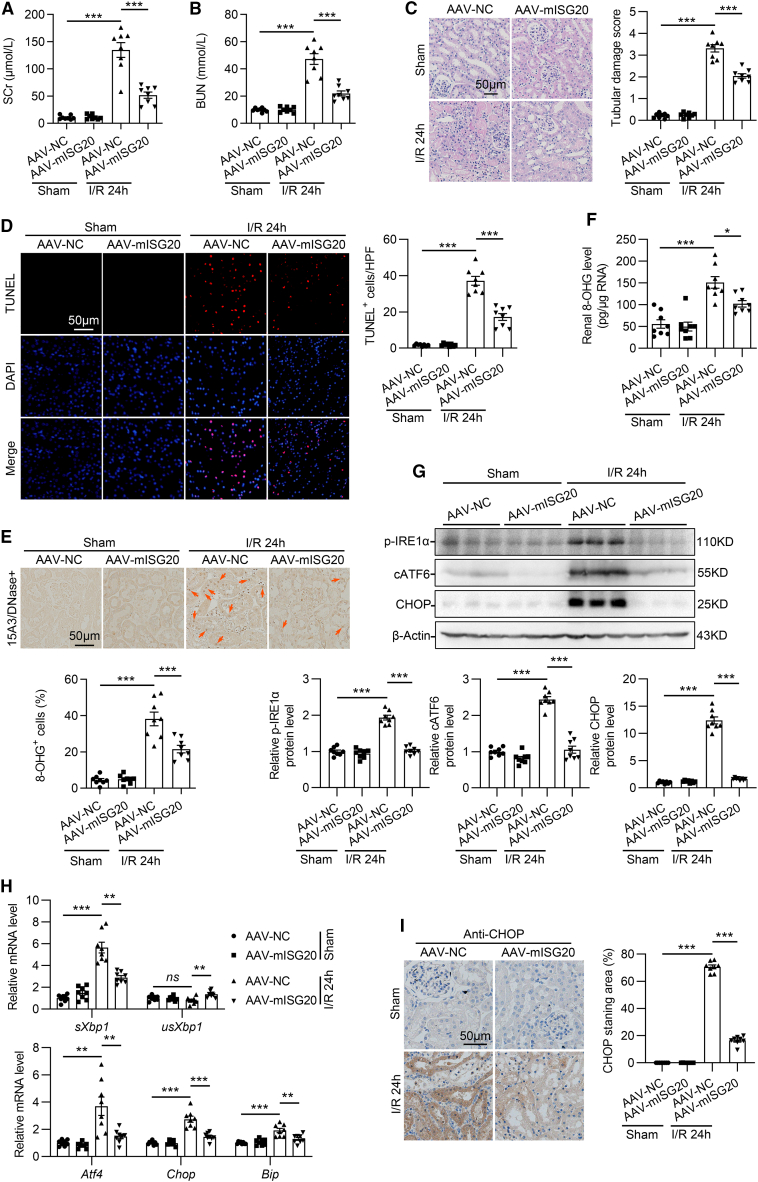
Oxidative stress plays a central role in the pathophysiology of acute kidney injury (AKI). Although RNA is one of the most vulnerable cell components to oxidative damage, it is unclear whether RNA oxidation is involved in the pathogenesis of AKI. In this study, we found that the level of RNA oxidation was significantly enhanced in kidneys of patients with acute tubular necrosis (ATN) and in the renal tubular epithelial cells (TECs) of mice with AKI, and oxidized RNA overload resulted in TEC injury. We further identified interferon-stimulated gene 20 (ISG20) as a novel regulator of RNA oxidation in AKI. Tubule-specific deficiency of ISG20 significantly aggravated renal injury and RNA oxidation in the ischemia/reperfusion-induced AKI mouse model and ISG20 restricted RNA oxidation in an exoribonuclease activity-dependent manner. Importantly, overexpression of ISG20 protected against oxidized RNA overproduction and renal ischemia/reperfusion injury in mice and ameliorated subsequent protein aggresome accumulation, endoplasmic reticulum stress, and unfolded protein response. Thus, our findings provide direct evidence that RNA oxidation contributes to the pathogenesis of AKI and that ISG20 importantly participates in the degradation of oxidized RNA, suggesting that targeting ISG20-handled RNA oxidation may be an innovative therapeutic strategy for AKI.

Keywords: ISG20; RNA oxidation; acute kidney injury; endoplasmic reticulum stress; unfolded protein response.


Conflict of interest statement

Declaration of interests The authors declare no competing interests.

Figures

None
Graphical abstract
Figure 1
Figure 1
RNA oxidation was significantly upregulated in the kidneys of mice and patients with AKI (A) Serum creatinine (SCr) levels of mice after renal ischemia/reperfusion (n = 8). (B) Blood urea nitrogen (BUN) levels of mice after renal ischemia/reperfusion (n = 8). (C) Representative photomicrographs of hematoxylin and eosin (H&E) staining and quantitative assessment of tubular damage in kidneys from mice after renal ischemia/reperfusion (n = 8). (D) Representative photomicrographs of 15A3 antibody immunohistochemical staining of kidney sections with or without DNase treatment and quantification of 8-OHG-positive (8-OHG+) cells in kidney sections with DNase treatment to assess RNA oxidation in renal cells (n = 8). Red arrows indicate representative 8-OHG+ cells. (E) Renal 8-OHG levels of mice after renal ischemia/reperfusion (n = 8). (F) Correlation between renal 8-OHG+ cell percentage, renal 8-OHG levels, and SCr and BUN levels in the renal IRI mouse model. (G) Representative photomicrographs of 15A3 antibody immunohistochemical staining of kidney sections with DNase treatment and quantification of 8-OHG+ cells in kidneys from mice after cisplatin treatment (n = 8). Red arrows indicate representative 8-OHG+ cells. (H) Renal 8-OHG levels of mice after cisplatin treatment (n = 8). (I) Correlation between renal 8-OHG+ cell percentage and SCr and BUN levels in the cisplatin-induced AKI mouse model. (J) Representative photomicrographs of 15A3 antibody immunohistochemical staining of kidney sections with or without DNase treatment and quantification of 8-OHG+ cells in kidney sections of normal subjects (n = 7) and patients with acute tubular necrosis (ATN) (n = 15). Human kidneys stained with normal IgG in place of the corresponding primary antibodies were used as negative controls. Red arrows indicate representative 8-OHG+ cells. (K) Correlation between renal 8-OHG+ cell percentage and available SCr and BUN data of normal subjects and ATN patients. Data are represented as the mean ± SEM. ∗p < 0.05, ∗∗p < 0.01, ∗∗∗p < 0.001; ns, not significant. See also Figure S1.
Figure 2
Figure 2
Oxidized RNA overload resulted in renal tubular epithelial cell death (A) Representative RNA dot blot documents and summarized data showing the relative 8-OHG levels of RNA extracts from HK-2 cells with hypoxia/reoxygenation (H/R) treatment (n = 6). Methylene blue staining validated the equal loading amount of RNA. (B) Representative photomicrographs of 15A3 antibody immunocytochemistry staining of HK-2 cells with H/R treatment. (C) Representative photomicrographs of 15A3 antibody immunofluorescence staining of HK-2 cells with H/R treatment. Nuclei were revealed using 4′,6-diamidino-2-phenylindole (DAPI) staining. (D) A schematic diagram showing the procedure of oxidized RNA treatment of HK-2 cells. (E) Representative RNA dot blot documents and summarized data showing the relative 8-OHG levels of RNA extracts from HK-2 cells with oxidized RNA hypotonic treatment (n = 6). (F) Photomicrographs and quantifications showing the viability of HK-2 cells with oxidized RNA hypotonic treatment (n = 6). The green channel depicts live cells, and the red channel depicts compromised/dead cells. (G) Representative flow cytometry analysis and quantitative data depicting the apoptosis of HK-2 cells with oxidized RNA hypotonic treatment (n = 6). Data are represented as the mean ± SEM. ∗∗p < 0.01, ∗∗∗p < 0.001.
Figure 3
Figure 3
ISG20 was upregulated in kidneys from mice and patients with AKI (A) Heatmap of exoribonuclease gene expression levels in the kidneys from Sham and IRI mice by RNA-seq analysis (n = 3). (B) Relative mRNA levels of PDE12 and ERI2 in the kidneys from Sham and IRI mice (n = 8). (C) Representative western blot gel documents and summarized data showing the protein levels of PDE12 and ERI2 in the kidneys from Sham and IRI mice (n = 8). (D) Relative mRNA levels of ISG20 in the kidneys from Sham and IRI mice (n = 8). (E) Representative western blot gel documents and summarized data showing the protein levels of ISG20 in the kidneys from Sham and IRI mice (n = 8). (F) Representative photomicrographs and quantification of ISG20 immunohistochemical staining in the kidneys from Sham and IRI mice (n = 8). Red arrows indicate representative ISG20 highly expressed cells (ISG20high). (G) Relative mRNA levels of ISG20 in the kidneys from cisplatin-treated mice (n = 8). (H) Representative western blot gel documents and summarized data showing the protein levels of ISG20 in the kidneys from cisplatin-treated mice (n = 8). (I) Representative photomicrographs and quantification of ISG20 immunohistochemical staining in the kidneys from cisplatin-treated mice (n = 8). Red arrows indicate representative ISG20high cells. (J) Representative photomicrographs and quantification of ISG20 immunohistochemical staining in the kidneys from normal subjects (n = 7) and patients with ATN (n = 15). Red arrows indicate representative ISG20high cells. Data are represented as the mean ± SEM. ∗p < 0.05, ∗∗p < 0.01, ∗∗∗p < 0.001; ns, not significant. See also Figure S2.
Figure 4
Figure 4
Tubule-specific ISG20 deletion in mice exacerbated renal injury after I/R (A) Experimental scheme for generating tubule-specific ISG20 knockout mice (Cdh16-Cre+/ISG20fl/fl) by using the Cre-loxP recombination system. Genotyping was confirmed by tail preparation and PCR. (B) Representative western blot gel documents and summarized data showing the protein levels of ISG20 in the cortex of kidneys from different groups of IRI model mice (n = 8). (C) Representative photomicrographs of ISG20 immunohistochemical staining in the kidneys from different groups of IRI model mice (n = 8). (D) SCr levels of different groups of IRI model mice (n = 8). (E) BUN levels of different groups of IRI model mice (n = 8). (F) Representative photomicrographs of H&E staining and quantitative assessment of tubular damage in kidneys from different groups of IRI model mice (n = 8). (G) Representative photomicrographs and quantification of KIM-1 immunohistochemical staining in the kidneys from different groups of IRI model mice (n = 8). (H) Representative photomicrographs and quantification of terminal deoxynucleotidyl transferase-mediated uridine triphosphate nick-end labeling (TUNEL) assays of the kidneys from different groups of IRI model mice to assess renal cell death (n = 8). Nuclei were revealed by using DAPI staining. (I) SCr levels of different groups of cisplatin-induced AKI mouse model (n = 8). (J) BUN of different groups of cisplatin-induced AKI model mice (n = 8). (K) Representative photomicrographs of H&E staining and quantitative assessment of tubular damage in kidneys from different groups of cisplatin-induced AKI model mice (n = 8). Data are represented as the mean ± SEM. ∗p < 0.05, ∗∗p < 0.01, ∗∗∗p < 0.001. See also Figure S3.
Figure 5
Figure 5
Silencing or deficiency of ISG20 in renal tubular epithelial cells aggravated RNA oxidation in response to AKI insults (A) Relative mRNA levels of ISG20 in HK-2 cells with H/R treatment (n = 6). (B) Representative western blot gel documents and summarized data showing the protein levels of ISG20 in HK-2 cells with H/R treatment (n = 6). (C) Representative western blot gel documents and summarized data showing the protein levels of ISG20 in si-NC- or si-ISG20-transfected HK-2 cells with or without H/R treatment (n = 6). (D) Representative flow cytometry analysis and quantitative data depicting the apoptosis of si-NC- or si-ISG20-transfected HK-2 cells with oxidized RNA hypotonic treatment (n = 6). (E) Representative flow cytometry analysis and quantitative data depicting the apoptosis of si-NC- or si-ISG20-transfected HK-2 cells with H/R treatment (n = 6). (F) Summarized data showing caspase-3 activity in si-NC- or si-ISG20-transfected HK-2 cells with H/R treatment (n = 6). (G) Representative RNA dot blot documents and summarized data showing the relative 8-OHG levels of RNA extracts from si-NC- or si-ISG20-transfected HK-2 cells with H/R treatment (n = 6). (H) Representative photomicrographs of 15A3 antibody immunohistochemical staining of kidney sections with DNase treatment and quantification of 8-OHG+ cells in kidneys from different groups of IRI model mice (n = 8). Red arrows indicate representative 8-OHG+ cells. (I) Renal 8-OHG levels of different groups of IRI model mice (n = 8). Data are represented as the mean ± SEM. ∗p < 0.05, ∗∗p < 0.01, ∗∗∗p < 0.001; ns, not significant. See also Figures S4 and S5.
Figure 6
Figure 6
A single point mutation in the active site (ISG20D94G) abolished ISG20-mediated oxidized RNA restriction (A) Schematic representation of the three exonuclease active motifs (Exo I, II, and III) of human ISG20 (shown in pink boxes). The Asp94 residue (highlighted in red) of wild-type ISG20 was replaced with Gly to generate the catalytically inactive mutant ISG20D94G (upper left). Representative western blot gel documents (lower) and summarized data (right) showing the protein levels of wild-type human ISG20 and mutant human ISG20D94G in HK-2 cells after adenovirus vector (Ad-NC, Ad-hISG20, or Ad-hISG20D94G) infection (n = 6). (B) Representative flow cytometry analysis and quantitative data depicting the apoptosis of adenovirus vector-infected HK-2 cells with oxidized RNA hypotonic treatment (n = 6). (C) Representative flow cytometry analysis and quantitative data depicting the apoptosis of adenovirus vector-infected HK-2 cells with H/R treatment (n = 6). (D) Summarized data showing caspase-3 activity in adenovirus vector-infected HK-2 cells with H/R treatment (n = 6). (E) Representative RNA dot blot documents and summarized data showing the relative 8-OHG levels of RNA extracts from adenovirus vector-infected HK-2 cells with H/R treatment (n = 6). Data are represented as the mean ± SEM. ∗p < 0.05, ∗∗p < 0.01, ∗∗∗p < 0.001; ns, not significant. See also Figure S6.
Figure 7
Figure 7
ISG20 restricted oxidized RNA-induced ER stress and UPR cascades (A) Representative flow cytometry analysis and quantitative MFI depicting protein aggresomes in Ad-NC-, Ad-hISG20-, or Ad-hISG20D94G-infected HK-2 cells with H/R treatment (n = 6). (B) Representative western blot gel documents and summarized data showing the protein levels of p-IRE1α and CHOP in Ad-NC-, Ad-hISG20-, or Ad-hISG20D94G-infected HK-2 cells with H/R treatment (n = 6). (C) Relative mRNA levels of ER stress/UPR cascade downstream genes in Ad-NC-, Ad-hISG20-, or Ad-hISG20D94G-infected HK-2 cells with H/R treatment (n = 6). (D) Representative western blot gel documents and summarized data showing the protein levels of p-IRE1α, cleaved ATF6 (cATF6), and CHOP in the kidneys from different groups of IRI model mice (n = 8). (E) Relative mRNA levels of ER stress/UPR cascade downstream genes in the kidneys from different groups of IRI model mice (n = 8). Data are represented as the mean ± SEM. ∗p < 0.05, ∗∗p < 0.01, ∗∗∗p < 0.001; ns, not significant. See also Figure S7.
Figure 8
Figure 8
ISG20 overexpression in mice significantly ameliorated renal injury after I/R (A) SCr levels of different groups of IRI model mice (n = 8). (B) BUN levels of different groups of IRI model mice (n = 8). (C) Representative photomicrographs of H&E staining and quantitative assessment of tubular damage in kidneys from different groups of IRI model mice (n = 8). (D) Representative photomicrographs and quantification of TUNEL assays of the kidneys from different groups of IRI model mice to assess renal cell death (n = 8). Nuclei were revealed by using DAPI staining. (E) Representative photomicrographs of 15A3 antibody immunohistochemical staining of kidney sections with DNase treatment and quantification of 8-OHG+ cells in kidneys from different groups of IRI model mice (n = 8). Red arrows indicate representative 8-OHG+ cells. (F) Renal 8-OHG levels of different groups of IRI model mice (n = 8). (G) Representative western blot gel documents and summarized data showing the protein levels of p-IRE1α, cleaved ATF6 (cATF6), and CHOP in the kidneys from different groups of IRI model mice (n = 8). (H) Relative mRNA levels of ER stress/UPR cascade downstream genes in the kidneys from different groups of IRI model mice (n = 8). (I) Representative photomicrographs and quantification of CHOP immunohistochemical staining in the kidneys from different groups of IRI model mice (n = 8). Data are represented as the mean ± SEM. ∗p < 0.05, ∗∗p < 0.01, ∗∗∗p < 0.001. See also Figures S8 and S9.

Similar articles

Cited by

References

    1. Tang C., Cai J., Yin X.M., Weinberg J.M., Venkatachalam M.A., Dong Z. Mitochondrial quality control in kidney injury and repair. Nat. Rev. Nephrol. 2021;17:299–318. - PMC - PubMed
    1. Dennis J.M., Witting P.K. Protective Role for Antioxidants in Acute Kidney Disease. Nutrients. 2017;9:718. - PMC - PubMed
    1. Tomsa A.M., Alexa A.L., Junie M.L., Rachisan A.L., Ciumarnean L. Oxidative stress as a potential target in acute kidney injury. PeerJ. 2019;7 - PMC - PubMed
    1. Kong Q., Lin C.L.G. Oxidative damage to RNA: mechanisms, consequences, and diseases. Cell. Mol. Life Sci. 2010;67:1817–1829. - PMC - PubMed
    1. Poulsen H.E., Specht E., Broedbaek K., Henriksen T., Ellervik C., Mandrup-Poulsen T., Tonnesen M., Nielsen P.E., Andersen H.U., Weimann A. RNA modifications by oxidation: a novel disease mechanism? Free Radic. Biol. Med. 2012;52:1353–1361. - PubMed

Publication types