. 2023 Sep;146(3):387-394.
doi: 10.1007/s00401-023-02612-x. Epub 2023 Jul 15.

Vagus nerve inflammation contributes to dysautonomia in COVID-19

Affiliations

Vagus nerve inflammation contributes to dysautonomia in COVID-19

Marcel S Woo et al. Acta Neuropathol. 2023 Sep.

Abstract

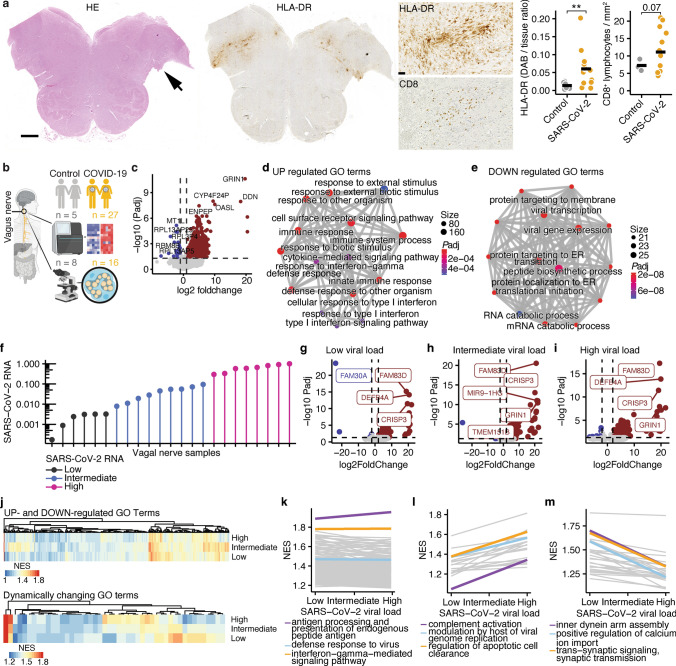
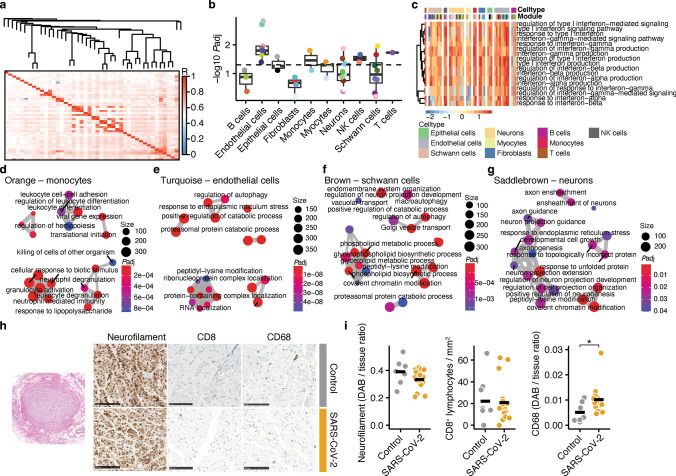
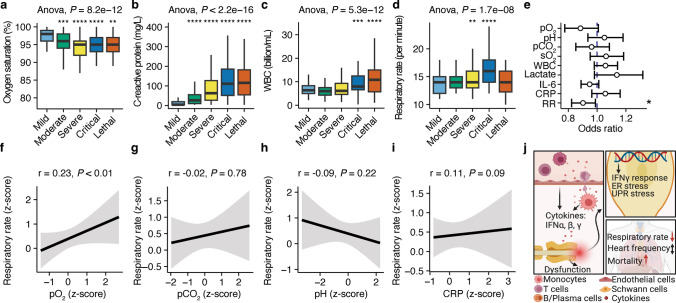
Dysautonomia has substantially impacted acute COVID-19 severity as well as symptom burden after recovery from COVID-19 (long COVID), yet the underlying causes remain unknown. Here, we hypothesized that vagus nerves are affected in COVID-19 which might contribute to autonomic dysfunction. We performed a histopathological characterization of postmortem vagus nerves from COVID-19 patients and controls, and detected SARS-CoV-2 RNA together with inflammatory cell infiltration composed primarily of monocytes. Furthermore, we performed RNA sequencing which revealed a strong inflammatory response of neurons, endothelial cells, and Schwann cells which correlated with SARS-CoV-2 RNA load. Lastly, we screened a clinical cohort of 323 patients to detect a clinical phenotype of vagus nerve affection and found a decreased respiratory rate in non-survivors of critical COVID-19. Our data suggest that SARS-CoV-2 induces vagus nerve inflammation followed by autonomic dysfunction which contributes to critical disease courses and might contribute to dysautonomia observed in long COVID.

Keywords: COVID-19; Dysautonomia; Neuroinflammation; Vagus nerve.


Conflict of interest statement

The authors declare no conflict of interest.

Figures

Fig. 1
Fig. 1
Inflammation of the vagus nerve is commonly observed in COVID-19. a H&E staining (left) and HLA-DR staining (middle) with arrow indicating the entry of the vagal nerve. Scale bar shows 2 mm. Higher magnification of vagal nerve entry into the brain stem of HLA-DR (middle, top) and CD8 (middle, bottom) staining and quantification. Scale bar shows 100 µm. b Graphical summary of experimental setup. c Volcano plot depicting all identified genes. Genes with FDR-adjusted P value < 0.05 and log2 foldchange > 1 are labeled in red and < − 1 in blue. Top 5 most up-regulated and down-regulated genes are labeled. d GO term analysis of top 200 differentially up-regulated genes. Color shows Padj and size number of genes included in the respective GO term. e GO term analysis of top 200 differentially down-regulated genes. Color shows FDR-adjusted P value and size number of genes included in the respective GO term. f SARS-CoV-2 RNA levels determined by qPCR in 23 available vagus nerve samples grouped into low, intermediate, and high groups. Logarithmic scale is shown on y-axis. g–i Volcano plots of differential expression analyses between low (g), intermediate (h), and high (i) viral load groups against controls. j Heatmaps of GO terms that are up- or down-regulated independent of SARS-CoV-2 viral load (top) or correlate with SARS-CoV-2 viral load (down) determined by generalized linear model corrected for age and sex. k GO terms that are significantly enriched independently of SARS-CoV-2 viral load. l GO terms that are positively associated with SARS-CoV-2 viral load. m GO terms that are negatively associated with SARS-CoV-2 viral load
Fig. 2
Fig. 2
Cell-type-dependent inflammatory responses in vagus nerves of COVID-19 patients. a Network heatmap plot of weighted gene-correlated network analysis (WGCNA) for module identification in all samples. b Modules separated by clearly identified cell types through enrichment analysis with PanglaoDB. Modularity between control and COVID-19 samples were compared within each module. P < 0.05 shows significantly stronger enrichment of COVID-19 samples. Dashed line represents P = 0.05. Color represents module. c Heatmap depicting the enrichment of interferon signaling and response GO terms in all identified modules. Cell types and modules are separately labeled as individual colors. Color range shows row z-score. Non-significant enrichment is depicted as gray tile. d–g Emap plots of GO term enrichment analyses in the orange monocyte (d), turquoise endothelial cell (e), brown Schwann cell (f), and saddle-brown neuronal (g) modules. Interferon signaling GO terms were excluded. Color shows FDR-adjusted P value. Size shows number of genes included in the GO term. h Representative images of neurofilament, CD8, and CD68 in vagus nerves of control (top) and COVID-19 (bottom) samples. Scale bar shows 50 µm. i Comparison of neurofilament (DAB/tissue intensity ratio), CD8+ T cells per mm2 and CD68 (DAB/tissue intensity ratio) between control (n = 8, except for CD68 where 1 outlier was removed since it was > 3.5 × z-score of all samples) and COVID-19 samples (n = 16). Student’s t-test was used for statistical comparison. *P < 0.05
Fig. 3
Fig. 3
Maladaptive respiratory rate predicts lethal outcome in COVID-19. ad Comparisons of oxygen saturation (in percent; a), C-reactive protein (mg L–1; b), white blood cell count (billion mL–1; c), and respiratory rate (per minute; d) in patients with mild, moderate, critical, and lethal COVID-19. One-way ANOVA was performed for testing group differences. T test with FDR correction for multiple comparisons against mild COVID-19 group was performed. *P < 0.05, **P < 0.01, ***P < 0.001, ****P < 0.0001. e Odds ratio analysis corrected for age and sex to predict lethal outcome in critically ill patients. pH, venous carbon dioxide levels (pCO2), peripheral oxygen saturation (sO2), white blood cell count (WBC), lactate, interleukin-6 (IL-6), C-reactive protein (CRP), and respiratory rate (RR) were tested as predictors. Odds ratio and 95% confidence intervals are shown. *P < 0.05. f–i Correlation analyses of z-transformed respiratory rate and z-transformed venous oxygen level (pO2; f), venous carbon dioxide level (pCO2; g), pH (h), and C-reactive protein (CRP; i). Spearman correlation analysis was performed. Correlation coefficients and P values are provided in the figure. j Graphical summary of vagus nerve inflammation in COVID-19

References

    1. Carmona-Torre F, Mínguez-Olaondo A, López-Bravo A, Tijero B, Grozeva V, Walcker M, Azkune-Galparsoro H, López de Munain A, Alcaide AB, Quiroga J, del Pozo JL, Gómez-Esteban JC. Dysautonomia in COVID-19 patients: a narrative review on clinical course, diagnostic and therapeutic strategies. Front Neurol. 2022 doi: 10.3389/fneur.2022.886609. - DOI - PMC - PubMed
    1. Dalakas MC, Alexopoulos H, Spaeth PJ. Complement in neurological disorders and emerging complement-targeted therapeutics. Nat Rev Neurol. 2020;16:601–617. doi: 10.1038/s41582-020-0400-0. - DOI - PMC - PubMed
    1. Davis HE, McCorkell L, Vogel JM, Topol EJ. Author Correction: Long COVID: major findings, mechanisms and recommendations. Nat Rev Microbiol. 2023 doi: 10.1038/s41579-023-00896-0. - DOI - PMC - PubMed
    1. Dejanovic B, Wu T, Tsai M-C, Graykowski D, Gandham VD, Rose CM, Bakalarski CE, Ngu H, Wang Y, Pandey S, Rezzonico MG, Friedman BA, Edmonds R, De Mazière A, Rakosi-Schmidt R, Singh T, Klumperman J, Foreman O, Chang MC, Xie L, Sheng M, Hanson JE. Complement C1q-dependent excitatory and inhibitory synapse elimination by astrocytes and microglia in Alzheimer’s disease mouse models. Nat Aging. 2022;2:837–850. doi: 10.1038/s43587-022-00281-1. - DOI - PMC - PubMed
    1. Delorey TM, Ziegler CGK, Heimberg G, Normand R, Yang Y, Segerstolpe Å, Abbondanza D, Fleming SJ, Subramanian A, Montoro DT, Jagadeesh KA, Dey KK, Sen P, Slyper M, Pita-Juárez YH, Phillips D, Biermann J, Bloom-Ackermann Z, Barkas N, Ganna A, Gomez J, Melms JC, Katsyv I, Normandin E, Naderi P, Popov YV, Raju SS, Niezen S, Tsai LT-Y, Siddle KJ, Sud M, Tran VM, Vellarikkal SK, Wang Y, Amir-Zilberstein L, Atri DS, Beechem J, Brook OR, Chen J, Divakar P, Dorceus P, Engreitz JM, Essene A, Fitzgerald DM, Fropf R, Gazal S, Gould J, Grzyb J, Harvey T, Hecht J, Hether T, Jané-Valbuena J, Leney-Greene M, Ma H, McCabe C, McLoughlin DE, Miller EM, Muus C, Niemi M, Padera R, Pan L, Pant D, Pe’er C, Pfiffner-Borges J, Pinto CJ, Plaisted J, Reeves J, Ross M, Rudy M, Rueckert EH, Siciliano M, Sturm A, Todres E, Waghray A, Warren S, Zhang S, Zollinger DR, Cosimi L, Gupta RM, Hacohen N, Hibshoosh H, Hide W, Price AL, Rajagopal J, Tata PR, Riedel S, Szabo G, Tickle TL, Ellinor PT, Hung D, Sabeti PC, Novak R, Rogers R, Ingber DE, Jiang ZG, Juric D, Babadi M, Farhi SL, Izar B, Stone JR, Vlachos IS, Solomon IH, Ashenberg O, Porter CBM, Li B, Shalek AK, Villani A-C, Rozenblatt-Rosen O, Regev A, COVID-19 tissue atlases reveal SARS-CoV-2 pathology and cellular targets. Nature. 2021;595:107–113. doi: 10.1038/s41586-021-03570-8. - DOI - PMC - PubMed

Publication types