. 2023 Sep:129:103531.
doi: 10.1016/j.dnarep.2023.103531. Epub 2023 Jun 30.

Clinical evidence for a role of E2F1-induced replication stress in modulating tumor mutational burden and immune microenvironment

Affiliations

Clinical evidence for a role of E2F1-induced replication stress in modulating tumor mutational burden and immune microenvironment

Ke Tan et al. DNA Repair (Amst). 2023 Sep.

Abstract

DNA replication stress (RS) is frequently induced by oncogene activation and is believed to promote tumorigenesis. However, clinical evidence for the role of oncogene-induced RS in tumorigenesis remains scarce, and the mechanisms by which RS promotes cancer development remain incompletely understood. By performing a series of bioinformatic analyses on the oncogene E2F1, other RS-inducing factors, and replication fork processing factors in TCGA cancer database using previously established tools, we show that hyperactivity of E2F1 likely promotes the expression of several of these factors in virtually all types of cancer to induce RS and cytosolic self-DNA production. In addition, the expression of these factors positively correlates with that of ATR and Chk1 that govern the cellular response to RS, the tumor mutational load, and tumor infiltration of immune-suppressive CD4+Th2 cells and myeloid-derived suppressor cells (MDSCs). Consistently, high expression of these factors is associated with poor patient survival. Our study provides new insights into the role of E2F1-induced RS in tumorigenesis and suggests therapeutic approaches for E2F1-overexpressing cancers by targeting genomic instability, cytosolic self-DNA and the tumor immune microenvironment.

Keywords: Cytosolic self-DNA; E2F1; Replication stress; Tumor immune microenvironment; Tumor mutational burden.


Conflict of interest statement

Declaration of Competing Interest The authors declare no conflicts of interest.

Figures

Fig. 1.
Fig. 1.
Alterations of RS-inducing genes in cancer predict poor prognosis (A) 6101 of the 10801 patients analyzed have genetic alterations in 33 RS-inducing genes. The percentages on the left represent the mutation frequencies of the genes. (B) Kaplan-Meier survival curve of overall survival (OS) in Pan-Cancer Atlas for patients with or without alterations in the 33 RS-inducing genes. The numbers of the altered group (red) and unaltered group (blue) are 6101 and 4700, respectively. (C) Kaplan-Meier survival curve of disease-free survival (DFS) in Pan-Cancer Atlas for patients with or without alterations in the 33 RS-inducing genes. The numbers of the altered group(red) and unaltered group(blue) are 2996 and 2387, respectively.
Fig. 2.
Fig. 2.
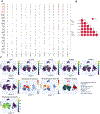
Concomitant upregulation of E2F1 and five other RS-inducing genes in cancer. (A) Relative mRNA expression levels of RS-inducing genes in 14 cancer types that had over 10 paired tumor and normal samples. Red circles and purple circles represent higher and lower gene expression, respectively, in tumor samples compared with normal tissues. (B) Spearman’s rank correlation coefficient between E2F1, CDCA5, CDC6 AURKA, MYNL2, and CCNE1 in the Pan-Cancer Atlas. 9664 patient samples were included in the analysis. Red color represents p < 0.001.(C) Expression of E2F1, CDCA5, CDC6, MYBL2, AURKA, CCNE1, cell type probability, and the enrichment score of DNA repair pathways for each cell in a cSCC sample [22] were visualized using CHARTS. The expression of the six RS-inducing factors was enriched in keratinocytes and cells with DNA repair pathway enrichment.
Fig. 3.
Fig. 3.
High expression of E2F1 and the five correlated RS-inducing genes is associated with poor prognosis. (A) Hazard ratios for the 33 RS-inducing genes in disease-specific survival (DSS), overall survival (OS). (B) Kaplan-Meier survival curve of OS and disease-free survival (DFS) for patients (9664) with the top 25% and bottom 25% mRNA expression levels of E2F1, CDCA5, CDC6, AURKA, MYBL2 and CCNE1 in Pan-Cancer Atlas. p < 0.001 for all the factors.
Fig. 4.
Fig. 4.
Genetic alterations in known/putative fork processing factors in cancer are associated with poor prognosis.(A) Of the 10953 patients analyzed, 2478 had genetic alterations in the 13 known/putative fork-processing factors and TREX1. The percentages on the left represent the mutation frequencies of the factors.(B) Kaplan-Meier survival curve of overall survival (OS) in Pan-Cancer Atlas for patients with or without genetic alterations in the known/putative fork processing factors. The numbers of the altered group (red) and unaltered group (blue) are 2450 and 8352, respectively.(C) Kaplan-Meier survival curve of disease-free survival (DFS) in the pan-cancer atlas for patients with or without genetic alterations in the known/putative fork-processing factors. The numbers of the altered (red) and unaltered (blue) groups are 1299 and 4084, respectively.
Fig. 5.
Fig. 5.
Concomitant upregulation of E2F1 and five fork processing factors in cancer. (A) Relative mRNA expression levels of the 13 known/putative fork processing factors in 14 cancer types that have over 10 paired tumor and normal samples. (B) Spearman’s rank correlation coefficient between E2F1, EXO1, DNA2, BLM, EME1 and GEN1 in Pan-Cancer Atlas. 9664 patient samples were included in the analysis. Red color represents p < 0.001. (C) Results of pathway activity analysis using 7876 samples from 32 cancer types in TCGA for E2F1, CDCA5, CDC6, AURKA, MYBL2, CCNE1, EXO1, DNA2, BLM, EME1, and GEN1. The Student’s t-test was performed to analyze the relationships between these genes. The p-value was adjusted using FDR, with FDR< =0.05 considered significant. The numbers represent the percentage of the total cancer types.
Fig. 6.
Fig. 6.
High expression of fork processing factors is associated with poor cancer prognosis. (A) Hazard ratios for the 13 known/putative fork processing factors and TREX1 in disease-specific survival (DSS) and overall survival (OS). (B) Kaplan-Meier survival curve of overall survival (OS) and disease-free survival (DFS) in Pan-Cancer Atlas for patients (9664) with the top 25% and bottom 25% mRNA expression levels of EXO1, DNA2, BLM, EME1, and GEN1. p < 0.001 for all the factors.
Fig. 7.
Fig. 7.
E2F1 is top-ranked among the genes whose expression correlates with the 10 RS-inducing/fork processing factors. (A) Result of KEGG pathway analysis for the genes whose expression positively correlates with that of RS-inducing (CDCA5, CDC6, AURKA, MYBL2, CCNE1) and fork processing factors (EXO1, DNA2, EME1, BLM, GEN1). A total of 678 genes with Spearman’s rank correlation coefficient ≥ 0.5 were analyzed. (B) A PPI network (highest confidence) was built using STRING database for the 678 genes described above. (C) Nineteen hub genes were identified in Cytoscape among 678 genes using the EcCentricity method. (D) Transcription factors (TF) predicted among 678 genes using TRRUST (version 2), a manually curated database of human and mouse transcriptional regulatory networks.
Fig. 8.
Fig. 8.
Expression of E2F1 and the correlated RS-inducing/fork processing factors positively correlates with tumor mutational burden and the infiltration of MDSCs and 2 cells. (A) Spearman’s rank correlation coefficient between the 11 factors and TMB for each cancer type. *, p < 0.05; red, positive correlation; blue: negative regulation. (B) Spearman’s rank correlation coefficient between the 11 factors, TREX1, and the infiltration of CD4+Th2 in each cancer type. *, p < 0.05; red color, positive correlation; blue color, negative regulation. (C) Spearman’s rank correlation coefficient between the 11 factors, TREX1 and the infiltration of MDSCs in each cancer type. *, p < 0.05; red color, positive correlation; blue color, negative regulation.
Fig. 9.
Fig. 9.
Correlation between Chk1 expression, expression of the 11-RS-inducing/fork processing factors, TMB, CD4+Th2, and MDSCs. (A) Spearman’s rank correlation coefficient between the 11 RS-inducing/fork processing factors and ATR or Chk1 in expression in Pan-Cancer Atlas. (B) Spearman’s rank correlation coefficient between the E2F1, ATR and Chk1 in TMB in each cancer type. Red color, positive correlation; blue color, negative regulation. (C) Spearman’s rank correlation coefficient between the E2F1, ATR, Chk1 and the tumor infiltration of CD4+Th2 in each cancer type. Red color, positive correlation; blue color, negative regulation. (D) Spearman’s rank correlation coefficient between the E2F1, ATR, CHEK1 and the tumor infiltration of MDSCs in each cancer type. Red color, positive correlation; blue color, negative regulation. (E) A model for the role of E2F1-induced replication stress in tumorigenesis. Upregulation of E2F1 in cancer cells induces replication stress, in part, by upregulating other RS-inducing factors including CDCA5, CDC6, AURKA, MYBL2, and CCNE1, which in turn causes genomic instability and increased tumor mutational burden. E2F1 also promotes the expression of fork processing factors including EXO1, DNA2, BLM, EME1, and GEN1, which in combination with TREX1 downregulation, causes accumulation of cytosolic self-DNA. Chronic cytosolic self-DNA signaling then modulates the tumor microenvironment, in part, by promoting the recruitment of immunosuppressive MDSCs and CD4+Th2 cells. The combined effects on genomic stability and the immune microenvironment promote tumor progression.

Similar articles

Cited by

References

    1. Tomasetti C, Li L, Vogelstein B, Stem cell divisions, somatic mutations, cancer etiology, and cancer prevention, Science 355 (2017) 1330–1334. - PMC - PubMed
    1. Zeman MK, Cimprich KA, Causes and consequences of replication stress, Nat. Cell Biol 16 (2014) 2–9. - PMC - PubMed
    1. Mazouzi A, Velimezi G, Loizou JI, DNA replication stress: causes, resolution and disease, Exp. Cell Res 329 (2014) 85–93. - PubMed
    1. Ragu S, Matos-Rodrigues G, Lopez BS, Replication stress, DNA damage, inflammatory cytokines and innate immune response, Genes 11 (2020) 409. - PMC - PubMed
    1. Hallstrom TC, Mori S, Nevins JR, An E2F1-dependent gene expression program that determines the balance between proliferation and cell death, Cancer Cell 13 (2008) 11–22. - PMC - PubMed

Publication types