. 2023 Aug 17;30(8):933-942.e6.
doi: 10.1016/j.chembiol.2023.06.012. Epub 2023 Jul 14.

Insulin sensitization by small molecules enhancing GLUT4 translocation

Affiliations

Insulin sensitization by small molecules enhancing GLUT4 translocation

Terry C Yin et al. Cell Chem Biol. .

Abstract

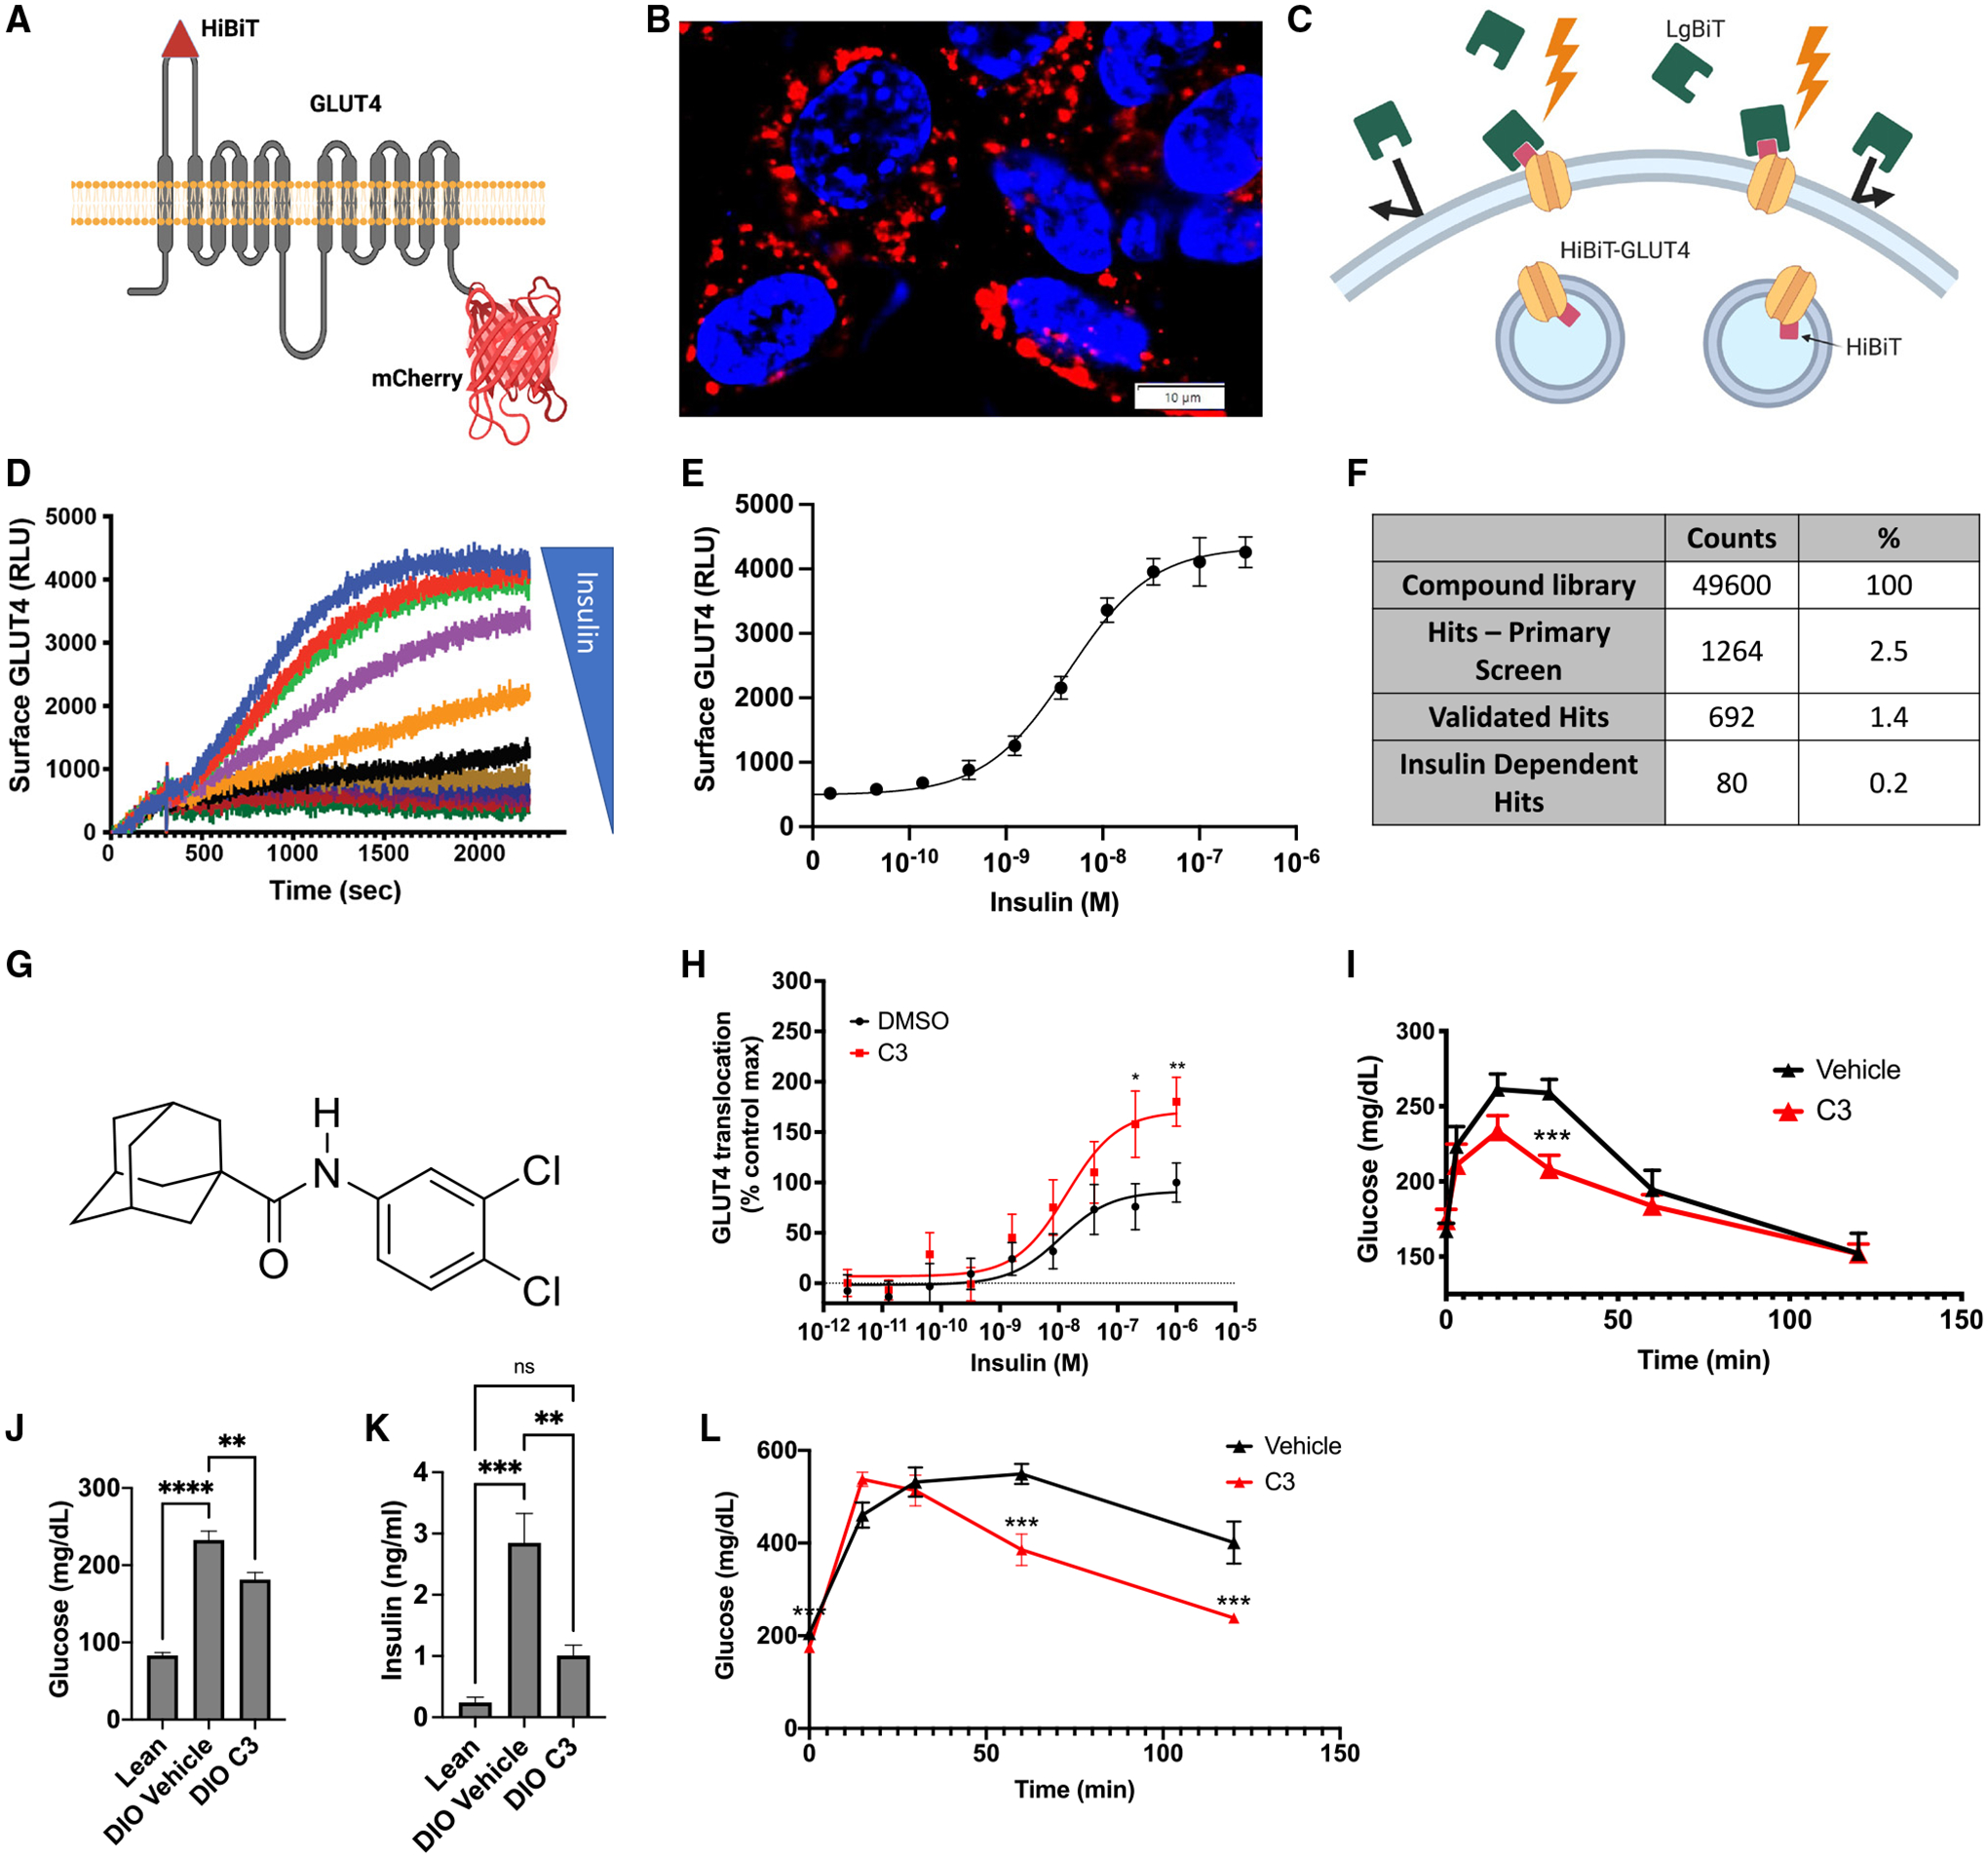
Insulin resistance (IR) is the root cause of type II diabetes, yet no safe treatment is available to address it. Using a high throughput compatible assay that measures real-time translocation of the glucose transporter glucose transporter 4 (GLUT4), we identified small molecules that potentiate insulin action. In vivo, these insulin sensitizers improve insulin-stimulated GLUT4 translocation, glucose tolerance, and glucose uptake in a model of IR. Using proteomic and CRISPR-based approaches, we identified the targets of those compounds as Unc119 proteins and solved the structure of Unc119 bound to the insulin sensitizer. This study identifies compounds that have the potential to be developed into diabetes treatment and establishes Unc119 proteins as targets for improving insulin sensitivity.

Keywords: GLUT4; Unc119; Unc119b; glucose uptake; high throughput screening; insulin resistance; translocation.


Conflict of interest statement

Declaration of interests J.A.S., T.C.Y., and R.J.K. are inventors on a patent related to this work.

Figures

Figure 1.
Figure 1.. HTS identification of insulin sensitizers
(A) Schematic depicting HiBiT-GLUT4-mCherry. (B) GLUT4 localization in HBG4 cells using mCherry fluorescence microscopy. (C) Schematic of the HiBiT luciferase complementation assay used for measuring GLUT4 surface density. (D) Real-time luminescence recordings reporting GLUT4 translocation in HBG4 cells treated with indicated insulin concentrations (0–100 nM). (E) Insulin concentration-response curve of GLUT4 translocation in HBG4 cells. (F) Results from primary screen and validation. (G) C3 formula. (H) Insulin concentration-response of GLUT4 translocation in HBG4 cells in the presence or absence of C3. (I) IPGTT in lean mice 10 min after injection of vehicle or 5 mg/kg C3. (n = 20 per group). (J) Fasting blood glucose in untreated lean mice and DIO mice treated with vehicle or 20 mg/kg C3 for 2 weeks (n = 5 per group). (K) Fasting plasma insulin in untreated lean mice and DIO mice treated with vehicle or 20 mg/kg C3 for 2 weeks (n = 5 per group). (L) IPGTT in DIO mice treated with vehicle or 20 mg/kg C3 for 2 weeks (n = 5 per group). Data are mean ± SEM **p < 0.01, ***p < 0.001.
Figure 2.
Figure 2.. Activity of C3 derivatives
(A–C) Insulin stimulated GLUT4 translocation measurement in HBG4 cells treated with vehicle or C3 derivatives C29 (A), C23 (B), and C59 (C). (D and E) GLUT4 translocation in HBG4 cells treated with different concentration of insulin in the absence (D) or presence (E) of C59. (F) Insulin concentration response curves measuring GLUT4 translocation in HBG4 cells in the presence of vehicle, C3 or C59. (G) Surface GLUT4 density in HBG4 cells treated with 100 nM insulin and increasing concentrations C59. (H) IPGTT in lean mice 10 min after injection of vehicle or 5 mg/kg C59 (N = 15 to 18 per group). (I) IPGTT in DIO mice treated with daily IP injections of vehicle or 10 mg/kg C59 for 2 weeks (N = 11 to 13 per group). (J) IPGTT in DIO mice fed HFD or HFD supplemented with C59 for 2 weeks (N = 10 per group). (K) Body weight of DIO mice treated with vehicle, injected C59 (IP) or fed C59 (PO). (L) Fasting blood glucose in DIO mice fed HFD or HFD supplemented with C59 for 2 weeks (N = 10 per group). (M) Fasting plasma insulin in DIO mice fed HFD or HFD supplemented with C59 for 2 weeks (N = 10 per group). Data are in mean ± SEM **p < 0.01, ***p < 0.001, ****p < 0.0001.
Figure 3.
Figure 3.. C59 improves GLUT4 translocation and glucose uptake in DIO mice
(A) Ventral and dorsal IVIS luminescence images showing GLUT4 translocation in HBG4 DIO mice fed HFD or HFD supplemented with C59 for 2 weeks and treated with vehicle or insulin. (B) Luminescence measurements on the ventral side of HBG4 DIO mice fed HFD or HFD supplemented with C59 for 2 weeks and treated with vehicle or insulin (N = 6–10 per group). (C) Luminescence measurements on the dorsal side of HBG4 DIO mice fed HFD or HFD supplemented with C59 for 2 weeks and treated with vehicle or insulin. (D and E) PET/CT scan of 18F-2DG uptake in DIO mice treated with vehicle (D) or C59 (E) for 2 weeks (N = 5 per group). (F–H) Zoomed in images of PET/CT scan focusing on limb muscles (F), scapular area containing BAT (G), and the heart (H). (I–N) Quantitative analysis of 18F-2DG uptake in fore limbs (I), hind limbs (J), BAT (K), heart (L), brain (M), and liver (N) (N = 5). Data are shown in standard uptake value (SUV) average normalized to blood glucose. Data are mean ± SEM *p < 0.05, **p < 0.01, ***p < 0.001.
Figure 4.
Figure 4.. C59 sensitizes insulin action through interaction with Unc119 and Unc119B
(A) Correlation plot of the log2 fold change values for all proteins quantified with two or more peptides from C2C12 cells following treatment with 25 μM C59 (y axis) or C23 (x axis) as determined by PISA. This plot shows the upper right quadrant and focuses on commonly stabilized proteins. Full plot can be found in Figure S3. Unc119B is highlighted in red. (B) PISA log2 fold change values for Unc119 and Unc119B from C2C12 cells treated with either 5 μM, 25 μM, or 125 μM of each indicated compound or vehicle. (C) C2C12 crude extracts were treated with 25 μM C59 and subjected to PISA. Significant changes in protein abundance are shown as a volcano plot. Curves represent a 5% FDR. Unc119B and Unc119 are highlighted in red and blue, respectively. (D and E) Crystal structure of Unc119 bound to C59. (F–H) Insulin-stimulated GLUT4 translocation in the presence of vehicle or C59 in HBG4 cells (F), Unc119 KO HBG4 cells (G), and Unc119B KO HBG4 cells (H). Traces are normalized to the maximum signal of vehicle treated cells for each cell line. (I–K) 3H-2DG uptake in in HBG4 cells (I), Unc119 KO HBG4 cells (J), and Unc119B KO HBG4 cells (K) treated with vehicle, insulin, C59, or insulin and C59. Results are normalized to the glucose uptake with insulin alone for each cell line. Data are mean ± SEM **p < 0.01, ****p < 0.0001.

References

    1. Foster LJ, and Klip A (2000). Mechanism and regulation of GLUT-4 vesicle fusion in muscle and fat cells. Am. J. Physiol. Cell Physiol 279, C877–C890. 10.1152/ajpcell.2000.279.4.C877. - DOI - PubMed
    1. Li DT, Habtemichael EN, Julca O, Sales CI, Westergaard XO, DeVries SG, Ruiz D, Sayal B, and Bogan JS (2019). GLUT4 Storage Vesicles: Specialized Organelles for Regulated Trafficking. Yale J. Biol. Med 92, 453–470. - PMC - PubMed
    1. Watson RT, and Pessin JE (2001). Intracellular organization of insulin signaling and GLUT4 translocation. Recent Prog. Horm. Res 56, 175–193. 10.1210/rp.56.1.175. - DOI - PubMed
    1. Mueckler M (2001). Insulin resistance and the disruption of Glut4 trafficking in skeletal muscle. J. Clin. Invest 107, 1211–1213. 10.1172/JCI13020. - DOI - PMC - PubMed
    1. Cade WT (2008). Diabetes-related microvascular and macrovascular diseases in the physical therapy setting. Phys. Ther 88, 1322–1335. 10.2522/ptj.20080008. - DOI - PMC - PubMed

Publication types