. 2023 Sep:75:101776.
doi: 10.1016/j.molmet.2023.101776. Epub 2023 Jul 13.

Hepatocyte-specific O-GlcNAc transferase downregulation ameliorates nonalcoholic steatohepatitis by improving mitochondrial function

Affiliations

Hepatocyte-specific O-GlcNAc transferase downregulation ameliorates nonalcoholic steatohepatitis by improving mitochondrial function

Maria J Gonzalez-Rellan et al. Mol Metab. 2023 Sep.

Abstract

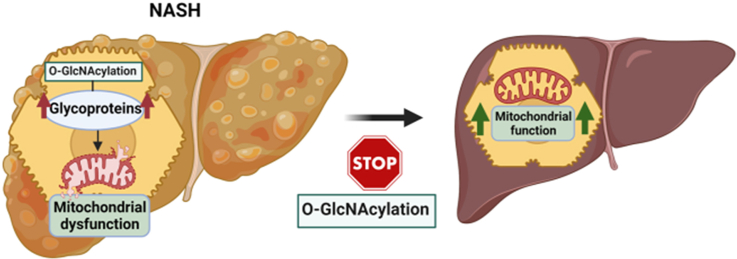
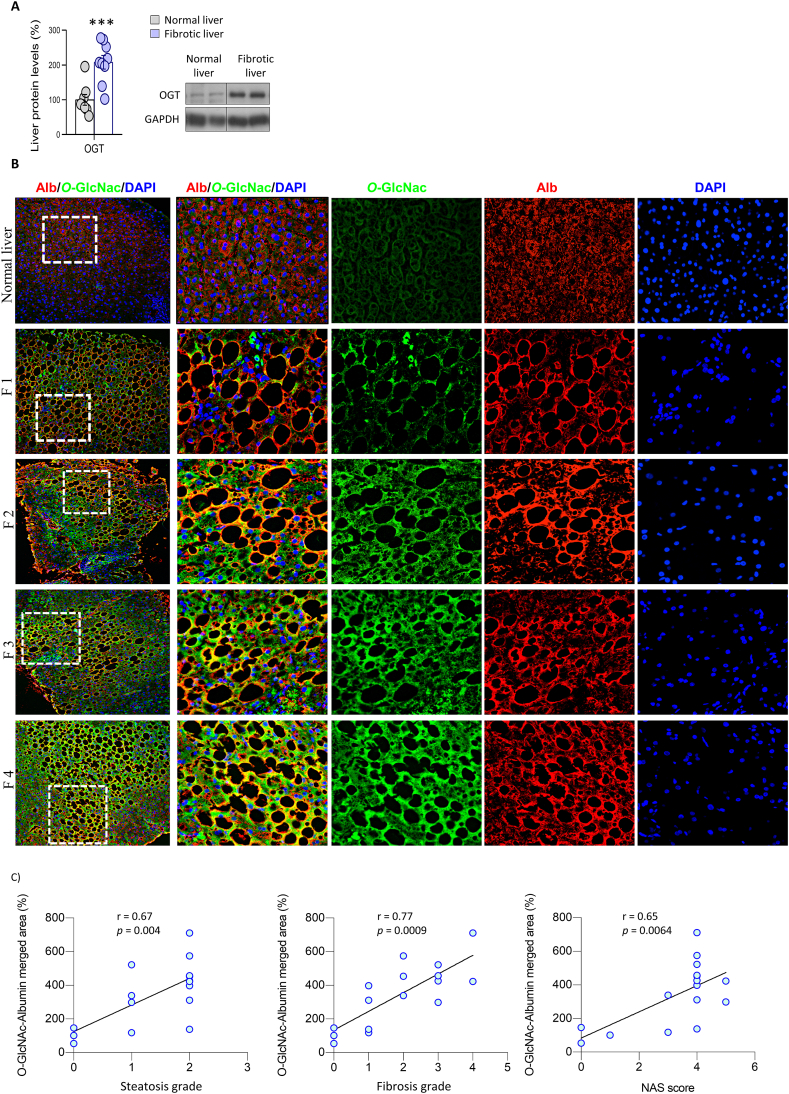
Objective: O-GlcNAcylation is a post-translational modification that directly couples the processes of nutrient sensing, metabolism, and signal transduction, affecting protein function and localization, since the O-linked N-acetylglucosamine moiety comes directly from the metabolism of glucose, lipids, and amino acids. The addition and removal of O-GlcNAc of target proteins are mediated by two highly conserved enzymes: O-linked N-acetylglucosamine (O-GlcNAc) transferase (OGT) and O-GlcNAcase (OGA), respectively. Deregulation of O-GlcNAcylation has been reported to be associated with various human diseases such as cancer, diabetes, and cardiovascular diseases. The contribution of deregulated O-GlcNAcylation to the progression and pathogenesis of NAFLD remains intriguing, and a better understanding of its roles in this pathophysiological context is required to uncover novel avenues for therapeutic intervention. By using a translational approach, our aim is to describe the role of OGT and O-GlcNAcylation in the pathogenesis of NAFLD.

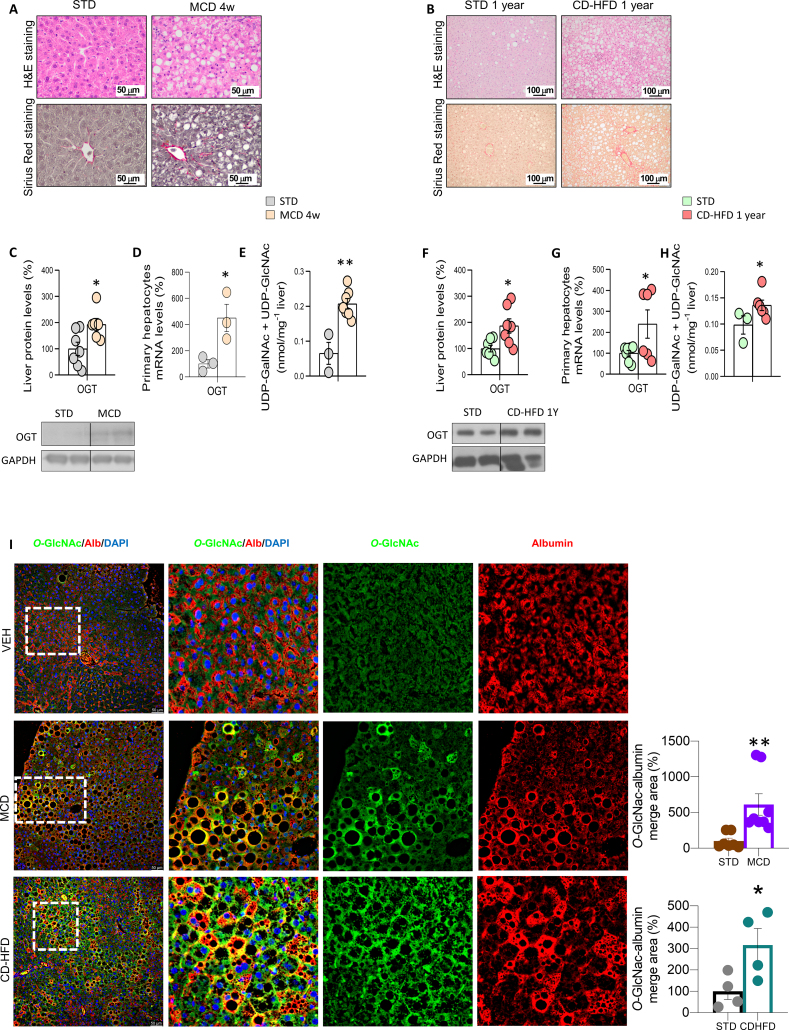
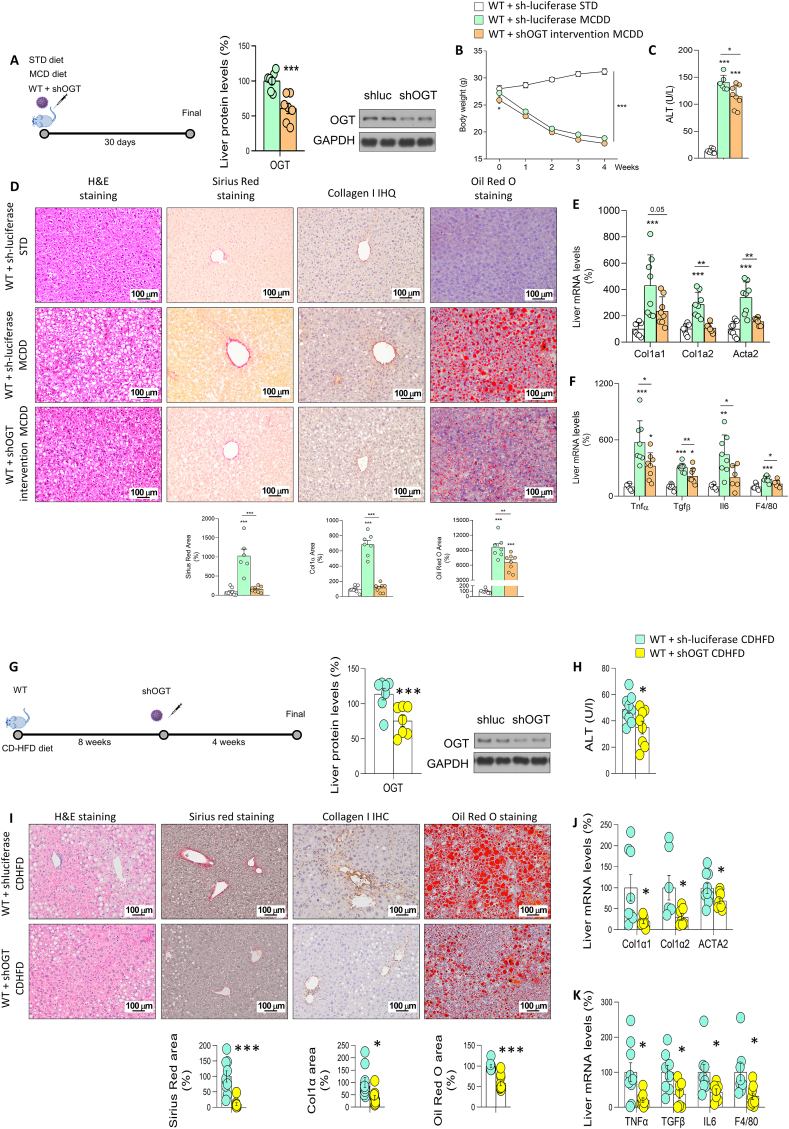
Methods: We used primary mouse hepatocytes, human hepatic cell lines and in vivo mouse models of steatohepatitis to manipulate O-GlcNAc transferase (OGT). We also studied OGT and O-GlcNAcylation in liver samples from different cohorts of people with NAFLD.

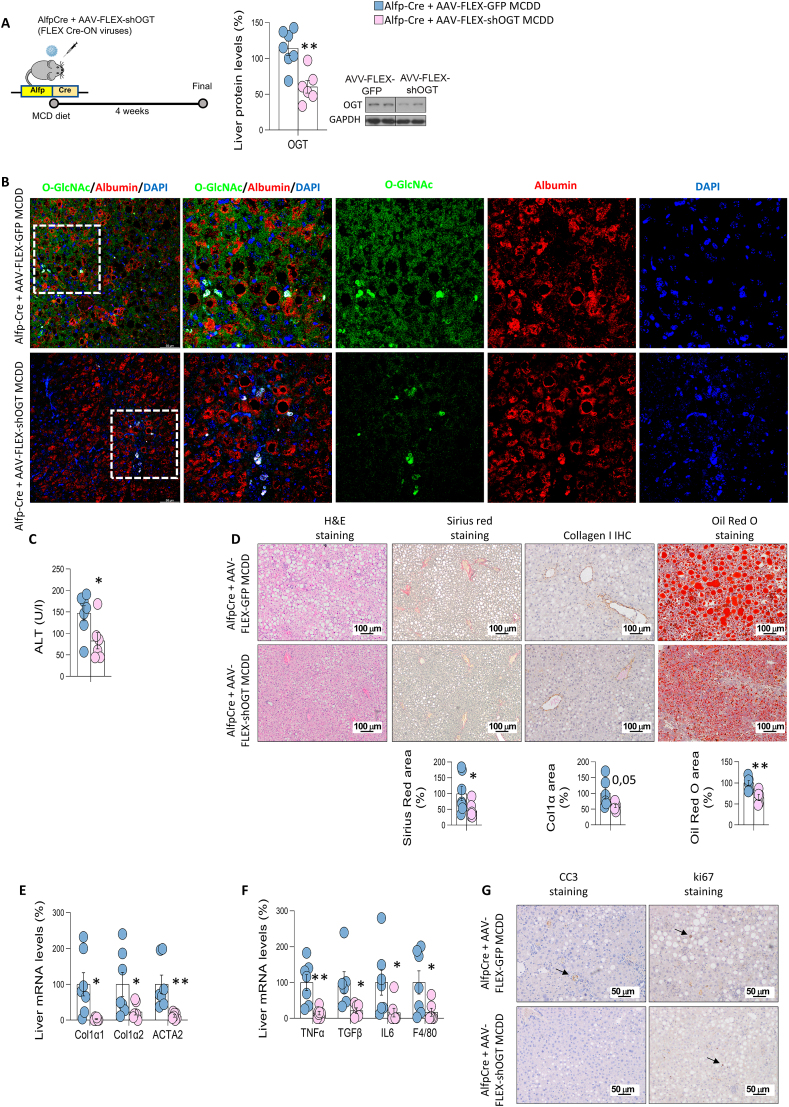
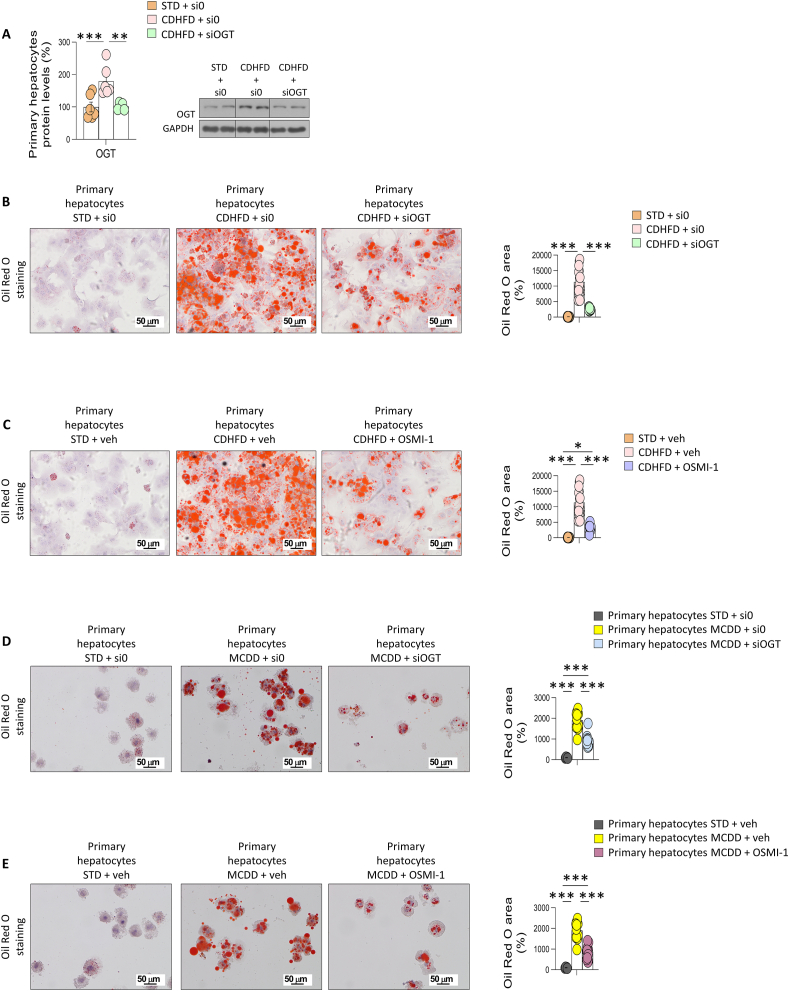
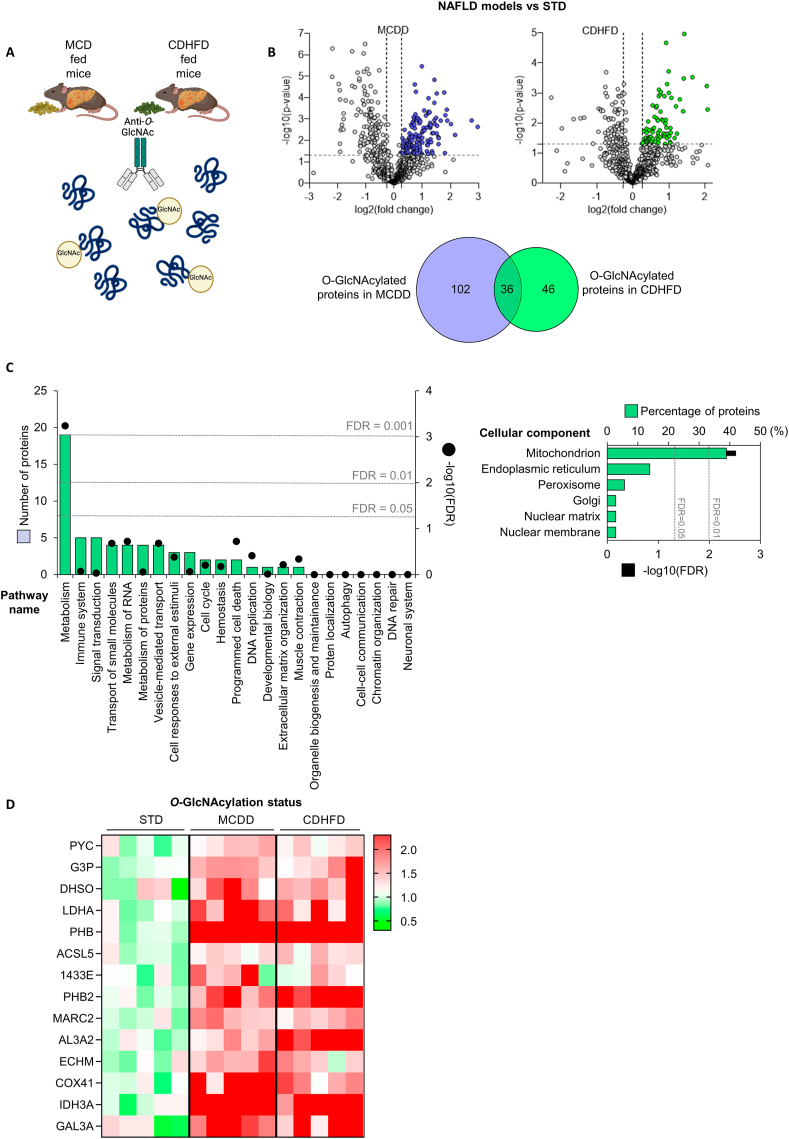
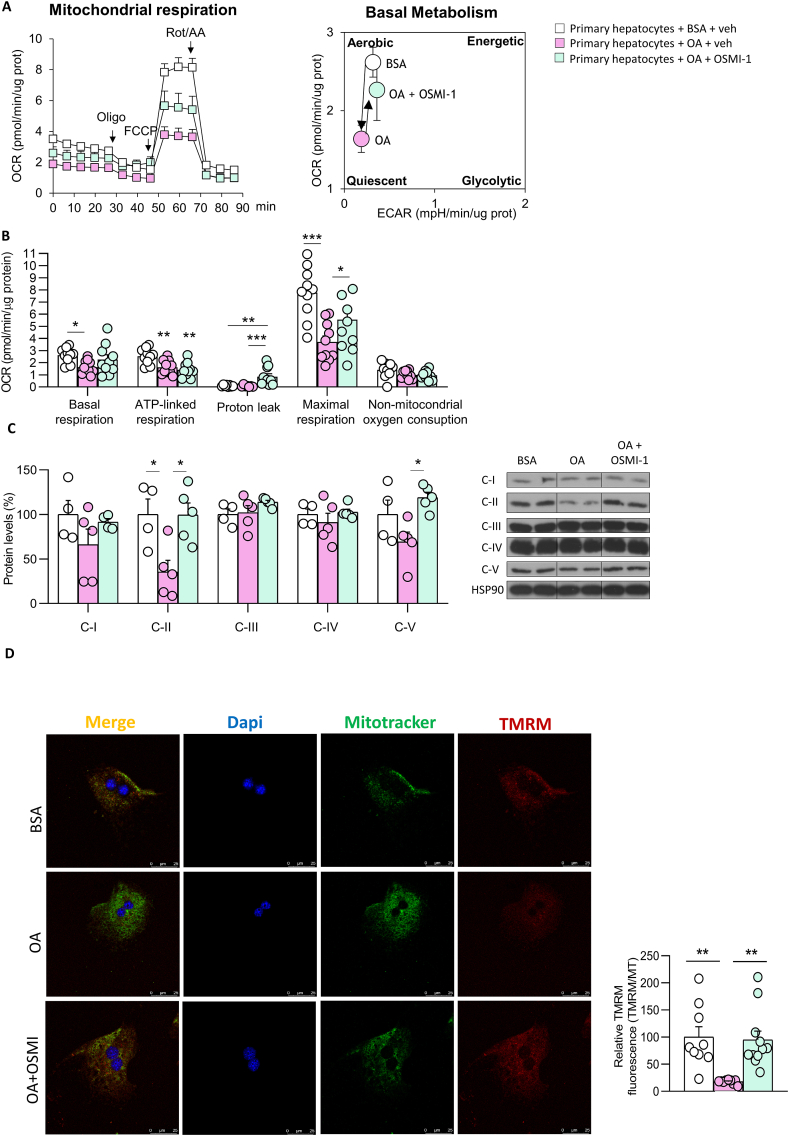
Results: O-GlcNAcylation was upregulated in the liver of people and animal models with steatohepatitis. Downregulation of OGT in NAFLD-hepatocytes improved diet-induced liver injury in both in vivo and in vitro models. Proteomics studies revealed that mitochondrial proteins were hyper-O-GlcNAcylated in the liver of mice with steatohepatitis. Inhibition of OGT is able to restore mitochondrial oxidation and decrease hepatic lipid content in in vitro and in vivo models of NAFLD.

Conclusions: These results demonstrate that deregulated hyper-O-GlcNAcylation favors NAFLD progression by reducing mitochondrial oxidation and promoting hepatic lipid accumulation.

Keywords: Mitochondrial dysfunction; NAFLD; O-GlcNAcylation.


Conflict of interest statement

Declaration of competing interest The authors declare no conflict of interest

Figures

Image 1
Graphical abstract
Figure 1
Figure 1
O-GlcNAcylation is upregulated in the hepatocytes of patients with liver fibrosis. A) OGT protein levels in healthy individuals and patients with NASH and fibrosis (n = 8–9). B) Representative colocalized immunofluorescence for albumin (red) with O-GlcNAc (green) in healthy (normal liver) and patients with NASH and fibrosis. Nuclei were stained with DAPI (blue). C) Correlations of albumin-O-GlcNAc merged area with the steatosis score, fibrosis score and NAFLD activity score (NAS) are shown (Spearman correlation) (n = 14–16). ∗∗∗p < 0.001, using a two-tail Student's t-test (A).
Figure 2
Figure 2
O-GlcNAcylation is increased in in vivo preclinical models of liver fibrosis. Mice were fed: A) a standard diet (STD) or a metionine- and choline-deficient diet (MCD diet) for 4 weeks; or B) a choline-deficient high-fat diet (CD-HFD) for one year. Representative microphotographs are shown of hematoxylin and eosin staining (H&E; upper panel) and Sirius red staining (lower panel) of liver sections. Expression of OGT in samples of total liver (C and F) and isolated primary hepatocytes (D and G) of each of the models (n = 3–7). Levels of UDP-GalNAc and UDP-GlcNAc (E and H) in the liver of both animal models (n = 3–7). I) Representative immunofluorescence for O-GlcNAc in the liver of each of the in vivo models. Quantification of albumin-O-GlcNAc merged areas are also shown for each of the models (n = 4–8). ∗p < 0.05, ∗∗p < 0.01 using a two-tail Student's t-test (C–I).
Figure 3
Figure 3
OGT inhibition ameliorates MCD- and CDHFD-induced hepatic fibrosis. A) OGT inhibition in wild-type (WT) mice fed a MCD diet compared to mice fed a standard diet (STD) and analysed by: B) Body weight of mice; C) ALT; D) hematoxylin & eosin, Sirius red, collagen 1 and Oil Red O staining. E, F) Expression of fibrosis (E) and inflammation (F) markers in mice injected with sh-luciferase or shOGT and fed a MCD diet (n = 6–8). G) OGT inhibition in WT mice fed a CDHFD and analysed by: H) ALT; I) hematoxylin & eosin, Sirius red, collagen 1 and Oil Red O staining. J, K) Expression of fibrosis (J) and inflammation (K) markers in mice injected with sh-luciferase or shOGT and fed a CDHFD (n = 7–10). ∗p < 0.05, ∗∗p < 0.01, ∗∗∗p < 0.001, using a two-tail Student's t-test (A), (G–K) or one-way ANOVA followed by a Bonferroni multiple comparison test (B–F).
Figure 4
Figure 4
Specific OGT deficiency in hepatocytes protects against liver fibrosis. A) Protein levels of OGT after its inhibition in MCD diet-fed Alfp-Cre mice using AAV-FLEX viruses. B) Representative colocalized immunofluorescence for albumin (red) with O-GlcNAc (green) in control (Alfp-Cre+AAV-FLEX-GFP) and mice with OGT knockdown (Alfp-Cre+AAV-FLEX-shOGT). Nuclei were stained with DAPI (blue). C) ALT levels. D) hematoxylin & eosin, Sirius red, collagen 1 and Oil Red O staining; E, F) Expression of fibrosis (E) and inflammation (F) markers in mice Alfp-Cre mice injected with AAV-FLEX-GFP or AAV-FLEX-shOGT and fed a MCD diet (n = 5–7). G) Representative microphotographs are shown of cleaved caspase 3 (CC3) and ki67 staining of liver sections. ∗p < 0.05, ∗∗p < 0.01, ∗∗∗p < 0.001, using a two-tail Student's t-test (A–F).
Figure 5
Figure 5
Specific OGT inhibition in hepatocytes reduces hepatic lipid content in in vitro models of liver fibrosis. A–C) OGT protein levels and Oil Red O staining in primary hepatocytes from mice fed standard diet (STD) and CDHFD, and treated with empty siRNA, siRNA-OGT, vehicle, and/or the O-GlcNAcylation inhibitor OSMI-1, as indicated. D, E) Oil red O staining in primary hepatocytes from mice fed standard diet (STD) and MCD, and treated with empty siRNA, siRNA-OGT, vehicle, and/or the O-GlcNAcylation inhibitor OSMI-1, as indicated. Quantification of Oil Red O area is also shown (n = 5–16). ∗p < 0.05, ∗∗p < 0.01, ∗∗∗p < 0.001, using a one-way ANOVA followed by a Bonferroni multiple comparison test.
Figure 6
Figure 6
Mitochondrial proteins are hyper-O-GlcNAcylated in in vivo models of liver fibrosis. A) Schematic representation of the immunoprecipitation procedure. B) Volcano plots and Venn diagram of the O-GlcNAcylated proteins from the livers of MCD diet- or CDHFD-fed mice. C) Reactome pathway classification of shared O-GlcNAcylated proteins from the liver of mice from (B), showing the number of proteins included in each category and the associated FDR. The same proteins were also classified according to the cellular component using FunRich tool. D) Heatmap representation of immunoprecipitated O-GlcNAcylated proteins in the liver of mice fed a STD, MCD diet or CDHFD.
Figure 7
Figure 7
O-GlcNAcylation affects mitochondrial activity in in vitro models of liver fibrosis. A) Oxygen consumption rate (OCR) in primary hepatocytes treated with BSA or oleic acid (OA) and then incubated with OSMI-1. Arrows indicate the timepoint at which mitochondrial respiration modulators (oligomycin [Oligo], phenylhydrazone [FCCP], or rotenone/antimycin A [Rot/AA]) were added to the assay. Right, graph depicting the effects of OA or OA+OSMI-1 on aerobic or quiescent metabolic states, based on quantification of glycolysis and oxygen consumption rate during basal metabolism. B) Parameters of mitochondrial function (n = 10). C) Protein levels of OXPHOS complexes (n = 4–5). D) TMRM and MitoTracker immunostaining (n = 9–11). ∗∗p < 0.01 and ∗∗∗p < 0.001, using a one-way ANOVA followed by a Bonferroni multiple comparison test.

References

    1. Younossi Z.M., Koenig A.B., Abdelatif D., Fazel Y., Henry L., Wymer M. Global epidemiology of nonalcoholic fatty liver disease-meta-analytic assessment of prevalence, incidence, and outcomes. Hepatology. 2016;64(1):73–84. - PubMed
    1. Gastaldelli A., Cusi K. From NASH to diabetes and from diabetes to NASH: mechanisms and treatment options. JHEP Rep. 2019;1(4):312–328. - PMC - PubMed
    1. Harrison S.A., Gawrieh S., Roberts K., Lisanti C.J., Schwope R.B., Cebe K.M., et al. Prospective evaluation of the prevalence of non-alcoholic fatty liver disease and steatohepatitis in a large middle-aged US cohort. J Hepatol. 2021;75(2):284–291. - PubMed
    1. Chitturi S., Abeygunasekera S., Farrell G.C., Holmes-Walker J., Hui J.M., Fung C., et al. NASH and insulin resistance: insulin hypersecretion and specific association with the insulin resistance syndrome. Hepatology. 2002;35(2):373–379. - PubMed
    1. Targher G., Corey K.E., Byrne C.D., Roden M. The complex link between NAFLD and type 2 diabetes mellitus – mechanisms and treatments. Nat Rev Gastroenterol Hepatol. 2021;18(9):599–612. - PubMed

Publication types