. 2023 Nov;51(11):2528-2543.
doi: 10.1007/s10439-023-03293-z. Epub 2023 Jul 15.

Biventricular Interaction During Acute Left Ventricular Ischemia in Mice: A Combined In-Vivo and In-Silico Approach

Affiliations

Biventricular Interaction During Acute Left Ventricular Ischemia in Mice: A Combined In-Vivo and In-Silico Approach

M J Colebank et al. Ann Biomed Eng. 2023 Nov.

Abstract

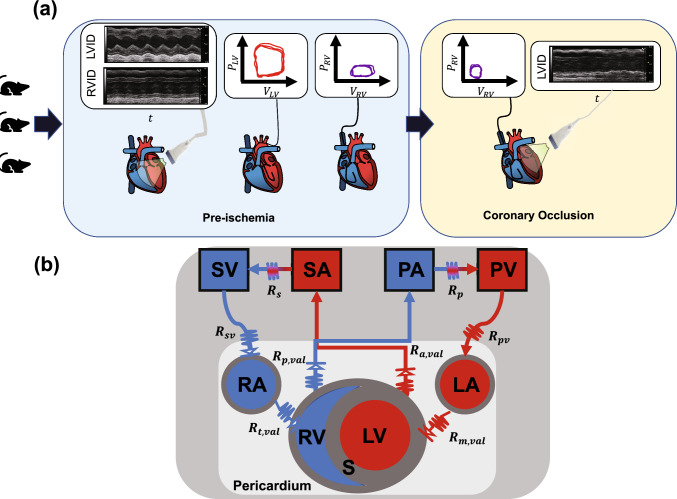
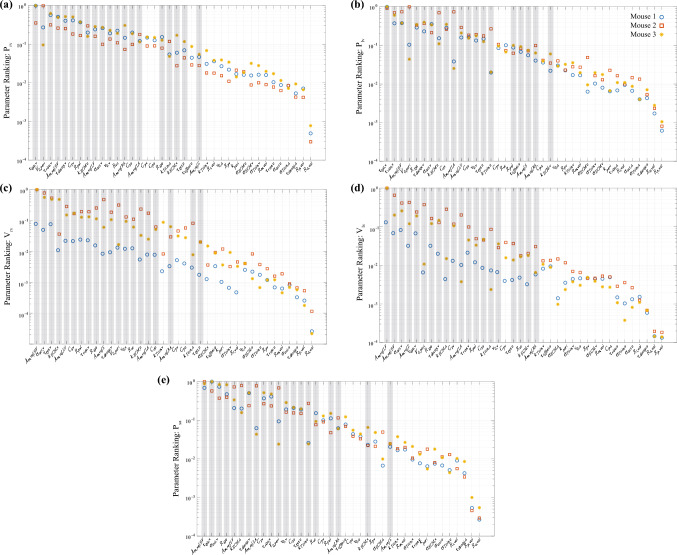
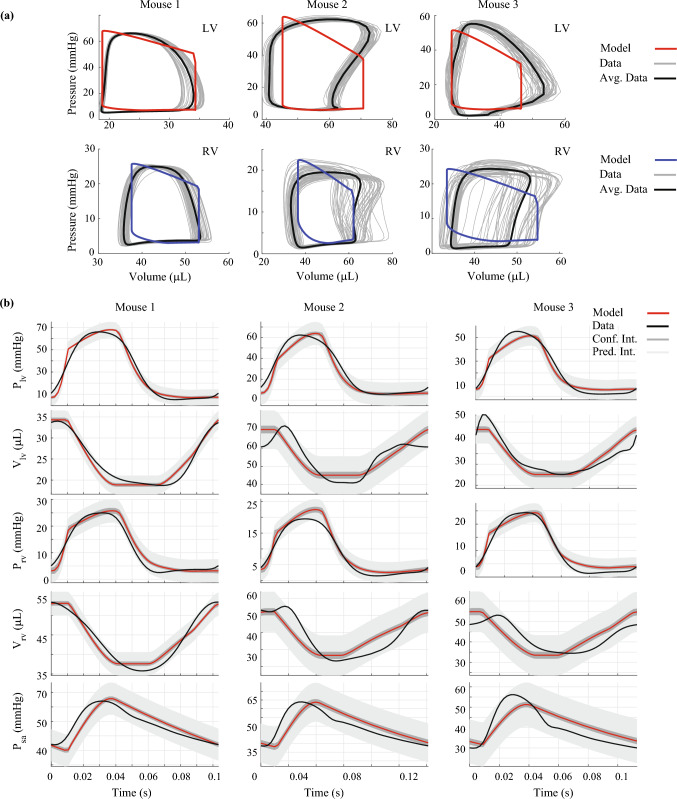
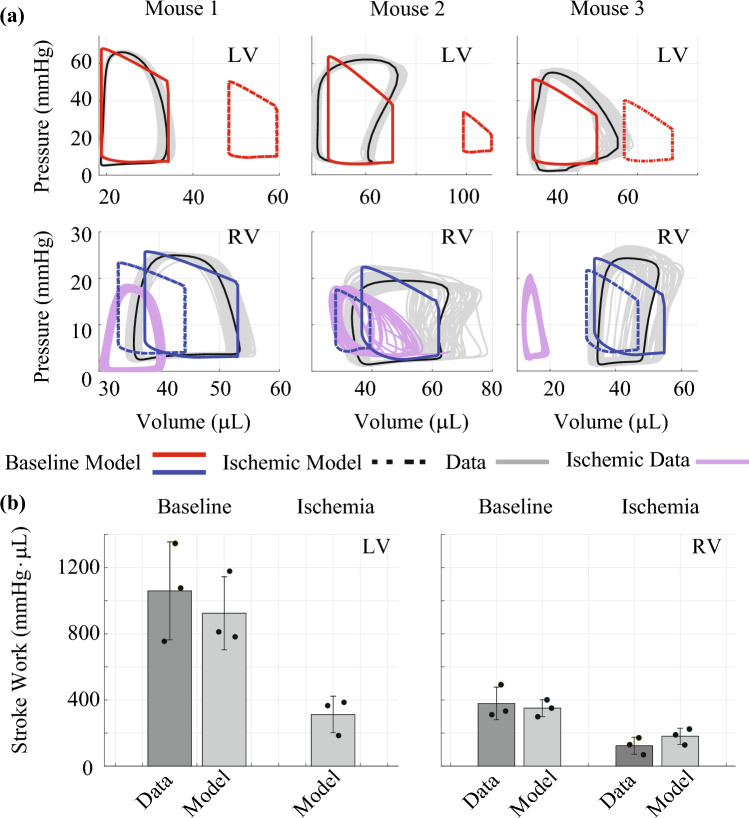
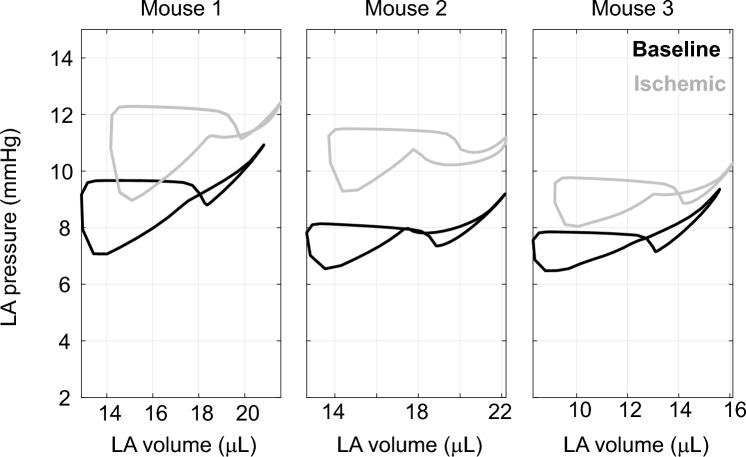
Computational models provide an efficient paradigm for integrating and linking multiple spatial and temporal scales. However, these models are difficult to parameterize and match to experimental data. Recent advances in both data collection and model analyses have helped overcome this limitation. Here, we combine a multiscale, biventricular interaction model with mouse data before and after left ventricular (LV) ischemia. Sensitivity analyses are used to identify the most influential parameters on pressure and volume predictions. The subset of influential model parameters are calibrated to biventricular pressure-volume loop data (n = 3) at baseline. Each mouse underwent left anterior descending coronary artery ligation, during which changes in fractional shortening and RV pressure-volume dynamics were recorded. Using the calibrated model, we simulate acute LV ischemia and contrast outputs at baseline and in simulated ischemia. Our baseline simulations align with the LV and RV data, and our predictions during ischemia complement recorded RV data and prior studies on LV function during myocardial infarction. We show that a model with both biventricular mechanical interaction and systems-level cardiovascular dynamics can quantitatively reproduce in-vivo data and qualitatively match prior findings from animal studies on LV ischemia.

Keywords: Biventricular interaction; Computational model; Multiscale modeling; Myocardial infarction; Parameter estimation; Sensitivity analysis.


Figures

Fig. 1
Fig. 1
Experimental and model schematics. a Three male mice underwent non-invasive echocardiography, providing measurements of ventricular inner diameter. A pressure–volume catheter was then placed in the LV chamber, data were recorded, the catheter was removed, and placed in the RV. While the RV catheter was still in, the left anterior descending coronary artery was ligated, and RV pressure–volume data were recorded. Echocardiography was repeated. b Schematic of the closed loop computational model. The two ventricles are coupled through a dynamic septal wall using the TriSeg framework. All four heart chambers are encased in a passive, pericardial sack and connected to compliant arterials and venous compartments. Resistors connect all compartment model components. LA left atrium, LV left ventricle, PA pulmonary arteries, PV pulmonary veins, RA right atrium, RV right ventricle, S septum, SA systemic arteries, SV systemic veins
Fig. 2
Fig. 2
In-vivo data from three male mice. a Pressure, volume, and combined pressure–volume loops in the RV at baseline. b Pressure and volume data in the LV at baseline. c Pressure-volume data in the RV after left descending coronary artery ligation. d Baseline and ischemic echocardiography measurements in the LV and RV
Fig. 3
Fig. 3
Parameter ranking using the combined index, M=μ2+s2, based on Morris screening for each mouse. Shaded columns represent the 20 parameters selected for additional analyses. a RV pressure. b LV pressure. c RV volume. d LV volume. e Systemic artery pressure. Each plot is normalized by the maximum index value for each mouse so that indices are scaled 0 to 1. Parameters deemed influential are shaded in gray across all five subplots
Fig. 4
Fig. 4
Comparison of calibrated model simulations with measured hemodynamic data. Pressure–volume loops in the LV and RV (a) for each mouse. Red and blue curves represent the calibrated model with the measured data, shown in gray. b shows optimal model solutions (red), confidence intervals (light gray), and predictions intervals (dark gray) for LV pressure, LV volume, RV pressure, RV volume, and SA pressure, respectively. Note that most of the beat-to-beat signals are captured within the uncertainty bounds
Fig. 5
Fig. 5
Changes in pressure–volume relationships with LV ischemia. a Baseline pressure–volume data (gray) in the LV (top) and RV (bottom) compared to the baseline simulations after parameter inference (solid, colored lines). Ischemic RV data (solid, blue) and RV predictions (dotted, blue). Note that LV ischemia causes a rightward shift in LV pressure–volume loops, while RV pressure–volume loops show a slight to moderate leftward shift with a reduction in stroke volume. Ischemic RV data vary with each mouse. b Ventricular stroke work (integral of the pressure–volume loop) at baseline and in ischemia. Stroke work is larger in the LV due to pressure magnitude, and both LV and RV stroke work are reduced in ischemia
Fig. 6
Fig. 6
Left atrial (LA) pressure–volume loops from the model at baseline after parameter inference (black) and after LV ischemia (gray) in all three animals. The illustrated upward shift is indicative of elevated LV diastolic pressures. Note that baseline LA curves have the distinct “8” pattern seen in-vivo
Fig. 7
Fig. 7
Predicted longitudinal strain in the LV, RV, and S in all three animals after parameter inference. At baseline, all three walls contract synchronously and reach 10% shortening. Ischemia reduces longitudinal strain in the LV, while RV strain is relatively unchanged and S strain is increased. Time to peak strain in the RV and S are more delayed in ischemia
Fig. 8
Fig. 8
LV pressure–sarcomere length relationships in each mouse. Starting from each mouse’s optimal parameter set, the value of γMI is decreased from 1.0 to 0.1, reflecting a 0–90% decrease in LV active force generation. The optimal value of γMI is shown in black and provides a reduction in ejection fraction that best matches measurements in mice during ischemia. Note that the pressure–length curve has a distinct change in shape near the value of 0.2 and is qualitatively similar to prior studies using sonomicrometry [19]

Update of

Similar articles

Cited by

References

    1. Allen B, Frye H, Ramanathan R, Caggiano LR, Tabima DM, Chesler NC, Philip JL. Biomechanical and mechanobiological drivers of the transition from postcapillary pulmonary hypertension to combined pre−/postcapillary pulmonary hypertension. J. Am. Heart Assoc. 2023;12:1–15. doi: 10.1161/JAHA.122.028121. - DOI - PMC - PubMed
    1. Banks HT, Hu S, Thompson WC. Modeling and Inverse Problems in the Presence of Uncertainty. New York: Chapman and Hall/CRC; 2014.
    1. Bauer F, Jones M, Jian XQ, Castro P, Asada J, Sitges M, Cardon LA, Tsujino H, Zetts AD, Panza JA, Thomas JD, Shiota T. Quantitative analysis of left atrial function during left ventricular ischemia with and without left atrial ischemia: a real-time 3-dimensional echocardiographic study. J. Am. Soc. Echocardiogr. 2005;18:795–801. doi: 10.1016/j.echo.2005.01.018. - DOI - PubMed
    1. Burkhoff D, Tyberg J. Why does pulmonary venous pressure rise after onset of LV dysfunction: a theoretical analysis. Am. J. Physiol. Heart Circ. Physiol. 1993;265:1819–1828. doi: 10.1152/ajpheart.1993.265.5.H1819. - DOI - PubMed
    1. Colebank MJ, Chesler NC. An in-silico analysis of experimental designs to study ventricular function: a focus on the right ventricle. PLoS Comput. Biol. 2022;18:e1010017. doi: 10.1371/journal.pcbi.1010017. - DOI - PMC - PubMed