. 2023 Jul 15;14(1):4234.
doi: 10.1038/s41467-023-39969-2.

pH-dependence of the Plasmodium falciparum chloroquine resistance transporter is linked to the transport cycle

Affiliations

pH-dependence of the Plasmodium falciparum chloroquine resistance transporter is linked to the transport cycle

Fiona Berger et al. Nat Commun. .

Abstract

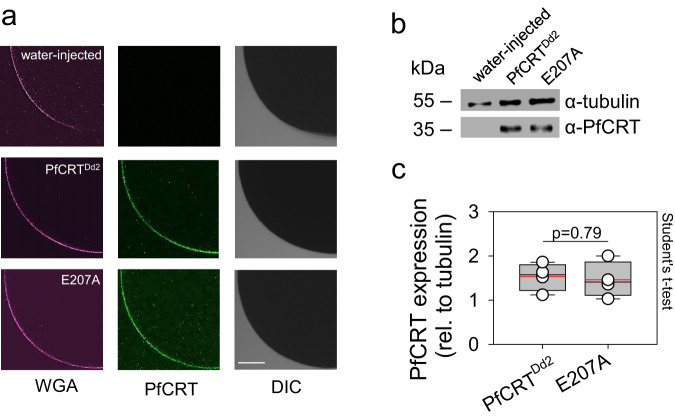
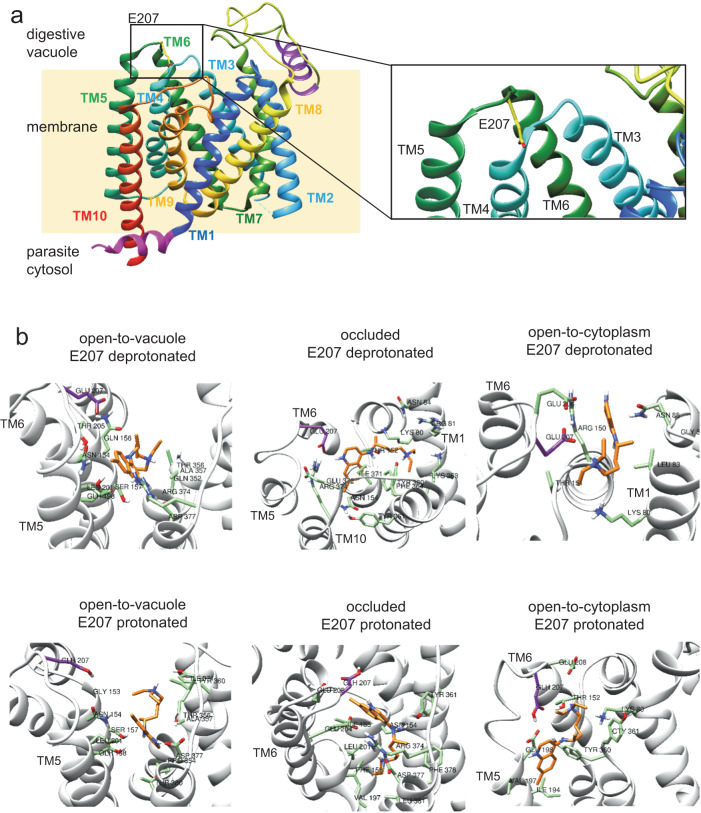
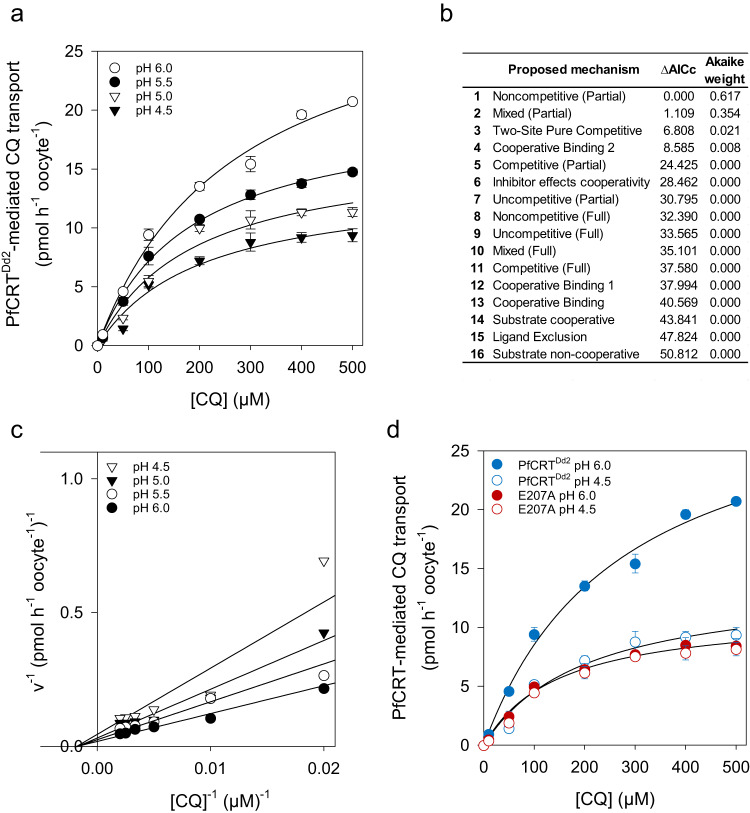
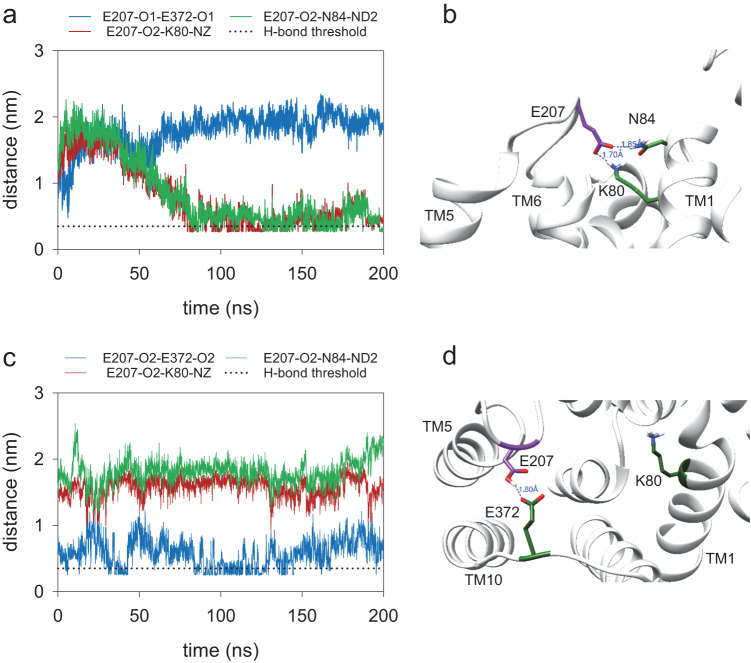
The chloroquine resistance transporter, PfCRT, of the human malaria parasite Plasmodium falciparum is sensitive to acidic pH. Consequently, PfCRT operates at 60% of its maximal drug transport activity at the pH of 5.2 of the digestive vacuole, a proteolytic organelle from which PfCRT expels drugs interfering with heme detoxification. Here we show by alanine-scanning mutagenesis that E207 is critical for pH sensing. The E207A mutation abrogates pH-sensitivity, while preserving drug substrate specificity. Substituting E207 with Asp or His, but not other amino acids, restores pH-sensitivity. Molecular dynamics simulations and kinetics analyses suggest an allosteric binding model in which PfCRT can accept both protons and chloroquine in a partial noncompetitive manner, with increased proton concentrations decreasing drug transport. Further simulations reveal that E207 relocates from a peripheral to an engaged location during the transport cycle, forming a salt bridge with residue K80. We propose that the ionized carboxyl group of E207 acts as a hydrogen acceptor, facilitating transport cycle progression, with pH sensing as a by-product.


Conflict of interest statement

The authors declare no competing interests.

Figures

Fig. 1
Fig. 1. Ι pH dependence of PfCRTDd2.
a CQ transport activity of PfCRTDd2 (blue symbols) and E207A (red symbols) as a function of the pH. Specific CQ transport was determined from an extracellular medium containing 50 µM of CQ. Each data point represents the mean ± SEM of n biologically independent samples, with n being from left to right for PfCRTDd2: 12, 11, 13, 26, 12, and 15; and E207A: 9, 3, 3, 9, 3, and 3. b PfCRTDd2-mediated CQ transport activity at a pH of 6.0 and 4.5. The number of biologically independent samples (n) are indicated. c R-value of PfCRTDd2, as defined by the ratio of the CQ transport activity at pH 4.5 over that at pH 6.0. d Left, Identification of E207 as a critical pH sensor in PfCRT. Shown is a plot of R-values against PfCRT-mediated CQ uptake at pH 6.0 of 53 PfCRTDd2-derived mutants, in which titratable and aromatic, π-interacting residues were replaced by alanine or asparagine in the case of aspartic acid. Relevant mutants are highlighted. For further information on the mutants see Supplementary Table 1. Right, Shown is a plot of R-values against transport activity at pH 6.0 for PfCRTDd2 (circle) and E207A (triangle) with the substrates, CQ (black), quinine (QN, light blue), quinidine (QD, purple), and piperaquine (PPQ, orange). Each data point represents the mean ± SEM of 3 to 9 biologically independent samples, with the number of biologically independent sample varying from mutant to mutant. e Substrate selectivity of PfCRTDd2 and E207A. The transport activities were normalized to that of CQ at pH 6.0. Verapamil (VP), vincristine (VNC), vinblastine (VNB), amantadine (AMA). Data were analyzed using bar charts, with the mean ± SEM of n biologically independent samples being shown, with n being from top to bottom for E207A: 9, 5, 5, 7, 3, 3, 3, and 4; and for PfCRTDd2: 26, 4, 5, 6, 3, 3, 3, and 4. The bar charts were overlaid with the individual data points. Source data for all subfigures are provided as a Source Data file.
Fig. 2
Fig. 2. Ι Expression of PfCRT variants in X. laevis oocytes.
a Confocal fluorescence images of fixed water-injected oocytes and PfCRTDd2 and E207A-expressing oocytes. Left, fluorescence image of Alexa 633 conjugated wheat germ agglutinin (WGA) as a marker of the oolemma. Middle, fluorescence image of PfCRT, using a specific rabbit antiserum and an anti-rabbit Alexa Fluor 546 secondary antibody. Right, differential interference contrast image (DIC). Scale bar, 135 μm. Representative images of 4 biologically independent samples. b Western analysis of total protein lysates from oocytes injected with water, PfCRTDd2-RNA, or E207A-RNA, using a polyclonal guinea pig antiserum specific to PfCRT and a polyclonal rabbit antiserum specific to α-tubulin. Representative images of 4 biologically independent samples. A size standard is indicated in kilodaltons. The uncropped images are presented in Supplementary Fig. 18. c Quantification of the PfCRT-specific signal strengths from 4 biologically independent samples (data points), normalized to the internal standard α-tubulin. A box plot analysis was overlaid over the individual data points, with the median (black line), mean (red lines), and 25% and 75% quartile ranges being shown. The whiskers above and below the box indicate the 90th and 10th percentile. The two datasets were not significantly different, according to the two-tailed Student’s t-test. Source data are provided as a Source Data file.
Fig. 3
Fig. 3. Ι In silico docking of CQ to simulated conformations of PfCRTDd2.
a Location of E207 (represented as sticks, with carbons in yellow) between transmembrane helices 5 and 6 (TM5 and TM6) in the open-to-vacuole conformation of PfCRTDd2. Note that the carboxyl side chain points into the cavity space. b Predicted binding modes of CQ (in orange) for different conformations of PfCRT (open-to-vacuole, occluded, open-to-cytoplasm) and different protonation states of E207 (in purple). Protein configurations were obtained from three independent 200-ns MD simulations, and clustered. CQ was docked to the centers of the clusters. Only the pose obtained for the most populated cluster is shown. Docking was performed using AutoDock Vina. Residues within a distance of 4 Å from CQ are shown in green. Source data are provided as a Source Data file.
Fig. 4
Fig. 4. Ι Effect of pH on PfCRT-mediated CQ transport kinetics.
a CQ transport kinetics of PfCRTDd2 at different proton concentrations (pH 4.5, 5.0, 5.5, and 6.0). Each data point represents the mean ± SEM of at least 3 biologically independent samples (range 3 to 14). b Sixteen different models of inhibition were fitted to the data represented in (a) using the least-squares methods. Plausibility was analyzed by calculating the Akaike information criterion difference (ΔAICc) and the Akaike weight. Models are shown in descending order. The kinetic parameters derived from the two most plausible inhibition models are presented in Table 1. c Double reciprocal Lineweaver-Burk Plot obtained with the data described in (a). d CQ transport kinetics of PfCRTDd2 and E207A at a pH of 4.5 and 6.0. Note, the E207A variant exhibits comparable CQ transport kinetics at pH 4.5 and 6.0. Each data point represents the mean ± SEM of at least 3 biologically independent samples (range 3 to 6). See Table 2 for kinetic parameters. Source data are provided as a Source Data file.
Fig. 5
Fig. 5. Ι Effect of the protonation state of E207 on structural changes in the occluded conformation of PfCRTDd2.
a Distance between hydrogen bond donors and acceptors, E207 and E372/K80/N84, in one MD simulation of the occluded conformation of PfCRTDd2, with E207 deprotonated. Dotted line indicates the threshold distance of 3.5 Å for the formation of a hydrogen bond. b Snapshot from one MD simulation illustrating the hydrogen bonds between E207 and K80 and N84 in the occluded conformation, with E207 deprotonated. c Distance between hydrogen bond donors and acceptors, E207 and E372/K80/N84, in one MD simulation of the occluded conformation of PfCRT, with E207 protonated. d Snapshot from one MD simulation illustrating hydrogen bond formation between E207 and E372 in the occluded conformation, with E207 protonated. Source data are provided as a Source Data file.
Fig. 6
Fig. 6. Ι Rescue of pH-sensitive CQ transport.
a Alanine mutagenesis of potential E207 interaction partners in the occluded conformation. Mutants were generated in the PfCRTDd2 background. Shown is a plot of R-values against the CQ transport activity at pH of 6.0 of the PfCRT variants indicated. Specific CQ transport was determined from an external CQ concentration of 50 µM. Each data point represents the mean ± SEM of n biologically independent samples. The number of biologically independent samples per mutant are: 14, PfCRTDd2; 9, E207A; 4, E327A; 4, K80A, 4, N84A; 3, E207K/K80E. b Replacement mutagenesis of E207. E207 was replaced by each of the 19 proteinogenic amino acids in the PfCRTDd2 background and the R-value was determined as a function of the CQ transport activity at a pH of 6.0. Note, only Asp and His (E207D and E207H variant) were able to reconstitute pH-sensitive CQ transport. Each data point represents the mean ± SEM of at least 3 biologically independent samples (range 3 to 14). c Effect of pH on E207H-mediated CQ transport. Each data point represents the mean ± SEM of 3 biologically independent samples. d E207H-mediated CQ transport kinetics at a pH of 4.5 and 6.0. Each data point represents the mean ± SEM of at least 3 to 4 biologically independent samples. Kinetic parameters are listed in Table 2. Source data are provided as a Source Data file.
Fig. 7
Fig. 7. Ι Model of the pH-sensing mechanism of PfCRTDd2.
Upper panel. The carboxyl side chain of E207 is located at the periphery of the substrate binding cavity in the open-to-vacuole conformation, with the side chain protruding into the cavity space and, thus, being exposed to the environment. At the pH of 5.2 of the digestive vacuole, the carboxyl side chain is mostly deprotonated and, hence, negatively charged. However, some protonated species exist, which explains the reduced transport rate at pH 5.2 as compared with pH 6.2. During the transport cycle, E207 repositions from a peripheral to an engaged position, moving the negatively charged carboxyl side chain close to the positively charged amino group side chain of K80. The predicted close distance between these two residues of ~ 1.80 Å facilitates the formation of a salt bridge, which, in turn, accelerates progression through the transport cycle. Lower panel. Protonation of the carboxyl side chain of E207 at low pH values would preclude the formation of a salt bridge with K80. Instead, the protonated carboxyl side chain of E207 would hydrogen bond with the carboxyl group of E372. In addition, the additional proton might cause possible steric problems. As a result, the transport activity is reduced.

Similar articles

Cited by

References

    1. Fidock DA, et al. Mutations in the P. falciparum digestive vacuole transmembrane protein PfCRT and evidence for their role in chloroquine resistance. Mol. Cell. 2000;6:861–871. doi: 10.1016/S1097-2765(05)00077-8. - DOI - PMC - PubMed
    1. Sanchez CP, et al. The knock-down of the chloroquine resistance transporter PfCRT is linked to oligopeptide handling in Plasmodium falciparum. Microbiol. Spectr. 2022;10:e0110122. doi: 10.1128/spectrum.01101-22. - DOI - PMC - PubMed
    1. Shafik SH, et al. The natural function of the malaria parasite’s chloroquine resistance transporter. Nat. Commun. 2020;11:3922. doi: 10.1038/s41467-020-17781-6. - DOI - PMC - PubMed
    1. Krugliak M, Zhang J, Ginsburg H. Intraerythrocytic Plasmodium falciparum utilizes only a fraction of the amino acids derived from the digestion of host cell cytosol for the biosynthesis of its proteins. Mol. Biochem. Parasitol. 2002;119:249–256. doi: 10.1016/S0166-6851(01)00427-3. - DOI - PubMed
    1. Rosenthal PJ. Falcipains and other cysteine proteases of malaria parasites. Adv. Exp. Med. Biol. 2011;712:30–48. doi: 10.1007/978-1-4419-8414-2_3. - DOI - PubMed

Publication types

MeSH terms