. 2023 Jul 15;14(1):4239.
doi: 10.1038/s41467-023-39957-6.

Mutational signature dynamics shaping the evolution of oesophageal adenocarcinoma

Collaborators, Affiliations

Mutational signature dynamics shaping the evolution of oesophageal adenocarcinoma

Sujath Abbas et al. Nat Commun. .

Abstract

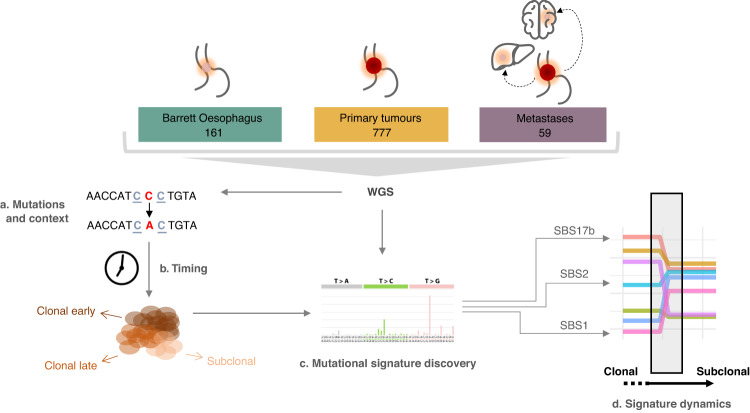
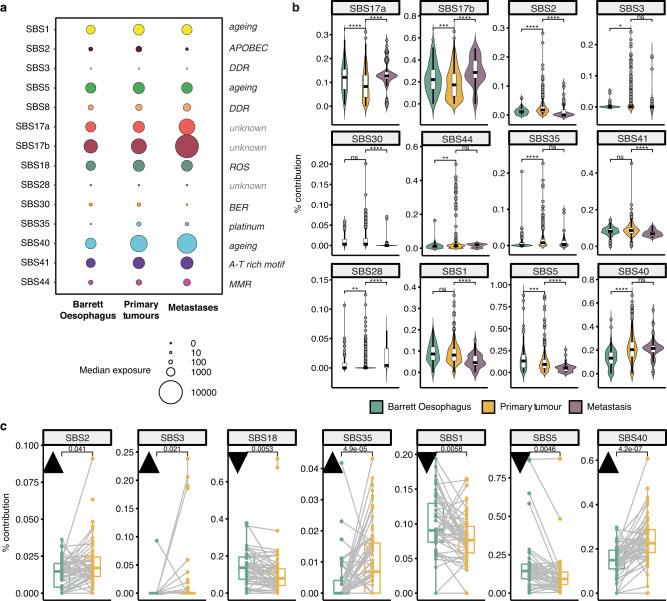
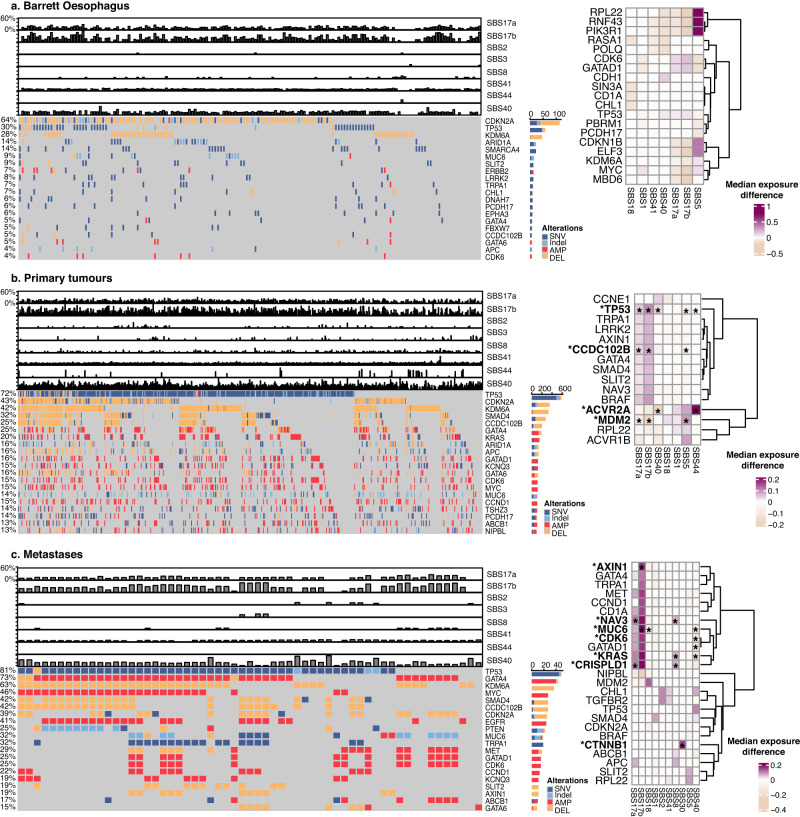
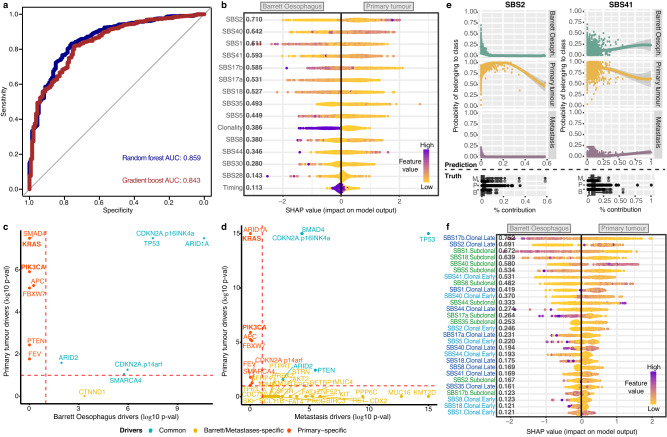
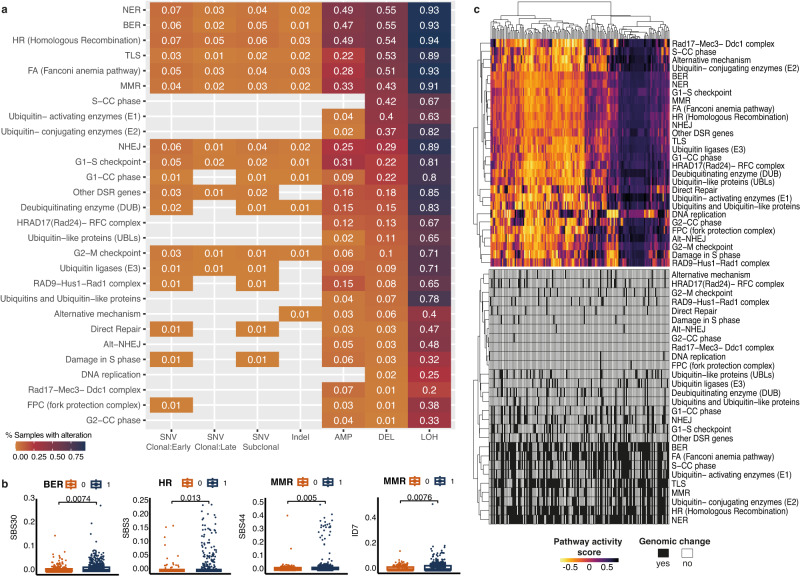
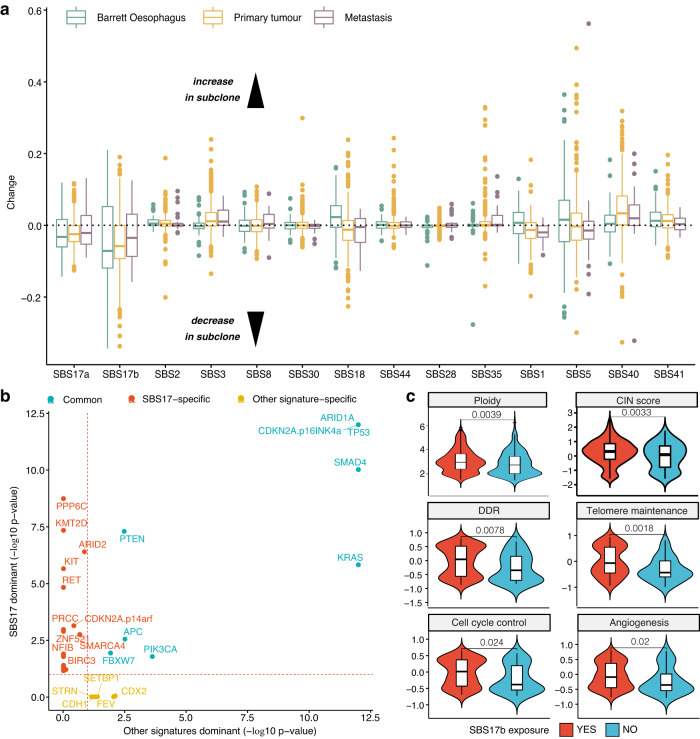
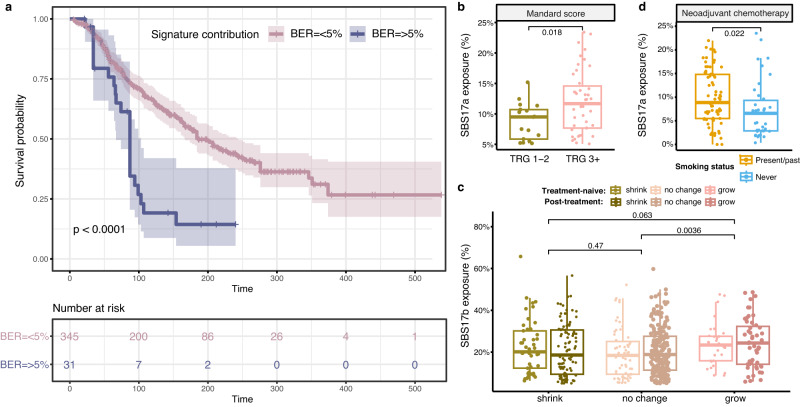
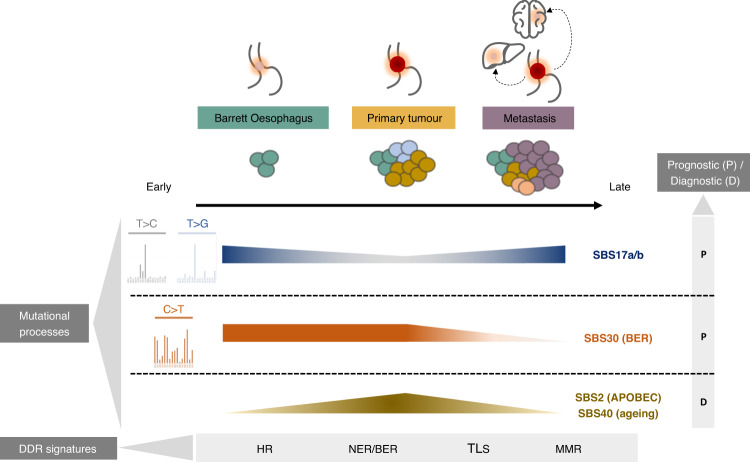
A variety of mutational processes drive cancer development, but their dynamics across the entire disease spectrum from pre-cancerous to advanced neoplasia are poorly understood. We explore the mutagenic processes shaping oesophageal adenocarcinoma tumorigenesis in 997 instances comprising distinct stages of this malignancy, from Barrett Oesophagus to primary tumours and advanced metastatic disease. The mutational landscape is dominated by the C[T > C/G]T substitution enriched signatures SBS17a/b, which are linked with TP53 mutations, increased proliferation, genomic instability and disease progression. The APOBEC mutagenesis signature is a weak but persistent signal amplified in primary tumours. We also identify prevalent alterations in DNA damage repair pathways, with homologous recombination, base and nucleotide excision repair and translesion synthesis mutated in up to 50% of the cohort, and surprisingly uncoupled from transcriptional activity. Among these, the presence of base excision repair deficiencies show remarkably poor prognosis in the cohort. In this work, we provide insights on the mutational aetiology and changes enabling the transition from pre-neoplastic to advanced oesophageal adenocarcinoma.


Conflict of interest statement

The authors declare no competing interests.

Figures

Fig. 1
Fig. 1. Study workflow.
Samples from pre-cancerous, primary and metastatic stages were whole-genome sequenced (WGS) and mutations were called (a). Mutations are timed and categorised into clonal early/late or subclonal (b) before mutational signature analysis (c). Finally, the dynamics of mutational processes are studied in relation to the clonal composition of the samples (d).
Fig. 2
Fig. 2. Mutational signature landscape across disease stages.
a The median prevalence of mutational signatures present identified in the three disease stages (Barrett Oesophagus, n = 161; primary tumours, n = 777; metastases, n = 59). The magnitude of the circles is proportional to the median number of mutations contributed by a specific signature to samples within a disease cohort. The causative factor underlying each signature is detailed to the right of the plot when known. DDR = DNA damage repair deficiency; ROS = reactive oxygen species; BER = base excision repair; MMR = mismatch repair deficiency. b Mutational signature contributions compared across the three disease conditions in non-matched, independently measured samples (Barrett Oesophagus, n = 114, green; primary tumours, n = 706, yellow; metastases, n = 55, purple). Only signatures that show a significant change in at least one disease stage are shown (signatures 8 and 18 were stable across disease stages). The centerline of boxes depicts the median values; the bottom and top box edges correspond to the first and third quartiles. The upper and lower whiskers extend from the hinges to the largest and smallest values, respectively, no further than 1.5* the inter-quartile range. Two-sided Wilcoxon signed-rank test p-values are displayed (not adjusted for multiple comparisons). Exact p-values are provided in the Source Data file. c Changes in mutational signature prevalence between matched Barrett Oesophagus (green) and primary tumour samples (yellow, n = 47). Black triangles pointing upwards denote an increase in signature contribution in primary tumours; triangles pointing downwards denote a decrease. The centerline of boxes depicts the median values; the bottom and top box edges correspond to the first and third quartiles. The upper and lower whiskers extend from the hinges to the largest and smallest values, respectively, no further than 1.5* the inter-quartile range. Two-sided Wilcoxon signed-rank test p-values are displayed (not adjusted for multiple comparisons). Only signatures with a significant change are shown. Source data are provided as a Source Data file.
Fig. 3
Fig. 3. Cancer drivers across disease stages and mutational signature prevalence.
The landscape of cancer driver events and their association with mutational signatures are depicted for (a) Barrett Oesophagus (n = 161), (b) primary tumours (n = 777) and (c) metastatic samples (n = 59). Left: The mutational and copy number alteration landscape of OAC drivers is shown in parallel with the contribution of key mutational signatures (top bar plots). The fraction of samples with alterations in a specific gene is shown on the left and in the bar plots on the right. Differennt alteration types are denoted with different colours. SNV = single nucleotide variant, AMP = amplification, DEL = deletion. Right: Heat maps depicting the increase (values >0) or decrease (values <0) in mutational signature prevalence in samples harbouring mutations or copy number changes in specific genes. The colour gradient indicates the median change in exposure compared to wild type. Only significant changes of >10% (in either direction) are depicted with Wilcoxon rank-sum two-sided test p-value <0.05. Stars indicate associations that are still significant after FDR multiple testing correction. Source data are provided as a Source Data file (including p-values).
Fig. 4
Fig. 4. Mutational processes and driver events distinguishing primary tumours from Barrett Oesophagus genomes.
a Performance of the gradient boosting and random forest signature-based classifiers in distinguishing between Barrett Oesophagus and primary tumours. The area under the curve (AUC) is indicated for either model. b Output of xgboost model distinguishing Barrett Oesophagus from primary tumours based on overall signature prevalence, while accounting for clonality and timing. Features are ordered according to their ranking in the model (top ranking features first). Every dot is a sample and the colour corresponds to the signature contribution in that sample, ranging from purple (highest contribution of the respective signature across the cohort) to yellow (lowest contribution of the respective signature). For ‘clonality’/‘timing’ purple denotes clonal/early and yellow denotes subclonal/late. c Genes positively selected in primary tumours versus Barrett Oesophagus. Genes commonly positively selected in all tumours are highlighted in blue. Genes positively selected only in the primary tumour group are highlighted in red, only in Barrett Oesophagus in yellow. KRAS and PIK3CA mutational events, specific to primary tumours, are highlighted in bold. The log likelihood-ratio test p-values are reported, adjusted for multiple testing using the Benjamini-Hochberg method. d Genes positively selected in primary tumours versus metastases are shown similarly as in (c). The log likelihood-ratio test p-values are reported, adjusted for multiple testing (Benjamini-Hochberg method). e Multinomial regression classifier results distinguishing Barrett Oesophagus, primary tumours and metastases based on signature prevalence. The predictive power of SBS 2 and 41 in distinguishing primary tumours is exemplified. The top panel shows the predicted disease stage depending on increasing mutational signature prevalence. The bottom panel shows the true distribution of mutational contributions for the selected signatures among three stages, with the centerline of boxes depicting the median exposure, the bottom and top box the first and third quartiles, and upper and lower whiskers extending from the hinges to the largest and smallest values, respectively, no further than 1.5* the inter-quartile range. (M = metastasis; P = primary tumour; B = Barrett Oesophagus). The curves in the prediction model were fitted with a loess function (shaded areas depict the 95% confidence interval). f Output of xgboost model distinguishing Barrett Oesophagus from primary tumours based on detailed signature contributions split by clonality and timing. Early clonal events ar depicted in light blue, late clonal events in dark blue and subclonal events in green. The individual dots are coloured as described in (b). Source data are provided as a Source Data file.
Fig. 5
Fig. 5. DNA damage repair drivers and downstream transcriptional activity.
a SNVs, indels and copy number changes affecting DDR pathways. The heat map highlights the fraction of primary tumour samples (n = 777) with a specific type of change in each pathway and rows are ordered by decreasing fractions of deletions in pathway. Increasing fractions of alterations are denoted by a colour gradient from orange to purple. AMP = amplification, DEL = deletion, LOH = loss of heterozygosity. b SNV and indel signature contributions compared between samples with (1) and without (0) a specific DDR defect (n = 771 independent samples with BER defects and n = 226 without; n = 773 independent samples with HR defects and n = 224 without; n = 769 independent samples with MMR defects and n = 228 without). The centerline of boxes depicts the median values; the bottom and top box edges correspond to the first and third quartiles. The upper and lower whiskers extend from the hinges to the largest and smallest values, respectively, no further than 1.5* the inter-quartile range. Two-sided Wilcoxon signed-rank test p-values are displayed. All plots confirm increased signature contributions when the pathway is mutated. c Top heat map: Sample by sample activity in every DDR-related pathway as measured from expression of genes implicated in the pathway using GSVA, displayed for n = 203 profiled primary tumour samples. The colour gradient varies according to the pathway activity score. Bottom heat map: Prevalence of SNV/indel and copy number changes for the same samples in the respective pathway (black = altered, white = non-altered). Source data are provided as a Source Data file.
Fig. 6
Fig. 6. Tumour clonal heterogeneity reveals widespread SBS17 shifts that correlate with changes in cellular phenotypes.
a Changes in signature exposure in tumour subclones. Values below 0 indicate a decrease in signature exposure in the sublones, values above 0 an increase. Signatures SBS17a and b are the only ones showing a dominant decrease across Barrett (n = 89, green), primary (n = 512, yellow) and metastatic (n = 38, purple) stages. Box boundaries represent first and third quartiles, centerline indicates median values. The upper and lower whiskers extend from the hinges to the largest and smallest values, respectively, no further than 1.5* the inter-quartile range. Outlier points are plotted individually. b Positively selected genes in primary tumours with a dominant SBS17 signature versus the ones positively selected in tumours with other dominant signatures. Genes commonly positively selected in both categories are highlighted in blue. Genes positively selected only in the SBS17 dominant group are highlighted in red. c The presence of SBS17b is associated with an increase in ploidy and chromosomal instability (CIN), as well as higher activity of telomere maintenance, DNA damage repair (DDR), cell cycle control and angiogenesis pathways. The YES category (red) denotes samples with SBS17b exposure >5% (n = 831 for genomic measurements; n = 167 for transcriptional hallmarks), while the NO category (blue) refers to exposures <=5% (n = 164 for genomic measurements; n = 36 for transcriptional hallmarks). Box boundaries represent first and third quartiles, centerline indicates median values. The upper and lower whiskers extend from the hinges to the largest and smallest values, respectively, no further than 1.5* the inter-quartile range. Two-sided Wilcoxon signed-rank test p-values are displayed. Source data are provided as a Source Data file.
Fig. 7
Fig. 7. Associations between mutational signatures and clinical outcomes.
a Patients with a BER signature prevalence >5% have a significantly worse overall survival outcome, as depicted by Cox proportional hazards analysis (Cox model log-rank p = 7.3e-06). The shaded areas depict the 95% confidence intervals. The log-rank test p-value is reported. The number of patients at risk at various time intervals are shown in the table below. b Prevalence of the SBS17a signature in treatment naïve tumours, compared between patients with Mandard scores TRG 1-2 (n = 17) versus TRG 3 or higher (TRG 3 + , n = 43). The centerline of boxes depicts the median values; the bottom and top box edges correspond to the first and third quartiles. The upper and lower whiskers extend from the hinges to the largest and smallest values, respectively, no further than 1.5* the inter-quartile range. A two-sided Wilcoxon signed-rank test p-value is displayed. c Prevalence of the SBS17b signature in tumours that shrunk (n = 145), showed no change (n = 242) or grew (n = 83) after surgery. The change in tumour volume (T stage) was calculated from pre-treatment staging to post-therapy resection pathology staging. The tumours are further split based on whether the sequencing was performed on the treatment-naïve (n = 136) or post-treatment (n = 334) sample. No major differences are observed based on treatment status, but an increase in SBS17b is seen in tumours growing after surgery. The groups are coloured according to treatment and volume change. Box boundaries represent first and third quartiles, centerline indicates median values. The upper and lower whiskers extend from the hinges to the largest and smallest values, respectively, no further than 1.5* the inter-quartile range. Two-sided Wilcoxon signed-rank test p-values are displayed. d SBS17a signature prevalence in post-treatment tumour samples from non-responders to neoadjuvant chemotherapy (i.e., patients showing stable or progressive disease), compared between present/past smokers (n = 71, orange) and never smokers (n = 38, blue). Higher SBS17a contributions are observed in smokers. Box boundaries represent first and third quartiles, centerline indicates median values. The upper and lower whiskers extend from the hinges to the largest and smallest values, respectively, no further than 1.5* the inter-quartile range. A two-sided Wilcoxon signed-rank test p-value is displayed. Source data are provided as a Source Data file.
Fig. 8
Fig. 8. Key genomic signatures underlying distinct exposures, expansion and outcomes during OAC evolution from pre-cancerous to advanced disease.
SBS17a/b processes show a relative decrease in the primary tumours compared to Barrett and metastasis cases, and can be used as markers of transformation early within Barrett Oesophagus. Frequent subclonal changes appear for this signature. SBS30 appears elevated in Barrett Oesophagus and primary tumours, and is linked with worse survival. Several signatures including SBS2 and SBS40 are most highly represented in primary tumours and can be used to distinguish this stage. DDR signatures specifically elevated at distinct points during OAC evolution are also highlighted. Links between signatures and prognosis/diagnosis are highlighted: SBS17a/b presence marks increased proliferation and progression after treatment, SBS30 is associated with worse prognosis, while SBS2 and SBS40 signatures could be used to specifically distinguish (diagnose) primary tumours. P = prognosis, D = diagnosis; HR = homologous recombination; NER = nucleotide excision repair; BER = base excision repair; TLS = translesion synthesis; MMR = mismatch repair.

References

    1. Collaborators GOC. The global, regional, and national burden of oesophageal cancer and its attributable risk factors in 195 countries and territories, 1990-2017: a systematic analysis for the global burden of disease study 2017. Lancet Gastroenterol. Hepatol. 2020;5:582–597. doi: 10.1016/S2468-1253(20)30007-8. - DOI - PMC - PubMed
    1. Ho ALK, Smyth EC. A global perspective on oesophageal cancer: two diseases in one. Lancet Gastroenterol. Hepatol. 2020;5:521–522. doi: 10.1016/S2468-1253(20)30047-9. - DOI - PubMed
    1. Cunningham D, Okines AF, Ashley S. Capecitabine and oxaliplatin for advanced esophagogastric cancer. N. Engl. J. Med. 2010;362:858–859. doi: 10.1056/NEJMc0911925. - DOI - PubMed
    1. Cook MB, et al. Gastroesophageal reflux in relation to adenocarcinomas of the esophagus: a pooled analysis from the Barrett’s and Esophageal Adenocarcinoma Consortium (BEACON) PLoS One. 2014;9:e103508. doi: 10.1371/journal.pone.0103508. - DOI - PMC - PubMed
    1. Anderson LA, et al. Risk factors for Barrett’s oesophagus and oesophageal adenocarcinoma: results from the FINBAR study. World J. Gastroenterol. 2007;13:1585–1594. doi: 10.3748/wjg.v13.i10.1585. - DOI - PMC - PubMed

Publication types

Supplementary concepts