

A large-scale Boolean model of the rheumatoid arthritis fibroblast-like synoviocytes predicts drug synergies in the arthritic joint
- PMID: 37454172
- PMCID: PMC10349856
- DOI: 10.1038/s41540-023-00294-5
A large-scale Boolean model of the rheumatoid arthritis fibroblast-like synoviocytes predicts drug synergies in the arthritic joint
Abstract
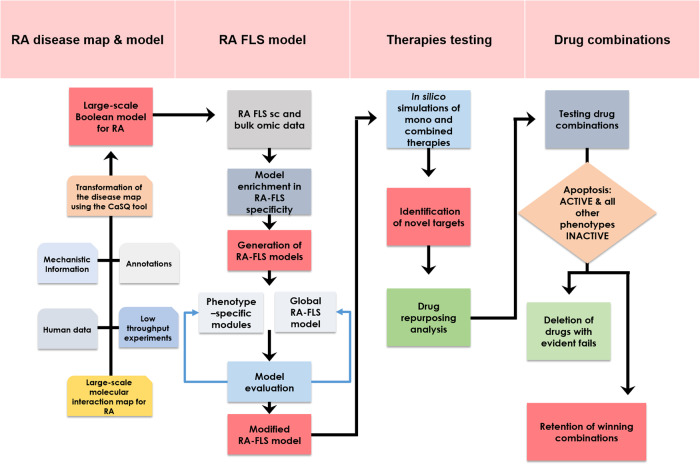
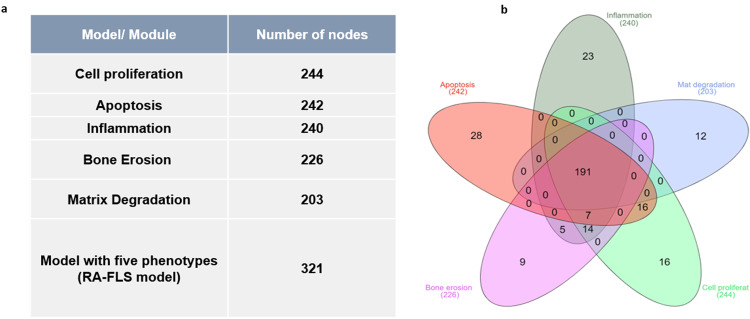
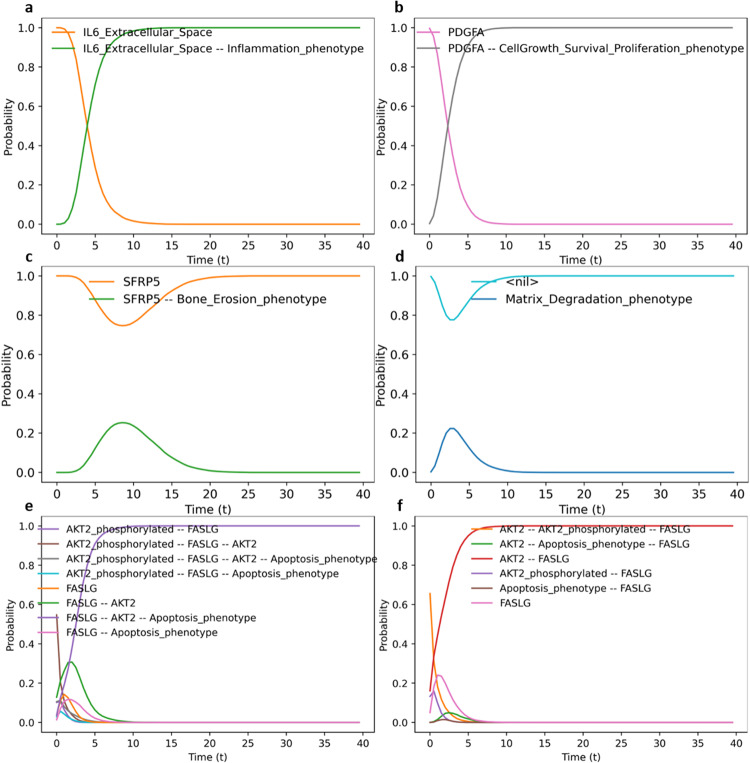
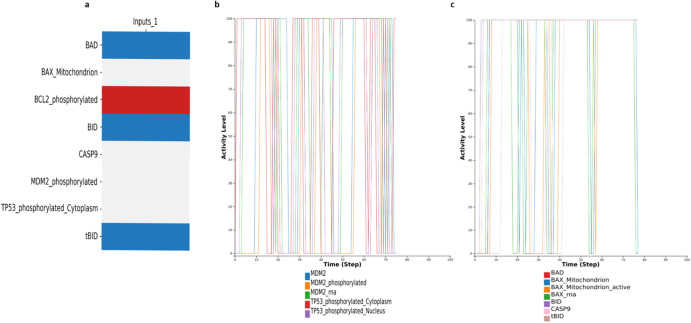
Rheumatoid arthritis (RA) is a complex autoimmune disease with an unknown aetiology. However, rheumatoid arthritis fibroblast-like synoviocytes (RA-FLS) play a significant role in initiating and perpetuating destructive joint inflammation by expressing immuno-modulating cytokines, adhesion molecules, and matrix remodelling enzymes. In addition, RA-FLS are primary drivers of inflammation, displaying high proliferative rates and an apoptosis-resistant phenotype. Thus, RA-FLS-directed therapies could become a complementary approach to immune-directed therapies by predicting the optimal conditions that would favour RA-FLS apoptosis, limit inflammation, slow the proliferation rate and minimise bone erosion and cartilage destruction. In this paper, we present a large-scale Boolean model for RA-FLS that consists of five submodels focusing on apoptosis, cell proliferation, matrix degradation, bone erosion and inflammation. The five-phenotype-specific submodels can be simulated independently or as a global model. In silico simulations and perturbations reproduced the expected biological behaviour of the system under defined initial conditions and input values. The model was then used to mimic the effect of mono or combined therapeutic treatments and predict novel targets and drug candidates through drug repurposing analysis.
© 2023. The Author(s).
Conflict of interest statement
The authors declare no competing interests.
Figures

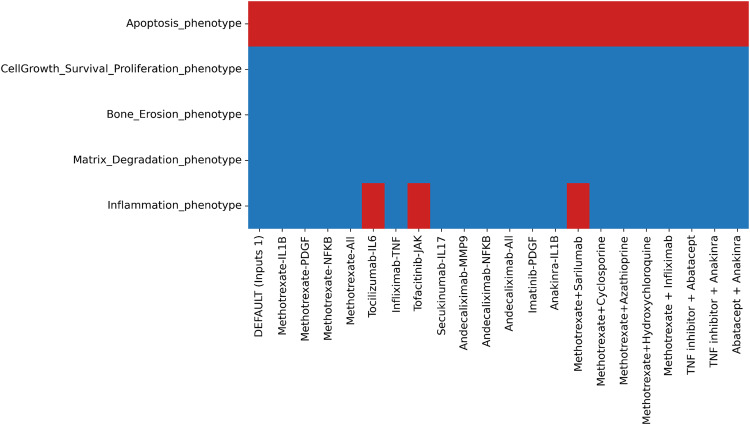
 , 0 (OFF)
  , 1 (ON)
  . Expectation graph colour codes: Score: expected value, obtained value; 1: Yes [OFF, OFF & ON, ON]
  ; 0: No [ON, OFF & OFF, ON (conflict)]
  , -1: Undefined
  .
.
References
MeSH terms
LinkOut - more resources
Full Text Sources
Medical
