. 2023 Jul 15;14(1):4233.
doi: 10.1038/s41467-023-39961-w.

Structural basis for specific RNA recognition by the alternative splicing factor RBM5

Affiliations

Structural basis for specific RNA recognition by the alternative splicing factor RBM5

Komal Soni et al. Nat Commun. .

Abstract

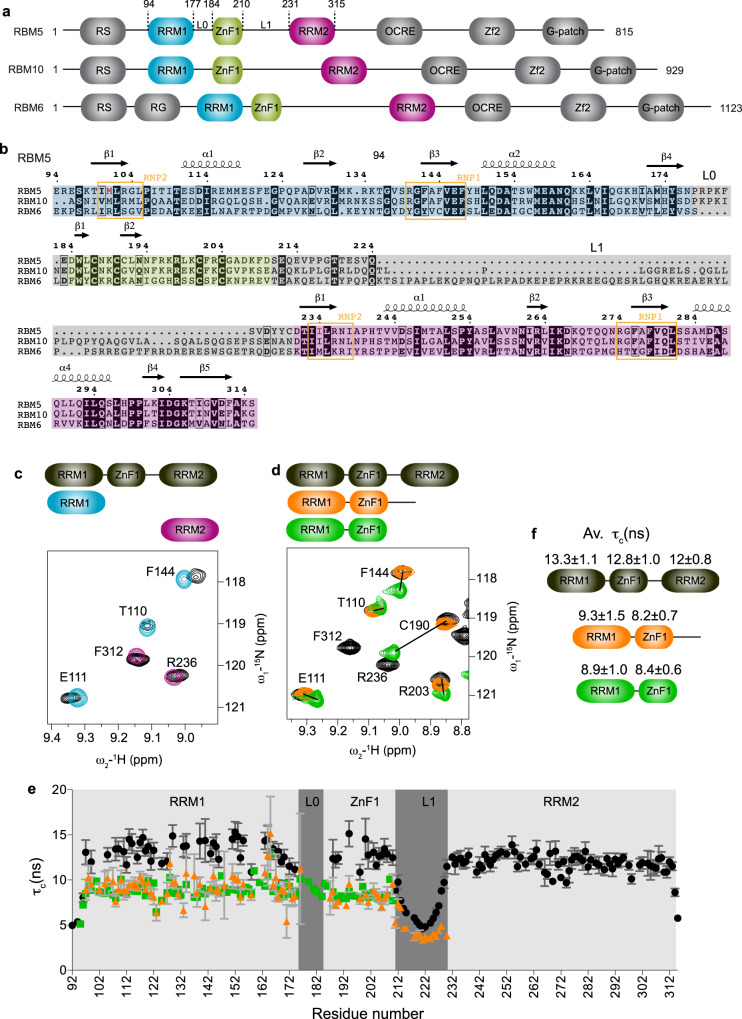
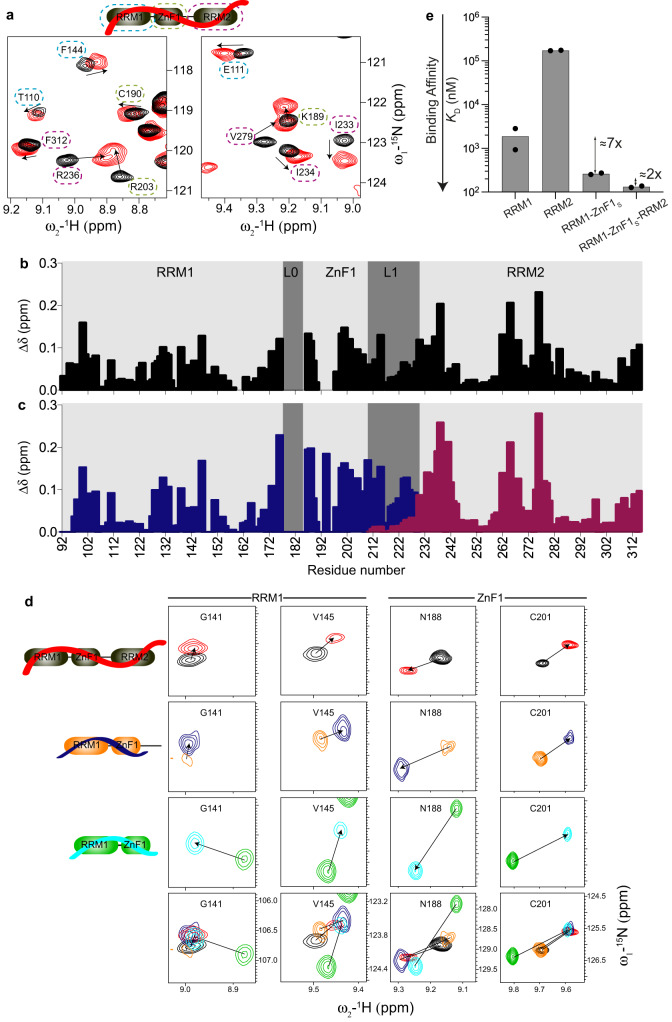
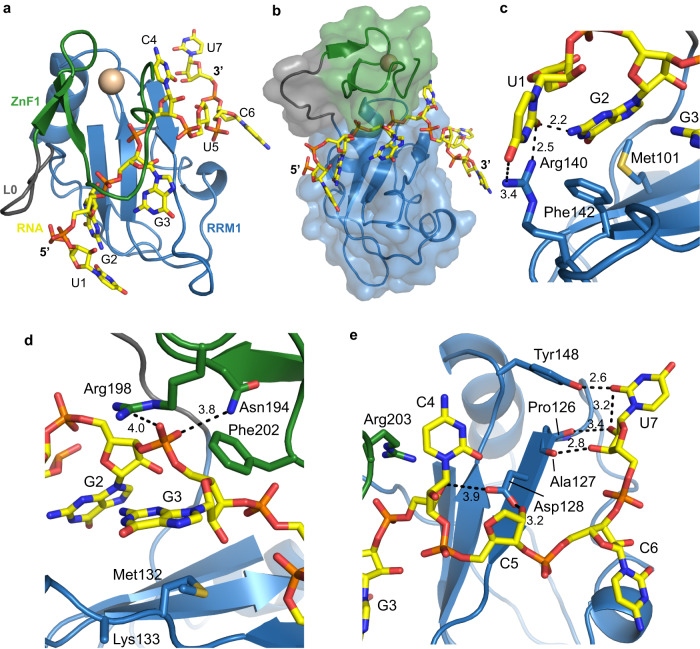
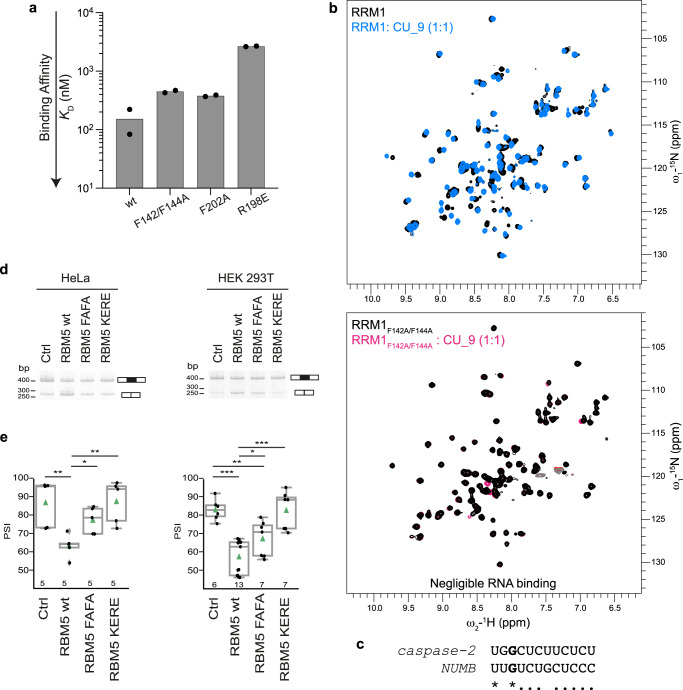
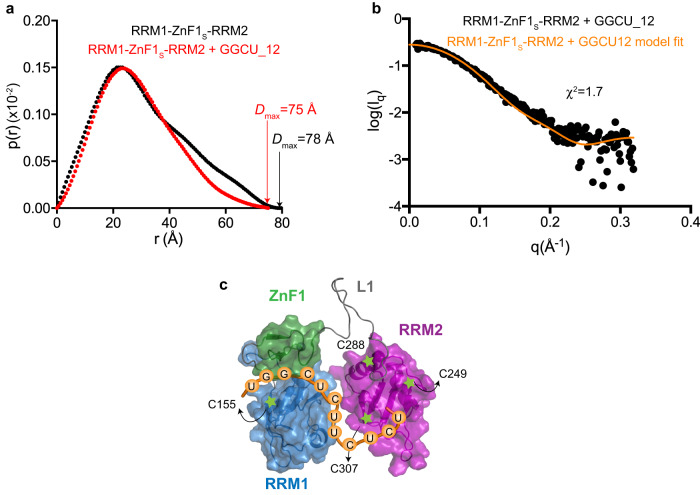
The RNA-binding motif protein RBM5 belongs to a family of multi-domain RNA binding proteins that regulate alternative splicing of genes important for apoptosis and cell proliferation and have been implicated in cancer. RBM5 harbors structural modules for RNA recognition, such as RRM domains and a Zn finger, and protein-protein interactions such as an OCRE domain. Here, we characterize binding of the RBM5 RRM1-ZnF1-RRM2 domains to cis-regulatory RNA elements. A structure of the RRM1-ZnF1 region in complex with RNA shows how the tandem domains cooperate to sandwich target RNA and specifically recognize a GG dinucleotide in a non-canonical fashion. While the RRM1-ZnF1 domains act as a single structural module, RRM2 is connected by a flexible linker and tumbles independently. However, all three domains participate in RNA binding and adopt a closed architecture upon RNA binding. Our data highlight how cooperativity and conformational modularity of multiple RNA binding domains enable the recognition of distinct RNA motifs, thereby contributing to the regulation of alternative splicing. Remarkably, we observe surprising differences in coupling of the RNA binding domains between the closely related homologs RBM5 and RBM10.


Conflict of interest statement

The authors declare no competing interests.

Figures

Fig. 1
Fig. 1. Structural characterization of RBM5 RRM1-ZnF1 tandem domains.
a Domain organization and b multiple sequence alignment of human RBM5, RBM6, and RBM10 proteins. RNP2 and RNP1 motifs of RRM1 and RRM2 are boxed in orange and domain boundaries of RRM1, ZnF1, and RRM2 are highlighted in blue, green, and pink, respectively. Linkers L0 and L1 connecting RRM1-ZnF1 and ZnF1-RRM2, respectively are highlighted in gray. The non-canonical hydrophobic residues found instead of the canonical aromatic residues in RNP2 motif of both RBM5 RRM1 and RRM2 domains are colored in red. c Overlay of 1H-15N HSQC spectra of three RRM1-ZnF1S-RRM2 domains construct (black) and single RRM1 (light blue) and RRM2 (purple) domains. d Overlay of 1H-15N-HSQC spectra of the three RRM1-ZnF1S-RRM2 domains construct (black) with that of RRM1-ZnF1S-L1 (orange) and RRM1-ZnF1S (green). Zoomed representative residues are shown. e Tumbling correlation time τc values (calculated from the ratio of 15N R2/R1 relaxation rates) are plotted vs. residue number for RRM1-ZnF1S-RRM2 (black), RRM1-ZnF1S-L1 (orange) and RRM1-ZnF1S (green) and their domain-wise average τc values ± SD are indicated in f. Error bars are derived from relaxation data. Source data are provided as a Source Data file.
Fig. 2
Fig. 2. RNA binding by RRM1-ZnF1-RRM2 domains of RBM5 and individual domain contributions.
a Overlay of 1H-15N HSQC spectra of RRM1-ZnF1S-RRM2 free (black) and bound to GGCU_12 RNA (red). Zoomed views of representative residues of RRM1 (blue), ZnF1 (green), and RRM2 (purple) are marked with dashed lines. b Chemical shift perturbations in RRM1-ZnF1S-RRM2 (black) upon binding to GGCU_12 RNA at ratio of 1:1.1 (protein:RNA) vs. residue number are shown. c Chemical shift perturbations in RRM1-ZnF1S-L1 (blue) and L1-RRM2 (maroon) upon binding to GGCU_12 RNA at ratios of 1:1.3 or 1:2 (protein:RNA) respectively vs. residue number are shown. d RNA binding by RRM-ZnF1S-RRM2, RRM1-ZnF1S-L1, and RRM1-ZnF1S is similar. Zoomed views of 1H-15N HSQC spectra showing representative residues of RRM1 and ZnF1 of RRM-ZnF1S-RRM2 -/+ GGCU_12 (black, red), RRM1-ZnF1S-L1 -/+ GGCU_12 (orange, blue), and RRM1-ZnF1S -/+ GGCU_12 (green, cyan) are presented. e ITC-derived binding affinities of RRM1, RRM2, RRM1-ZnF1S, and RRM1-ZnF1S-RRM2 for GGCU_12 RNA show an increase in binding affinity with the addition of the individual domains. The bar plot shows the calculated dissociation constant (KD) from an average of two measurements and the individual data points are shown as black dots. Source data are provided as a Source Data file.
Fig. 3
Fig. 3. Structural characterization of RRM1-ZnF1-RNA complex.
a Structure of RRM1-ZnF1S bound to GGCU_10 RNA in top view. RRM1, L0, ZnF1, and RNA are shown in blue, gray, green, and yellow respectively. The Zn2+ ion coordinated by the ZnF1 is shown in gold. b Surface representation of the tandem RRM1-ZnF1s domains. ce Zoomed in views of the protein–RNA interface focusing on interactions between RRM1-ZnF1S and RNA nucleotides at positions (c, d) 1–3 and (e) 4–7, respectively. Hydrogen bonds are shown as dotted lines and distances are indicated in Å. See Supplementary Fig. 6 for F0−Fc omit maps.
Fig. 4
Fig. 4. Mutational analysis of RRM1-ZnF1.
a RNA binding contribution of specific residues of RRM1 and ZnF1, as probed by measuring binding affinity of RRM1-ZnF1 point mutants to GGCU_12 RNA using ITC. The bar plot shows the calculated dissociation constant (KD) from an average of two measurements and the individual data points are shown as black dots. b A superposition of 1H-15N HSQC spectra of RRM1 wild-type in free (black) and in presence of CU_9 RNA (sky blue) at a protein:RNA ratio of 1:1 is shown in the upper panel. A double mutant in RRM1 RNP1 residues (F142A/F144A) does not bind RNA as seen by a superposition of 1H-15N HSQC spectra of RRM1F142A/F144A mutant in free (black) and in presence of CU_9 RNA (pink) at a protein:RNA ratio of 1:1 in the lower panel. c Sequence alignment of caspase-2 derived RNA sequence used for in vitro studies and the RBM10 binding CLIP-Seq consensus motifs used for the construction of NUMB minigene reporter. (*) indicates identity and (.) indicates similarity due to a pyrimidine to pyrimidine substitution. d HeLa and HEK 293T cells were co-transfected with RG6-NUMB alternative splicing reporter and T7-RBM5 vectors expressing wild type or RNA binding affinity mutants in the RRM1 (F142A/F144A->FAFA) or ZnF1 (K197E/R197E->KERE) or control vector, as indicated. Pattern of alternative splicing isoforms was detected by RT-PCR using primers complementary to vector sequences flanking exons of the RG6-NUMB minigene; the positions of the amplification products corresponding to exon 9 inclusion/skipping are indicated. The results correspond to one representative replicate of the experiment. Uncropped gels are provided in Source Data. e Quantifications of alternatively spliced isoforms shown in panel d for the number of biological replicate experiments indicated at the bottom of each bar were used to generate the boxplots shown (bottom panel). The box represents the interquartile range from the 25th percentile to the 75th percentile, the median is represented by the line in the box. The whiskers represent the minimal and maximal values and the outliers are plotted as gray diamonds. The means are indicated with the green triangles, each black dot represents a biological replicate. T-test (two-tailed distribution, homoscedastic) results are indicated (*<0.05, **<0.01; ***<0.001). Source data are provided as a Source Data file.
Fig. 5
Fig. 5. Domain arrangement of RRM1-ZnF1-RRM2.
a Comparison of SAXS p(r) curves showing maximum pairwise distribution of RRM1-ZnF1S-RRM2 free (black) and in complex with GGCU_12 RNA (red). Dmax is indicated for the respective SAXS curves. b The fit between experimental SAXS data for RRM1-ZnF1S-RRM2 bound to GGCU_12 RNA against the simulated data from the top PRE-based model is plotted, as obtained using Crysol software, the χ2 value is indicated. c Structural model of RRM1-ZnF1S-RRM2 in the presence of RNA, as calculated based on PRE and SAXS data. Positions of spin labels are marked and the domains are shown in surface representation. Source data are provided as a Source Data file.

References

    1. Cooper TA, Wan L, Dreyfuss G. RNA and disease. Cell. 2009;136:777–793. doi: 10.1016/j.cell.2009.02.011. - DOI - PMC - PubMed
    1. David CJ, Manley JL. Alternative pre-mRNA splicing regulation in cancer: pathways and programs unhinged. Genes Dev. 2010;24:2343–2364. doi: 10.1101/gad.1973010. - DOI - PMC - PubMed
    1. Wang GS, Cooper TA. Splicing in disease: disruption of the splicing code and the decoding machinery. Nat. Rev. Genet. 2007;8:749–761. doi: 10.1038/nrg2164. - DOI - PubMed
    1. Scotti MM, Swanson MS. RNA mis-splicing in disease. Nat. Rev. Genet. 2016;17:19–32. doi: 10.1038/nrg.2015.3. - DOI - PMC - PubMed
    1. Tazi J, Bakkour N, Stamm S. Alternative splicing and disease. Biochim. Biophys. Acta. 2009;1792:14–26. doi: 10.1016/j.bbadis.2008.09.017. - DOI - PMC - PubMed

Publication types