. 2023 Jul 25;42(7):112792.
doi: 10.1016/j.celrep.2023.112792. Epub 2023 Jul 16.

ATR protects ongoing and newly assembled DNA replication forks through distinct mechanisms

Affiliations

ATR protects ongoing and newly assembled DNA replication forks through distinct mechanisms

Wendy Leung et al. Cell Rep. .

Abstract

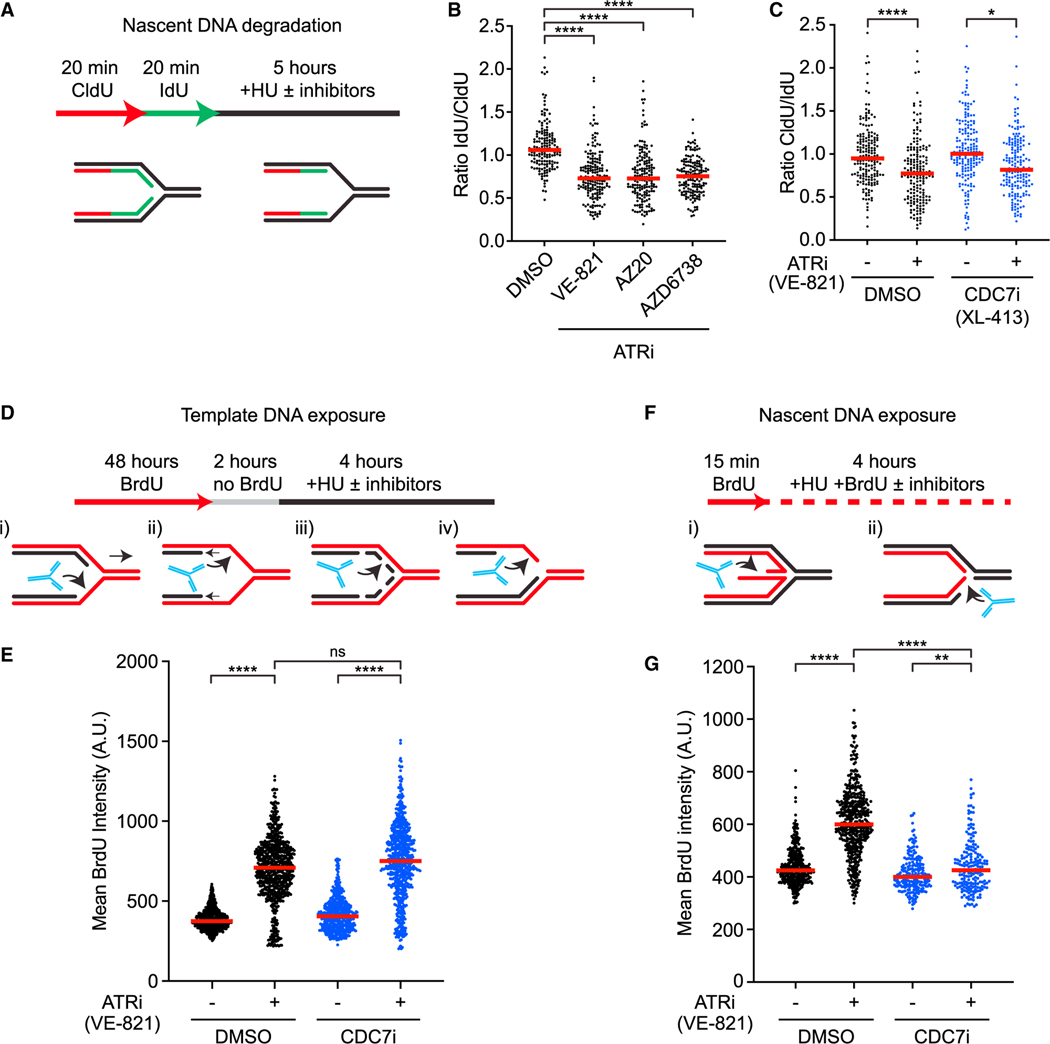
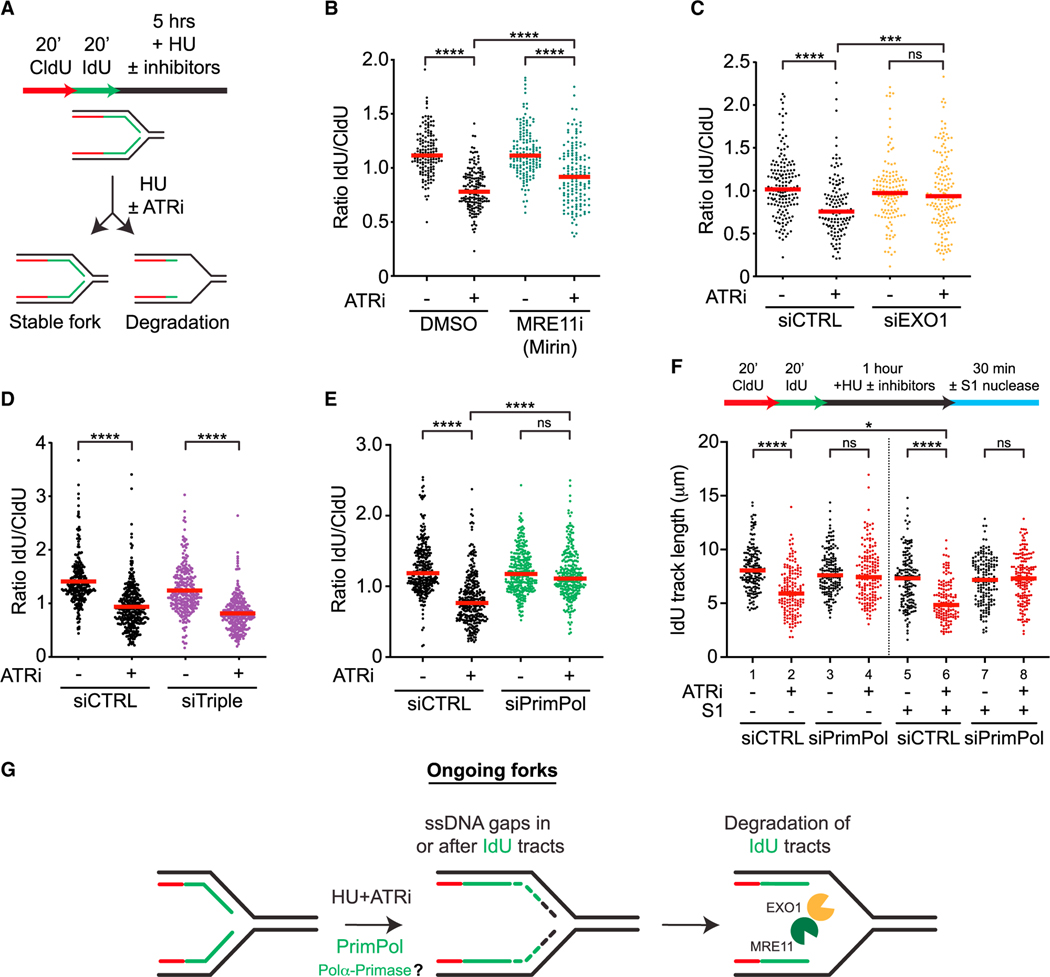
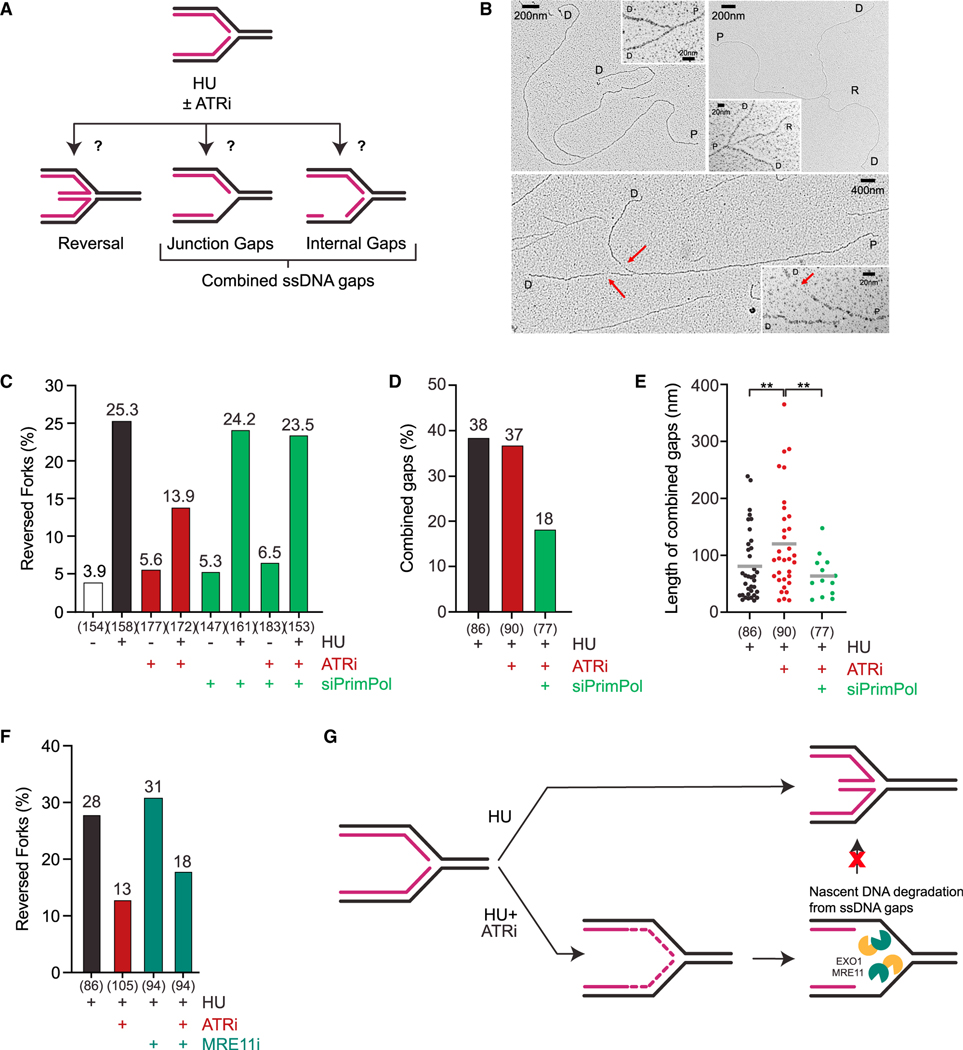
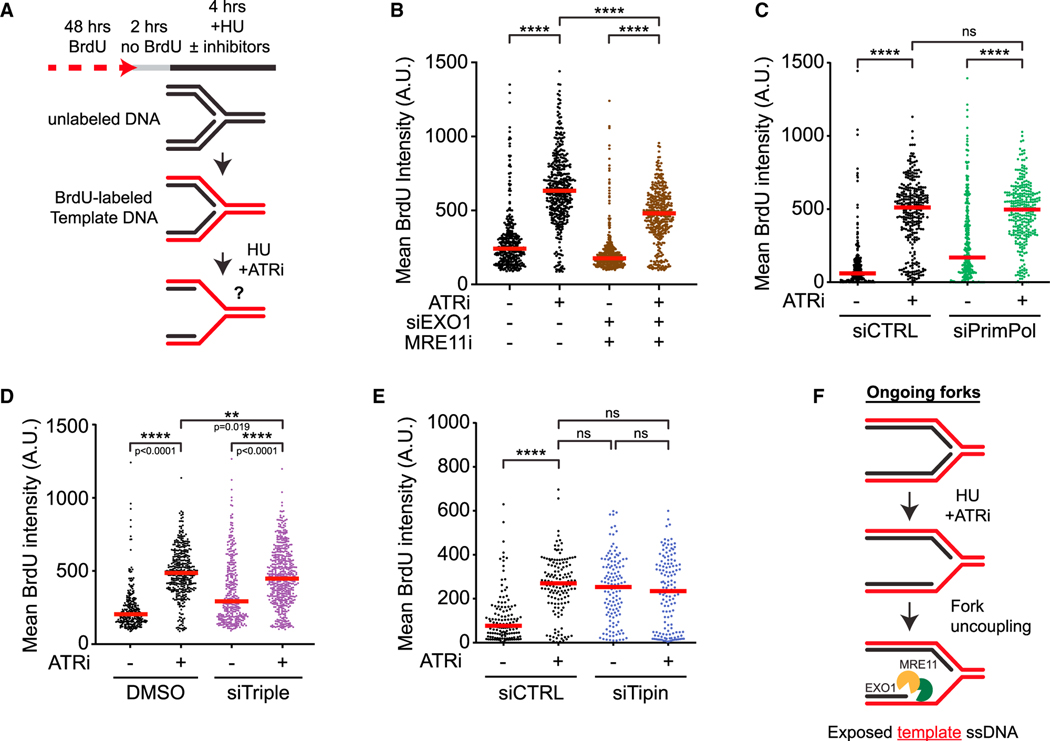
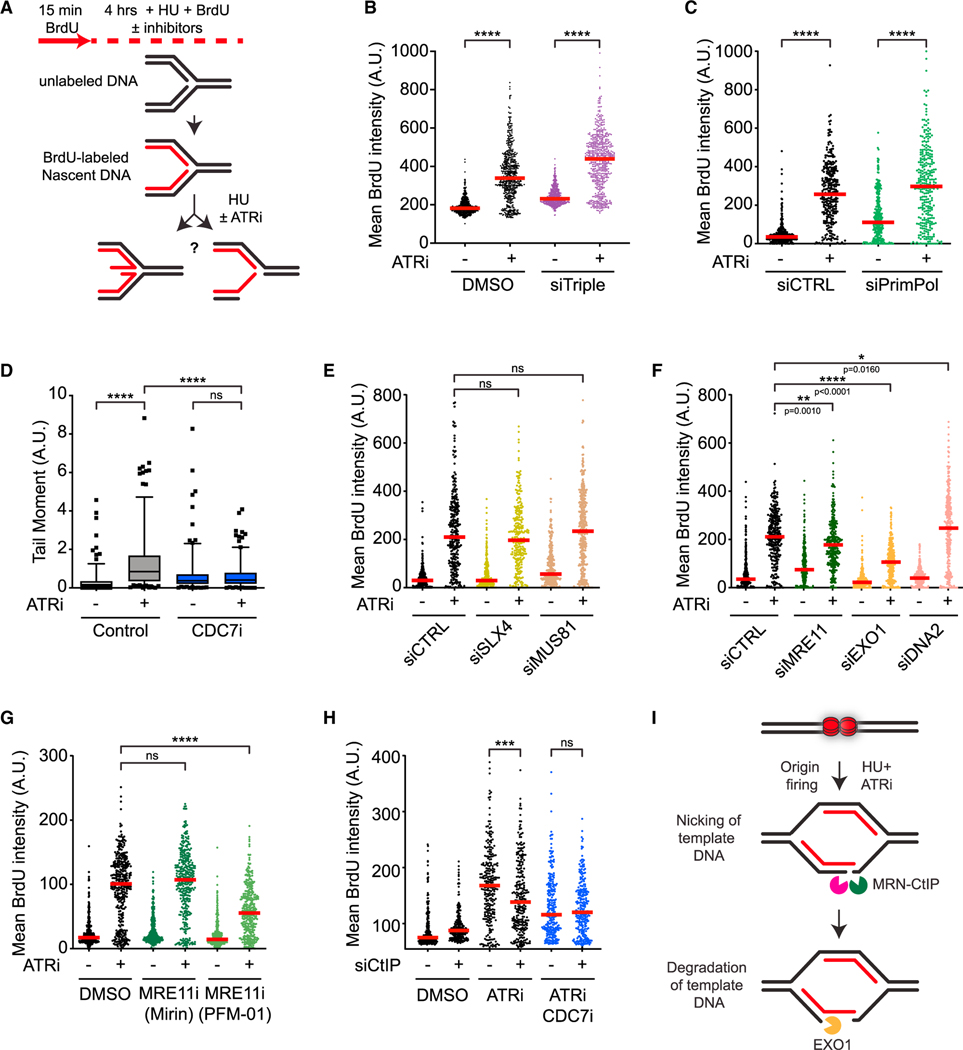
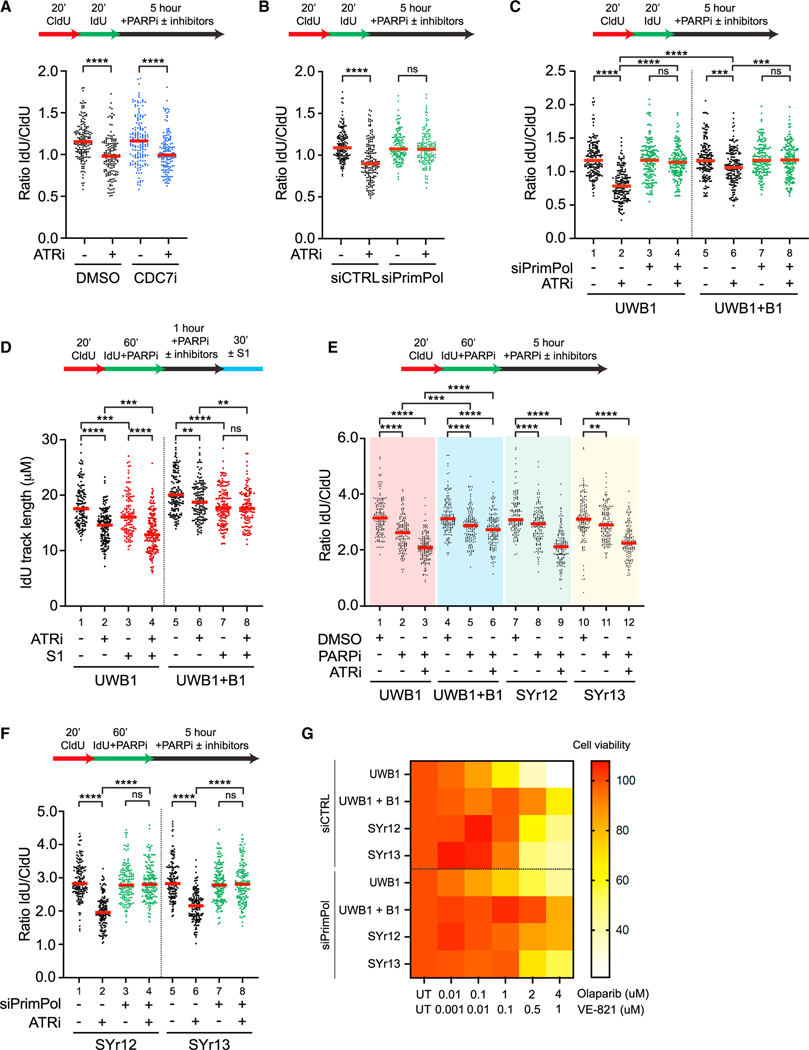
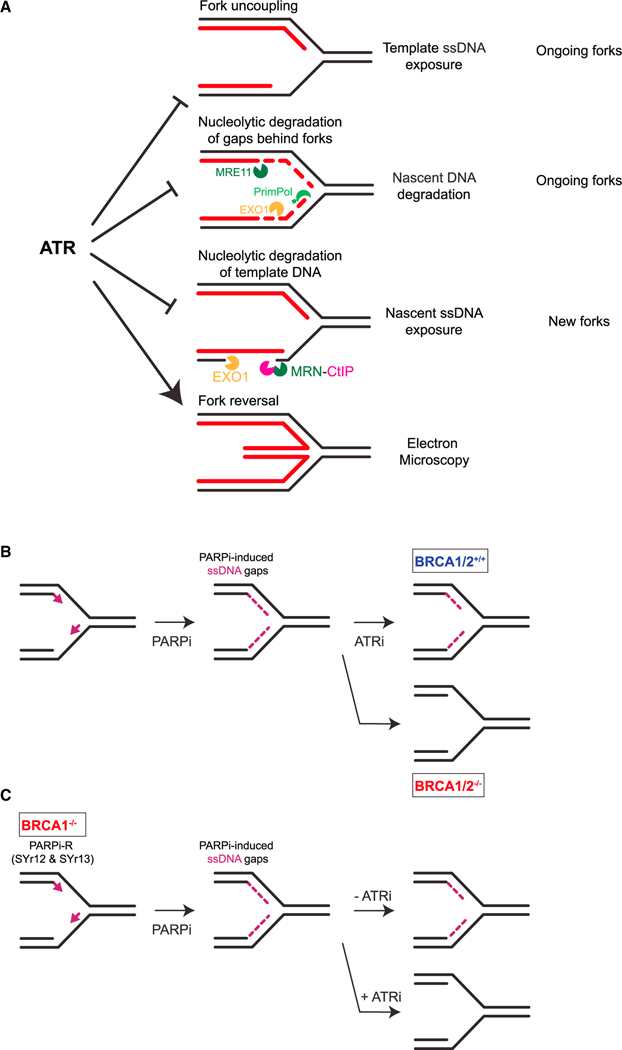
The ATR kinase safeguards genomic integrity during S phase, but how ATR protects DNA replication forks remains incompletely understood. Here, we combine four distinct assays to analyze ATR functions at ongoing and newly assembled replication forks upon replication inhibition by hydroxyurea. At ongoing forks, ATR inhibitor (ATRi) increases MRE11- and EXO1-mediated nascent DNA degradation from PrimPol-generated, single-stranded DNA (ssDNA) gaps. ATRi also exposes template ssDNA through fork uncoupling and nascent DNA degradation. Electron microscopy reveals that ATRi reduces reversed forks by increasing gap-dependent nascent DNA degradation. At new forks, ATRi triggers MRE11- and CtIP-initiated template DNA degradation by EXO1, exposing nascent ssDNA. Upon PARP inhibition, ATRi preferentially exacerbates gap-dependent nascent DNA degradation at ongoing forks in BRCA1/2-deficient cells and disrupts the restored gap protection in BRCA1-deficient, PARP-inhibitor-resistant cells. Thus, ATR protects ongoing and new forks through distinct mechanisms, providing an extended view of ATR's functions in stabilizing replication forks.

Keywords: ATR; BRCA; CP: Molecular biology; PARP inhibitor; gaps; replication; replication fork; single-stranded DNA.


Conflict of interest statement

Declaration of interests The authors declare no competing interests.

Figures

Figure 1.
Figure 1.. ATR suppresses distinct HU-induced alterations at ongoing and new replication forks
(A) Cells are sequentially labeled with thymidine analogs CldU (50 μM) and IdU (100 μM) and incubated in 4 mM hydroxyurea (HU) for 5 h. Samples are then processed for fiber assay analysis. (B) Cells were treated as in (A) with three ATR inhibitors: VE-821 (10 μM), AZ20 (1 μM), and AZD6738 (5 μM). Number (n) of fibers quantified >450 across three biological replicates. Significance was calculated using the Mann-Whitney Ranked Sum Test with ****p < 0.0001. (C) Cells were analyzed as in (A) in the presence or absence of CDC7i (XL-413, 5 μM) and ATRi (VE-821, 10 μM). Number (n) of fibers quantified >300 across two biological replicates. Significance was calculated using the Mann-Whitney Ranked Sum Test with *p < 0.05, ****p < 0.0001. (D) Cells are first labeled for 48 h with 20 μM BrdU, and then incubated in media without BrdU for 2 h before treatment with 4 mM HU for 4 h. Samples are then processed for immunofluorescence detection of PCNA and BrdU in non-denaturing conditions. Only PCNA-positive, S phase cells are selected for the analysis. (E) Cells were analyzed as depicted in (D) in the presence or absence of ATRi (VE-821, 10 mM) and CDC7i (XL-413, 5 μM). Number (n) of nuclei quantified >500 across three biological replicates. Significance was calculated using Mann-Whitney Ranked Sum Test with ****p < 0.0001. (F) Nascent DNA is labeled with 20 μM BrdU for 15 min prior to exposure to 4 mM HU for 4 h in the presence of BrdU. Samples are then processed for immunofluorescence detection of PCNA and BrdU in non-denaturing conditions. Only PCNA-positive S phase cells are selected for the analysis. (G) Cells were analyzed as depicted in (F) in the presence or absence of ATRi (VE-821, 10 μM) and CDC7i (5 μM XL-413). Number (n) of nuclei quantified >500 across three biological replicates. Significance was calculated using Mann-Whitney Ranked Sum Test with ****p < 0.0001.
Figure 2.
Figure 2.. ATR prevents resection from PrimPol-generated gaps at ongoing forks
(A) Schematic representation of the nascent DNA degradation fiber assay. (B and C) Cells were treated as in (A) with or without ATRi (VE-821, 10 μM) and MRE11i (Mirin, 50 μM) in (B), and with or without ATRi (VE-821, 10 μM) following 48 h siRNA knockdown of EXO1 in (C). Number (n) of fibers quantified >250 across two biological replicates. Significance was calculated using the Mann-Whitney Ranked Sum Test with ***p < 0.001, ****p < 0.0001. (D and E) siRNAs against HLTF, SMARCAL1, and ZRANB3 (siTriple) (D) or PrimPol (E) were transfected 48 h prior to fiber analysis. Number (n) of fibers quantified >500 across three biological replicates. Significance was calculated using the Mann-Whitney Ranked Sum Test with ****p < 0.0001. (F) U2OS cells were analyzed as in (E) except cells were treated for only 1 h with or without ATRi (VE-821, 10 μM) and HU (4 mM) followed by S1 nuclease digestion. Number (n) of fibers quantified >135 in each sample across two biological replicates. Significance was calculated using the Mann-Whitney Ranked Sum Test with *p < 0.05, ****p < 0.0001. (G) Model for how nascent DNA is degraded at ongoing forks.
Figure 3.
Figure 3.. ATR promotes accumulation of reversed forks
(A) Schematic representation of the ATRi-induced fork structures analyzed by EM. (B) Representative electron microscopy images of normal (left) and reversed (right) replication forks in cells treated with HU, as well as replication forks with ssDNA gaps in cells treated with HU and ATRi (bottom). Insets show the magnified fork junctions. Red arrows show the location of the ssDNA gaps. P, parental strand; D, daughter strand; R, regressed arm; red arrow, ssDNA. Note that DNA breaks distal or very close to fork junctions are not detected by EM. (C) Frequency of EM-detectable reversed forks in U2OS cells mock-treated or treated with HU (4 mM), HU + ATRi (VE-821, 10 μM), or HU + ATRi + siControl/siPrimPol. The total numbers of replication forks (n) analyzed by EM in each sample are indicated across two biological replicates (n = 2). (D and E) Frequency and length of EM-detectable ssDNA gaps at fork junctions and internal gaps in U2OS cells treated with HU (4 mM) or HU + ATRi (VE-821, 10 μM) + siControl/siPrimPol. Gap threshold: +20 nm. Significance of ssDNA gap length was calculated using Welch’s t test with **p < 0.01. ATRi treatment was 2 h long and siControl or siPrimPol was transfected 48 h before analysis in (C)–(E). (F) Frequency of EM-detectable reversed forks in U2OS cells mock-treated or treated with HU (4 mM), HU + ATRi (VE-821, 10 μM), or HU + ATRi + MRE11i (Mirin, 50 μM). ATRi and MRE11i (Mirin) treatments were 2 h long. The total numbers of replication forks (n) analyzed by EM in each sample are indicated across one biological replicate (n = 1). (G) Model for how ATR inhibitors impact the observed proportion of reversed forks.
Figure 4.
Figure 4.. ATR prevents fork uncoupling at ongoing forks
(A) Schematic representation of the template ssDNA exposure assay. (B) Cells were treated as in (A) with MRE11i (Mirin, 50 μM) with or without ATRi (VE-821, 10 μM) following 48 h siRNA knockdown of EXO1 and processed for the template strand exposure assay. Number (n) of nuclei quantified >300 in each sample across two biological replicates. Significance was calculated using the Mann-Whitney Ranked Sum Test with ****p < 0.0001. (C and D) Cells were treated as in (A) with or without ATRi (VE-821, 10 μM) following 48 h siRNA knockdown of PrimPol (C) or the combination of HLTF, SMARCAL1, and ZRANB3 (siTriple, D). Number (n) of nuclei quantified >300 across three biological replicates. Significance was calculated using the Mann-Whitney Ranked Sum Test with ****p < 0.0001. (E) Cells were treated as in (A) with or without ATRi (VE-821, 10 μM) following 48 h siRNA knockdown of Tipin. Number (n) of nuclei quantified >130 across two biological replicates. Significance was calculated using the Mann-Whitney Ranked Sum Test with ****p < 0.0001. (F) Model for how ATR prevents template DNA exposure at ongoing forks.
Figure 5.
Figure 5.. ATR prevents degradation of template DNA at new forks
(A) Schematic representation of the nascent DNA exposure assay. (B and C) Cells were treated as in (A) with or without ATRi (VE-821, 10 μM) following 48 h siRNA knockdown of HLTF, SMARCAL1, and ZRANB3 (siTriple, B) or PrimPol (C). Number (n) of nuclei quantified >1,000 across four biological replicates in (B) and >300 across two biological replicates in (C). Significance was calculated using the Mann-Whitney Ranked Sum Test with ****p < 0.0001. (D) Cells were exposed to HU (4 mM) and ATRi (VE-821, 10 μM) for 5 h and processed for neutral comet assay. Box plots represent the tail moment of comets. Number (n) of cells quantified >100 across two biological replicates. Significance was calculated using Mann-Whitney ranked sum test with ****p < 0.0001. (E) Following 48 h siRNA knockdown of SLX4 or MUS81, cells were treated as in (A) with or without ATRi (VE-821, 10 μM). Number (n) of nuclei quantified >250 across two biological replicates. Significance was calculated using the Mann-Whitney Ranked Sum Test. (F–H) Cells were treated as in (A) with or without ATRi (VE-821, 10 μM) following 48 h siRNA knockdown of MRE11, EXO1, and DNA2 in (F); treated with MRE11i (Mirin, 50 μM or PFM-01, 100 μM) in (G); or with CDC7i (XL-413, 5 μM) following CtIP knockdown in (H). Number (n) of nuclei quantified >250 across two biological replicates. Significance was calculated using Mann-Whitney Ranked Sum Test with *p < 0.05, **p < 0.01, ***p < 0.001, ****p < 0.0001. (I) Model for how nascent ssDNA is exposed in the absence of ATR.
Figure 6.
Figure 6.. ATR inhibition enhances nascent DNA degradation from PARPi-induced ssDNA gaps
(A) U2OS cells were treated with DMSO or CDC7i (XL-413, 5 μM) with or without ATRi (VE-821, 10 μM) in the presence of PARPi (Olaparib, 10 μM) for 5 h and processed for fiber assay analysis. (B and C) Following 48 h knockdown of PrimPol, U2OS (B) or UWB1 and UWB1+B1 (C) cells were treated with or without ATRi (VE-821, 10 μM) in the presence of PARPi (Olaparib, 10 μM) for 5 h and processed for fiber assay analysis. (D) UWB1 and UWB1+B1 cells were sequentially labeled in CldU (50 μM) followed by IdU (100 μM) in the presence of PARPi (Olaparib, 10 μM). Cells were then incubated in PARPi (Olaparib, 10 μM) with or without ATRi (VE-821, 10 μM) for 5 h followed by S1 nuclease digestion. (E) UWB1, UWB1+B1, SYr12, and SYr13 cells were sequentially labeled in CldU (50 μM) followed by IdU (100 μM) in the presence of PARPi (Olaparib, 10 μM). Cells were then incubated in media containing DMSO or PARPi (Olaparib, 10 μM) with or without ATRi (VE821, 10 μM) for 5 h and processed for fiber assay analysis. (F) Following 48 h knockdown of PrimPol, SYr12 and SYr13 cells were sequentially labeled in CldU (50 μM) followed by IdU (100 μM) in the presence of PARPi (Olaparib, 10 μM). Cells were then incubated in PARPi (Olaparib, 10 μM) with or without ATRi (VE-821, 10 μM) for 5 h. Number (n) of fibers quantified >250 across two biological replicates. Significance was calculated using the Mann-Whitney Ranked Sum Test with **p < 0.01, ***p < 0.001, ****p < 0.0001 in (A)–(F). (G) Viability assay of UWB1, UWB1+B1, SYr12, and SYr13 cells after 6 days of treatment with increasing doses of PARPi (Olaparib, 10 μM), ATRi (VE-821, 10 μM), and PARPi + ATRi following 24 h siRNA knockdown of PrimPol.
Figure 7.
Figure 7.. Model for distinct functions of ATR in the protection of replication forks
(A) Models for distinct functions of ATR in protecting ongoing and new forks. (B) Model for how ATRi exacerbates PARPi-induced ssDNA gaps in BRCA1/2-deficient cells. (C) Model for how ATRi overcomes the restored gap protection in BRCA1-deficient, PARPi-resistant cells.

Similar articles

Cited by

References

    1. Tubbs A, and Nussenzweig A. (2017). Endogenous DNA Damage as a Source of Genomic Instability in Cancer. Cell 168, 644–656. 10.1016/j.cell.2017.01.002. - DOI - PMC - PubMed
    1. Saxena S, and Zou L. (2022). Hallmarks of DNA replication stress. Mol. Cell 82, 2298–2314. 10.1016/j.molcel.2022.05.004. - DOI - PMC - PubMed
    1. Zeman MK, and Cimprich KA (2014). Causes and consequences of replication stress. Nat. Cell Biol 16, 2–9. 10.1038/ncb2897. - DOI - PMC - PubMed
    1. Saldivar JC, Cortez D, and Cimprich KA (2017). The essential kinase ATR: Ensuring faithful duplication of a challenging genome. Nat. Rev. Mol. Cell Biol 18, 622–636. 10.1038/nrm.2017.67. - DOI - PMC - PubMed
    1. Blackford AN, and Jackson SP (2017). ATM, ATR, and DNA-PK: The Trinity at the Heart of the DNA Damage Response. Mol. Cell 66, 801–817. 10.1016/j.molcel.2017.05.015. - DOI - PubMed

Publication types

MeSH terms

LinkOut - more resources