. 2023 Aug:94:104714.
doi: 10.1016/j.ebiom.2023.104714. Epub 2023 Jul 16.

Alterations of hepatic energy metabolism in murine models of obesity, diabetes and fatty liver diseases

Affiliations

Alterations of hepatic energy metabolism in murine models of obesity, diabetes and fatty liver diseases

Bedair Dewidar et al. EBioMedicine. 2023 Aug.

Abstract

Background: Disturbed hepatic energy metabolism contributes to non-alcoholic fatty liver (NAFLD), but the development of changes over time and obesity- or diabetes-related mechanisms remained unclear.

Methods: Two-day old male C57BL/6j mice received streptozotocin (STZ) or placebo (PLC) and then high-fat (HFD) or regular chow diet (RCD) from week 4 (W4) to either W8 or W16, yielding control [CTRL = PLC + RCD], diabetes [DIAB = STZ + RCD], obesity [OBES = PLC + HFD] and diabetes-related non-alcoholic steatohepatitis [NASH = STZ + HFD] models. Mitochondrial respiration was measured by high-resolution respirometry and insulin-sensitive glucose metabolism by hyperinsulinemic-euglycemic clamps with stable isotope dilution.

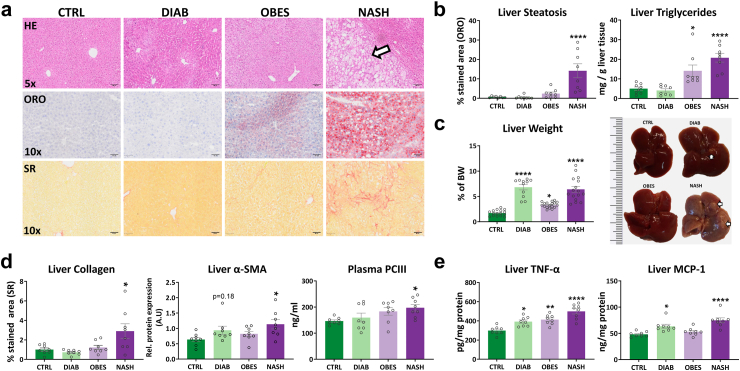
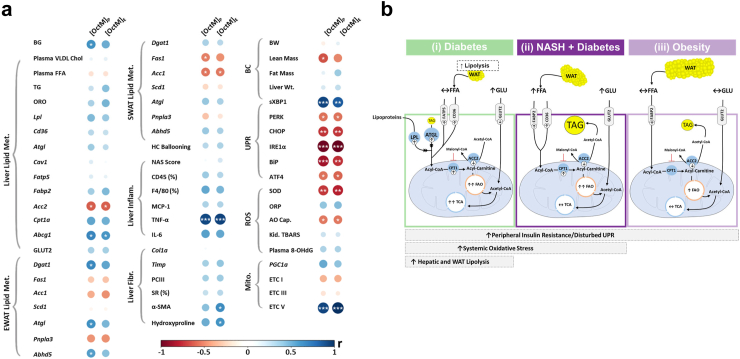
Findings: NASH showed higher steatosis and NAFLD activity already at W8 and liver fibrosis at W16 (all p < 0.01 vs CTRL). Ballooning was increased in DIAB and NASH at W16 (p < 0.01 vs CTRL). At W16, insulin sensitivity was 47%, 58% and 75% lower in DIAB, NASH and OBES (p < 0.001 vs CTRL). Hepatic uncoupled fatty acid oxidation (FAO)-associated respiration was reduced in OBES at W8, but doubled in DIAB and NASH at W16 (p < 0.01 vs CTRL) and correlated with biomarkers of unfolded protein response (UPR), oxidative stress and hepatic expression of certain enzymes (acetyl-CoA carboxylase 2, Acc2; carnitine palmitoyltransferase I, Cpt1a). Tricarboxylic acid cycle (TCA)-driven respiration was lower in OBES at W8 and doubled in DIAB at W16 (p < 0.0001 vs CTRL), which positively correlated with expression of genes related to lipolysis.

Interpretation: Hepatic mitochondria adapt to various metabolic challenges with increasing FAO-driven respiration, which is linked to dysfunctional UPR, systemic oxidative stress, insulin resistance and altered lipid metabolism. In a diabetes model, higher TCA-linked respiration reflected mitochondrial adaptation to greater hepatic lipid turnover.

Funding: Funding bodies that contributed to this study were listed in the acknowledgements section.

Keywords: Fatty liver; High-resolution respirometry; Insulin resistance; Mitochondria; Type 1 diabetes; Type 2 diabetes; Unfolded protein response.


Conflict of interest statement

Declaration of interests LM, CE, CR, CG, ER, DP, MW, IE, MDF, FZ, and AY declare no competing interests. BD is supported by a DZD grant. GH is supported by the Jühling Award. MR is currently on scientific advisory boards of Astra Zeneca, Boehringer Ingelheim, Eli Lilly, NovoNordisk, and Target RWE, and has received investigator-initiated support from Boehringer Ingelheim, Nutricia/Danone and Sanofi-Aventis.

Figures

Fig. 1
Fig. 1
Metabolic features of the animal models. (a) Study design and mice groups. Weekly changes in (b) body weight (BW) and (c) relative caloric intake. Area under the curve (AUC) was compared between the groups with 1-way ANOVA. (d) Relative fat mass and (e) lean mass determined by MRI. (f) Weekly changes in blood glucose. Plasma levels of (g) total cholesterol and (h) free fatty acids (FFA) at week 16 (W16). Mean ± SEM, n = 8–18/group, (d and e) analysed with 2-way ANOVA (1-factor: mouse group, 2-factor: time), (f) with repeated-measure ANOVA, (g) with 2-way ANOVA (1-factor: mouse group, 2-factor: cholesterol fraction), and (h) with 1-way ANOVA. ∗p < 0.05; ∗∗p < 0.01; ∗∗∗p < 0.001; ∗∗∗∗p < 0.0001 vs CTRL.
Fig. 2
Fig. 2
NASH development (W16). (a) Representative pictures show hematoxylin and eosin (HE), Oil red O (ORO), and Sirius red (SR) staining. White arrow highlights area with hepatocellular carcinoma and steatosis. (b) Liver fat content from ORO staining and liver triglycerides. (c) Liver weight normalized to total body weight (BW). White arrows in liver macroscopic pictures highlight dysplastic liver nodules. (d) Liver fibrosis markers. (e) Hepatic protein level of inflammatory cytokine TNF-α and chemokine MCP-1. Scale bar 100 μm (top panels); 50 μm (middle and bottom panels). Mean ± SEM, n = 7–8/group (n for liver weight = 11–18/group), analysed with 1-way ANOVA. ∗p < 0.05; ∗∗p < 0.01; ∗∗∗∗p < 0.0001 vs CTRL.
Fig. 3
Fig. 3
Tissue-specific insulin sensitivity (W16). (a) Protocol for hyperinsulinemic-euglycemic clamp (HEC). (b) Fasting plasma glucose and (c) plasma insulin before and after HEC measured by ELISA. (d) Glucose infusion rate normalized to body weight. (e) Whole-body insulin sensitivity given as clamp Rd (mg/kg/min), normalized to steady-state insulinemia (pM). (f) Hepatic insulin sensitivity given as percentage of insulin-mediated suppression of EGP vs basal conditions (normalized to steady-state insulinemia). (g) Ratio of phosphorylated AKT (T308 and S473) to total AKT. Immunoblot shows two representative mice for each group based on densitometric quantification. Mean ± SEM, n = 7–11/group, (b and c) analysed with 2-way ANOVA (1-factor: mouse group, 2-factor: time), (d–g) with 1-way ANOVA. ∗p < 0.05; ∗∗∗p < 0.001; ∗∗∗∗p < 0.0001 vs CTRL.
Fig. 4
Fig. 4
Liver and skeletal muscle (m. soleus) mitochondria-specific respiration. (a) Substrate-uncoupler-inhibitor titration (SUIT) protocols, (b and c) citrate synthase activity (CSA), and (d–k) mt-specific FAO- and TCA-driven O2 fluxes in permeabilized liver and soleus muscle at W8 and W16. Mean ± SEM, n = 5–15/group, (b and c) analysed with 1-way ANOVA, (d–k) with 2-way ANOVA (1-factor: mouse group, 2-factor: substrate). §p = 0.05, ∗p < 0.05; ∗∗p < 0.01; ∗∗∗p < 0.001; ∗∗∗∗p < 0.0001 vs CTRL. ETF: electron-transferring flavoprotein; P: pyruvate; M: malate; G: glutamate; S: succinate; Oct: octanoyl-carnitine. LN: leak respiration with no adenylates; P: coupled respiration; L: leak respiration after addition of oligomycin; E: electron transfer system capacity.
Fig. 5
Fig. 5
Alterations of oxidative stress markers and hepatic lipid metabolism (W16). (a) Markers of hepatic oxidative stress. (b) Plasma static oxidation-reduction potential (ORP) and antioxidant capacity as markers for systemic oxidative stress. mRNA level of genes related to (c) lipid uptake, (d) lipolysis, (e) triacylglycerol synthesis, (f) de-novo lipogenesis, and (g) FAO pathways. Mean ± SEM, n = 7–8/group, analysed with 1-way ANOVA. ∗p < 0.05; ∗∗p < 0.01; ∗∗∗p < 0.001; ∗∗∗∗p < 0.0001 vs CTRL. TBARS: thiobarbituric acid reactive substances; 8-OHdG: 8-hydroxy-2′-deoxyguanosine.
Fig. 6
Fig. 6
Distinctive alterations of markers for endoplasmic reticulum stress (W16). (a) Cartoon illustrates the canonical unfolded protein response (UPR). (b–f) Immunoblot for markers of UPR accompanied with semi-quantification. Two representative mice were shown for each group based on densitometric quantification. Mean ± SEM, n = 7–8/group, analysed with 1-way ANOVA. ∗p < 0.05; ∗∗p < 0.01; ∗∗∗p < 0.001 vs CTRL. Total X-box-binding protein 1 (tXBP1) was calculated by summation of spliced (sXBP1) and unspliced (uXBP1) protein level.
Fig. 7
Fig. 7
Mitochondrial respiratory changes and potential mechanisms. (a) Correlation plot between different parameters and mt-specific FAO-driven respiration (W16). Size and color of the circles are based on correlation coefficient (r). (b) Cartoon summarizes the main metabolic and respiratory changes and possible mechanisms. Increased FAO respiration was associated with UPR dysfunction, altered hepatic lipid metabolism, and increased systemic oxidative stress and whole-body insulin resistance. Elevated TCA respiration in diabetes is associated with increased liver and white adipose tissue (WAT) lipolysis. BG: blood glucose; Kid. TBARS: kidney thiobarbituric acid reactive substances; BC: body composition; GLU: glucose. ∗p < 0.05; ∗∗p < 0.01; ∗∗∗p < 0.001 (correlation t-test).

References

    1. Chalasani N., Younossi Z., Lavine J.E., et al. The diagnosis and management of nonalcoholic fatty liver disease: practice guidance from the American Association for the study of liver diseases. Hepatology. 2018;67:328–357. - PubMed
    1. European Association for the Study of the Liver (EASL) European Association for the study of diabetes (EASD), European Association for the study of obesity (EASO). EASL-EASD-EASO clinical practice guidelines for the management of non-alcoholic fatty liver disease. J Hepatol. 2016;64:1388–1402. - PubMed
    1. Dewidar B., Kahl S., Pafili K., Roden M. Metabolic liver disease in diabetes - from mechanisms to clinical trials. Metabolism. 2020;111S - PMC - PubMed
    1. Gastaldelli A., Cusi K. From NASH to diabetes and from diabetes to NASH: mechanisms and treatment options. JHEP Rep. 2019;1:312–328. - PMC - PubMed
    1. Mansouri A., Gattolliat C.-H., Asselah T. Mitochondrial dysfunction and signaling in chronic liver diseases. Gastroenterology. 2018;155:629–647. - PubMed

Substances