. 2023 Oct;165(4):946-962.e13.
doi: 10.1053/j.gastro.2023.06.034. Epub 2023 Jul 15.

HLA-DP on Epithelial Cells Enables Tissue Damage by NKp44+ Natural Killer Cells in Ulcerative Colitis

Collaborators, Affiliations

HLA-DP on Epithelial Cells Enables Tissue Damage by NKp44+ Natural Killer Cells in Ulcerative Colitis

Martin E Baumdick et al. Gastroenterology. 2023 Oct.

Abstract

Background & aims: Ulcerative colitis (UC) is characterized by severe inflammation and destruction of the intestinal epithelium, and is associated with specific risk single nucleotide polymorphisms in HLA class II. Given the recently discovered interactions between subsets of HLA-DP molecules and the activating natural killer (NK) cell receptor NKp44, genetic associations of UC and HLA-DP haplotypes and their functional implications were investigated.

Methods: HLA-DP haplotype and UC risk association analyses were performed (UC: n = 13,927; control: n = 26,764). Expression levels of HLA-DP on intestinal epithelial cells (IECs) in individuals with and without UC were quantified. Human intestinal 3-dimensional (3D) organoid cocultures with human NK cells were used to determine functional consequences of interactions between HLA-DP and NKp44.

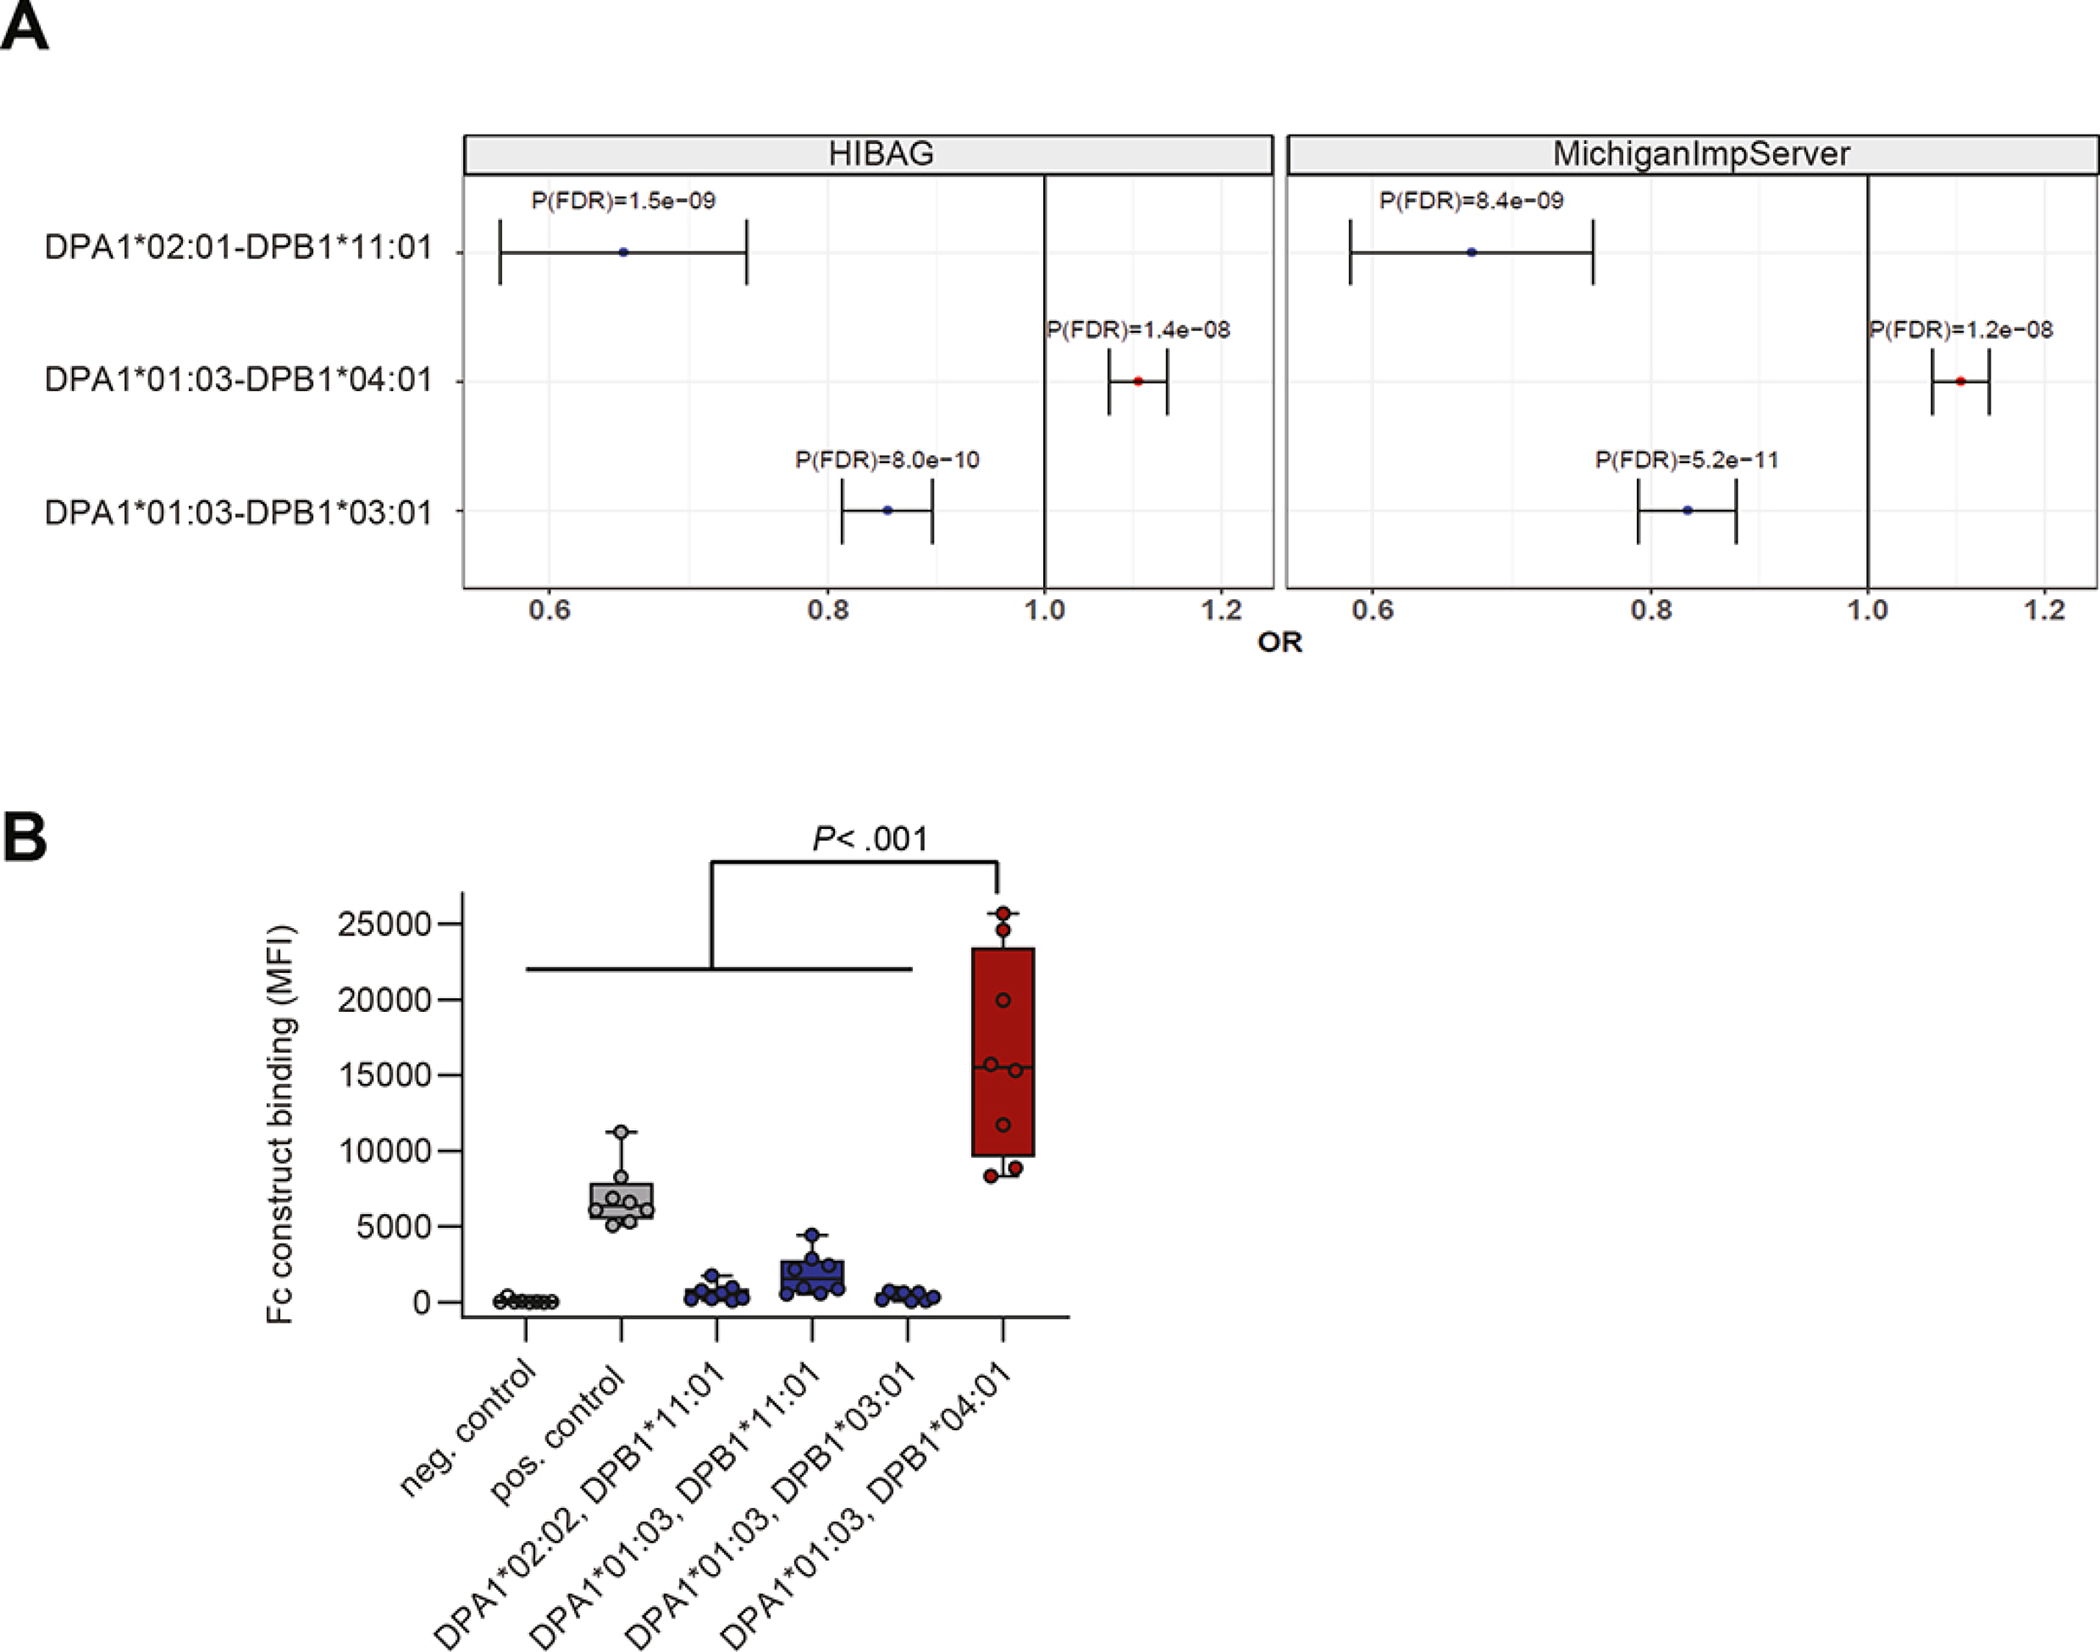
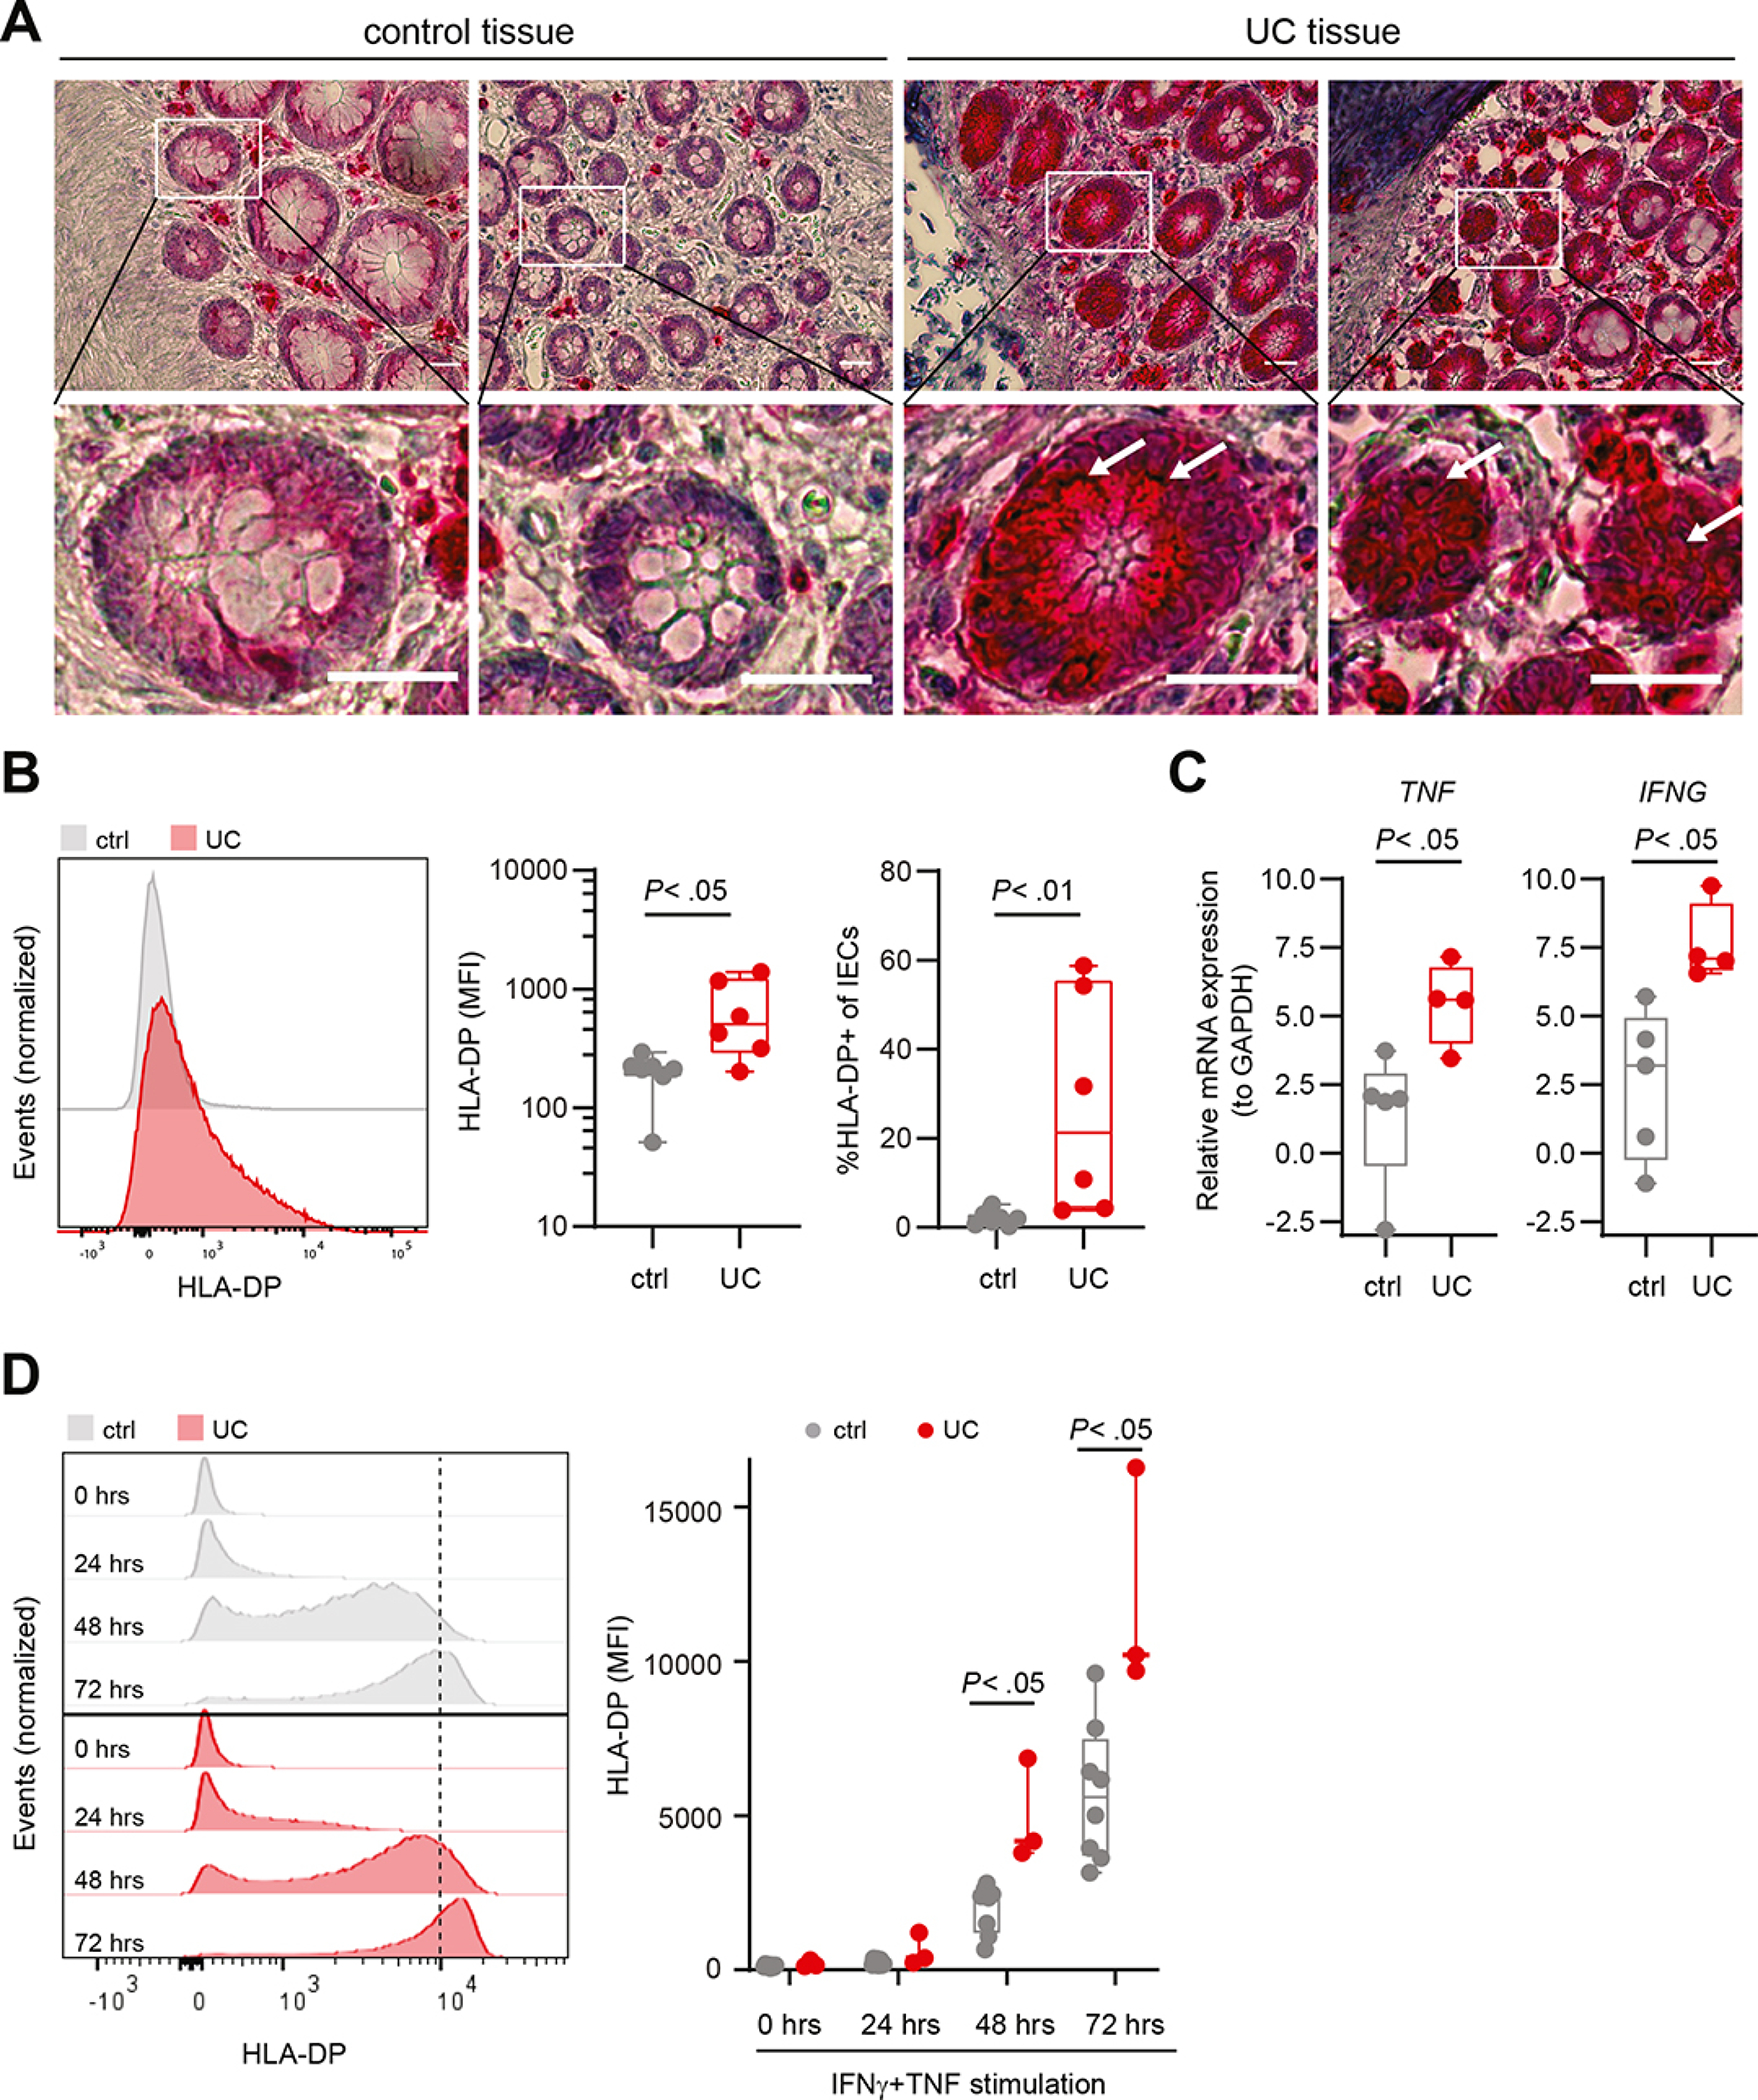
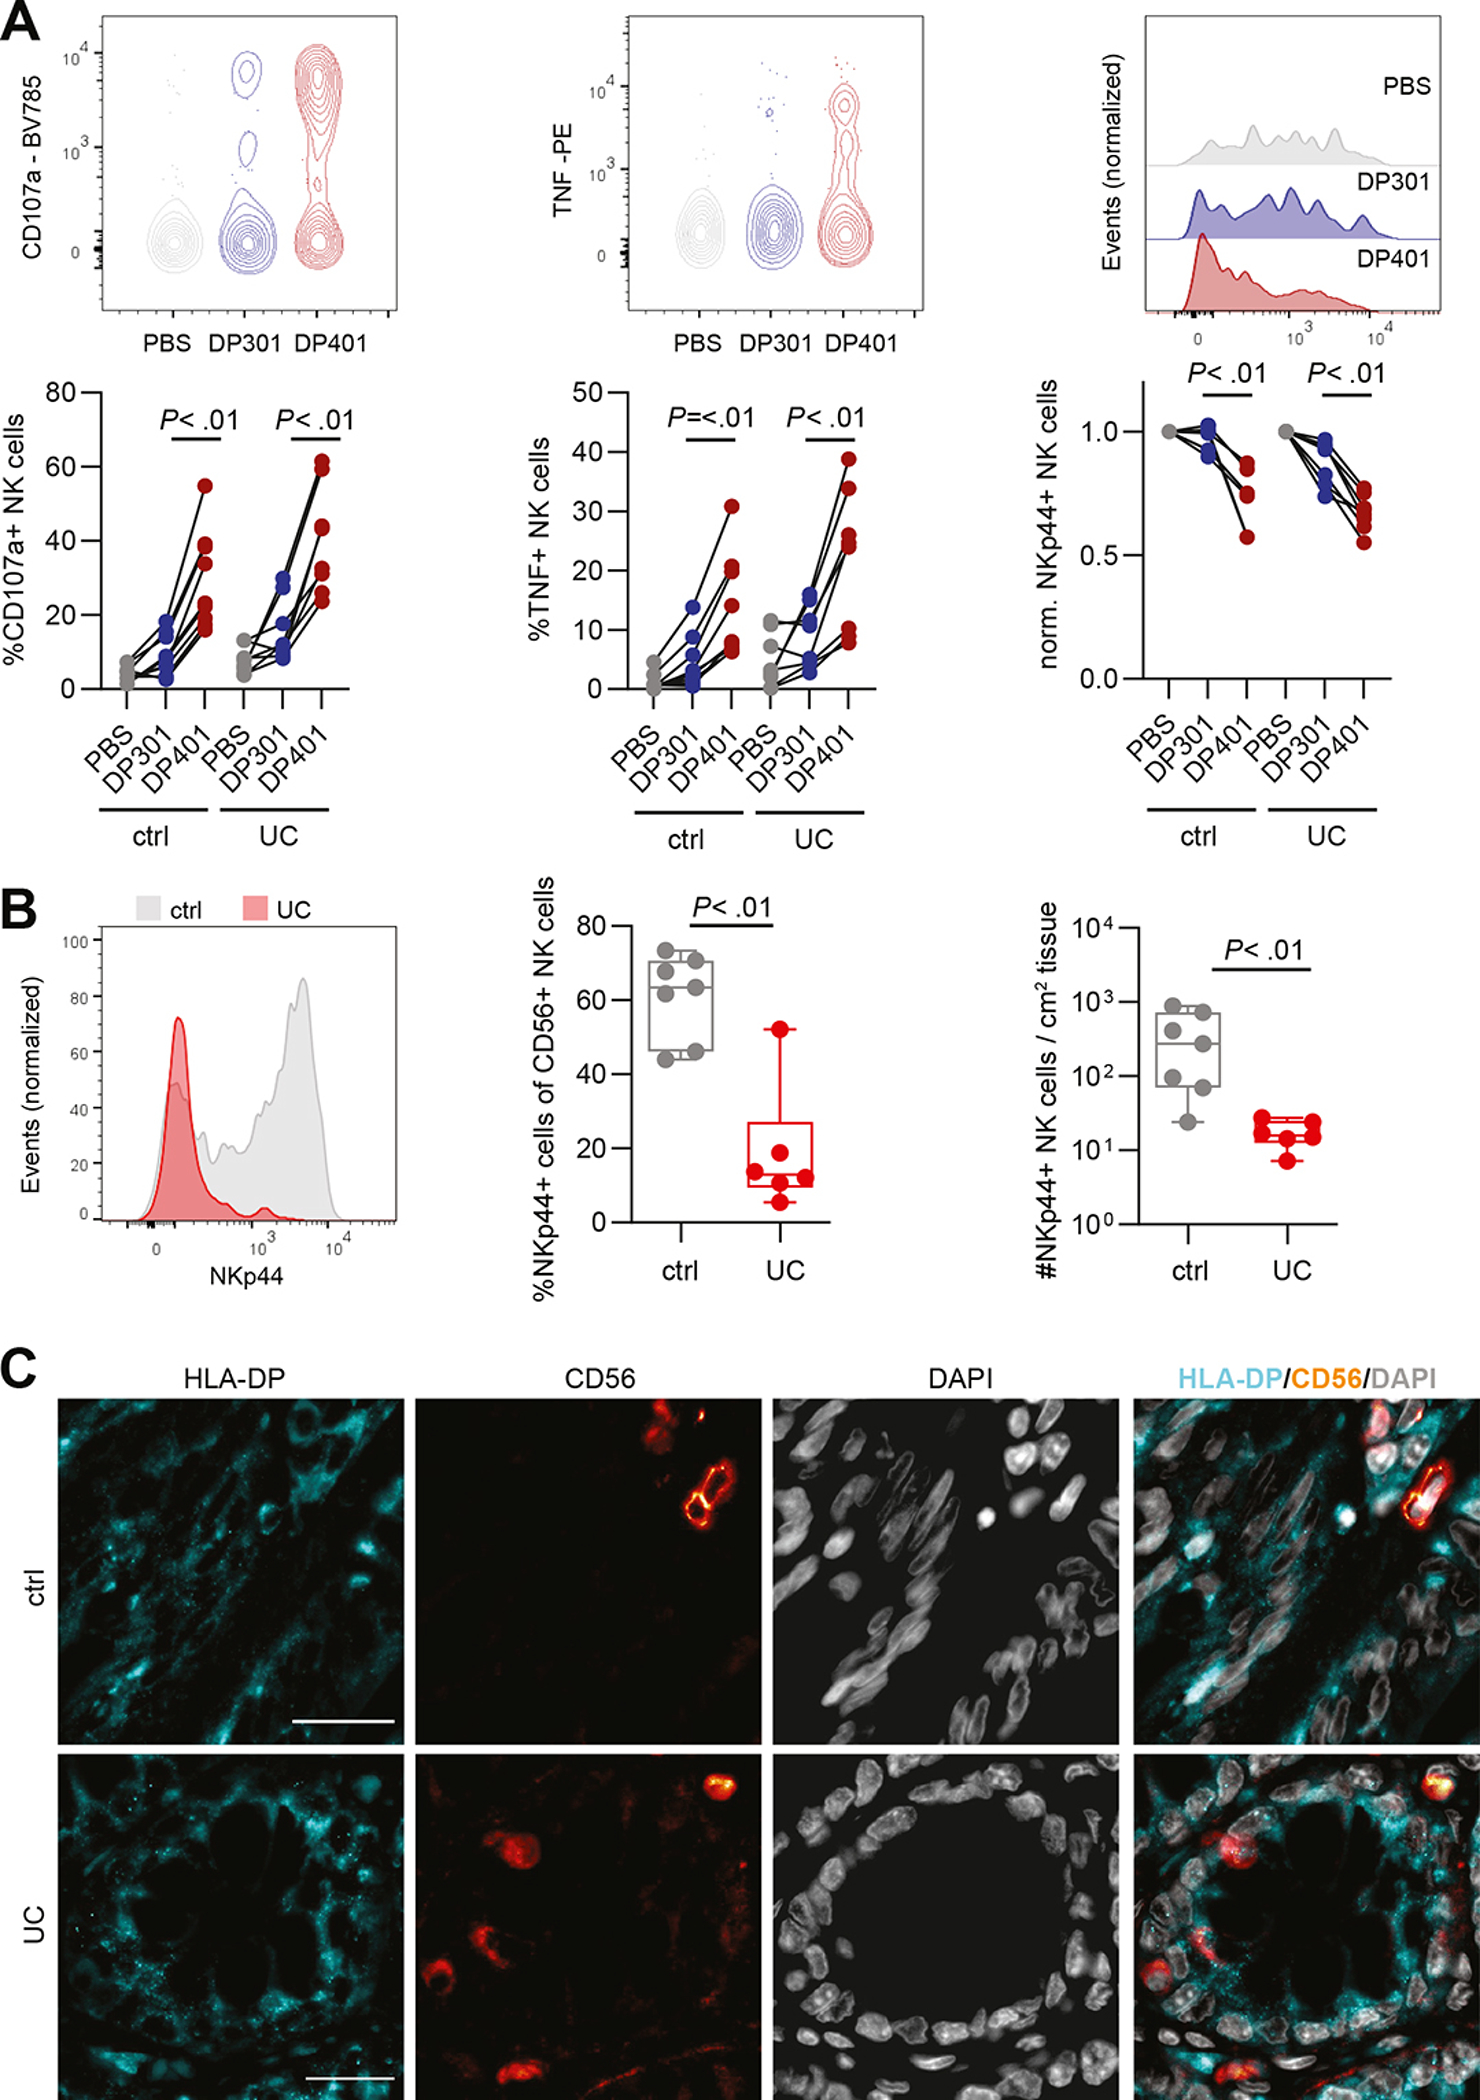
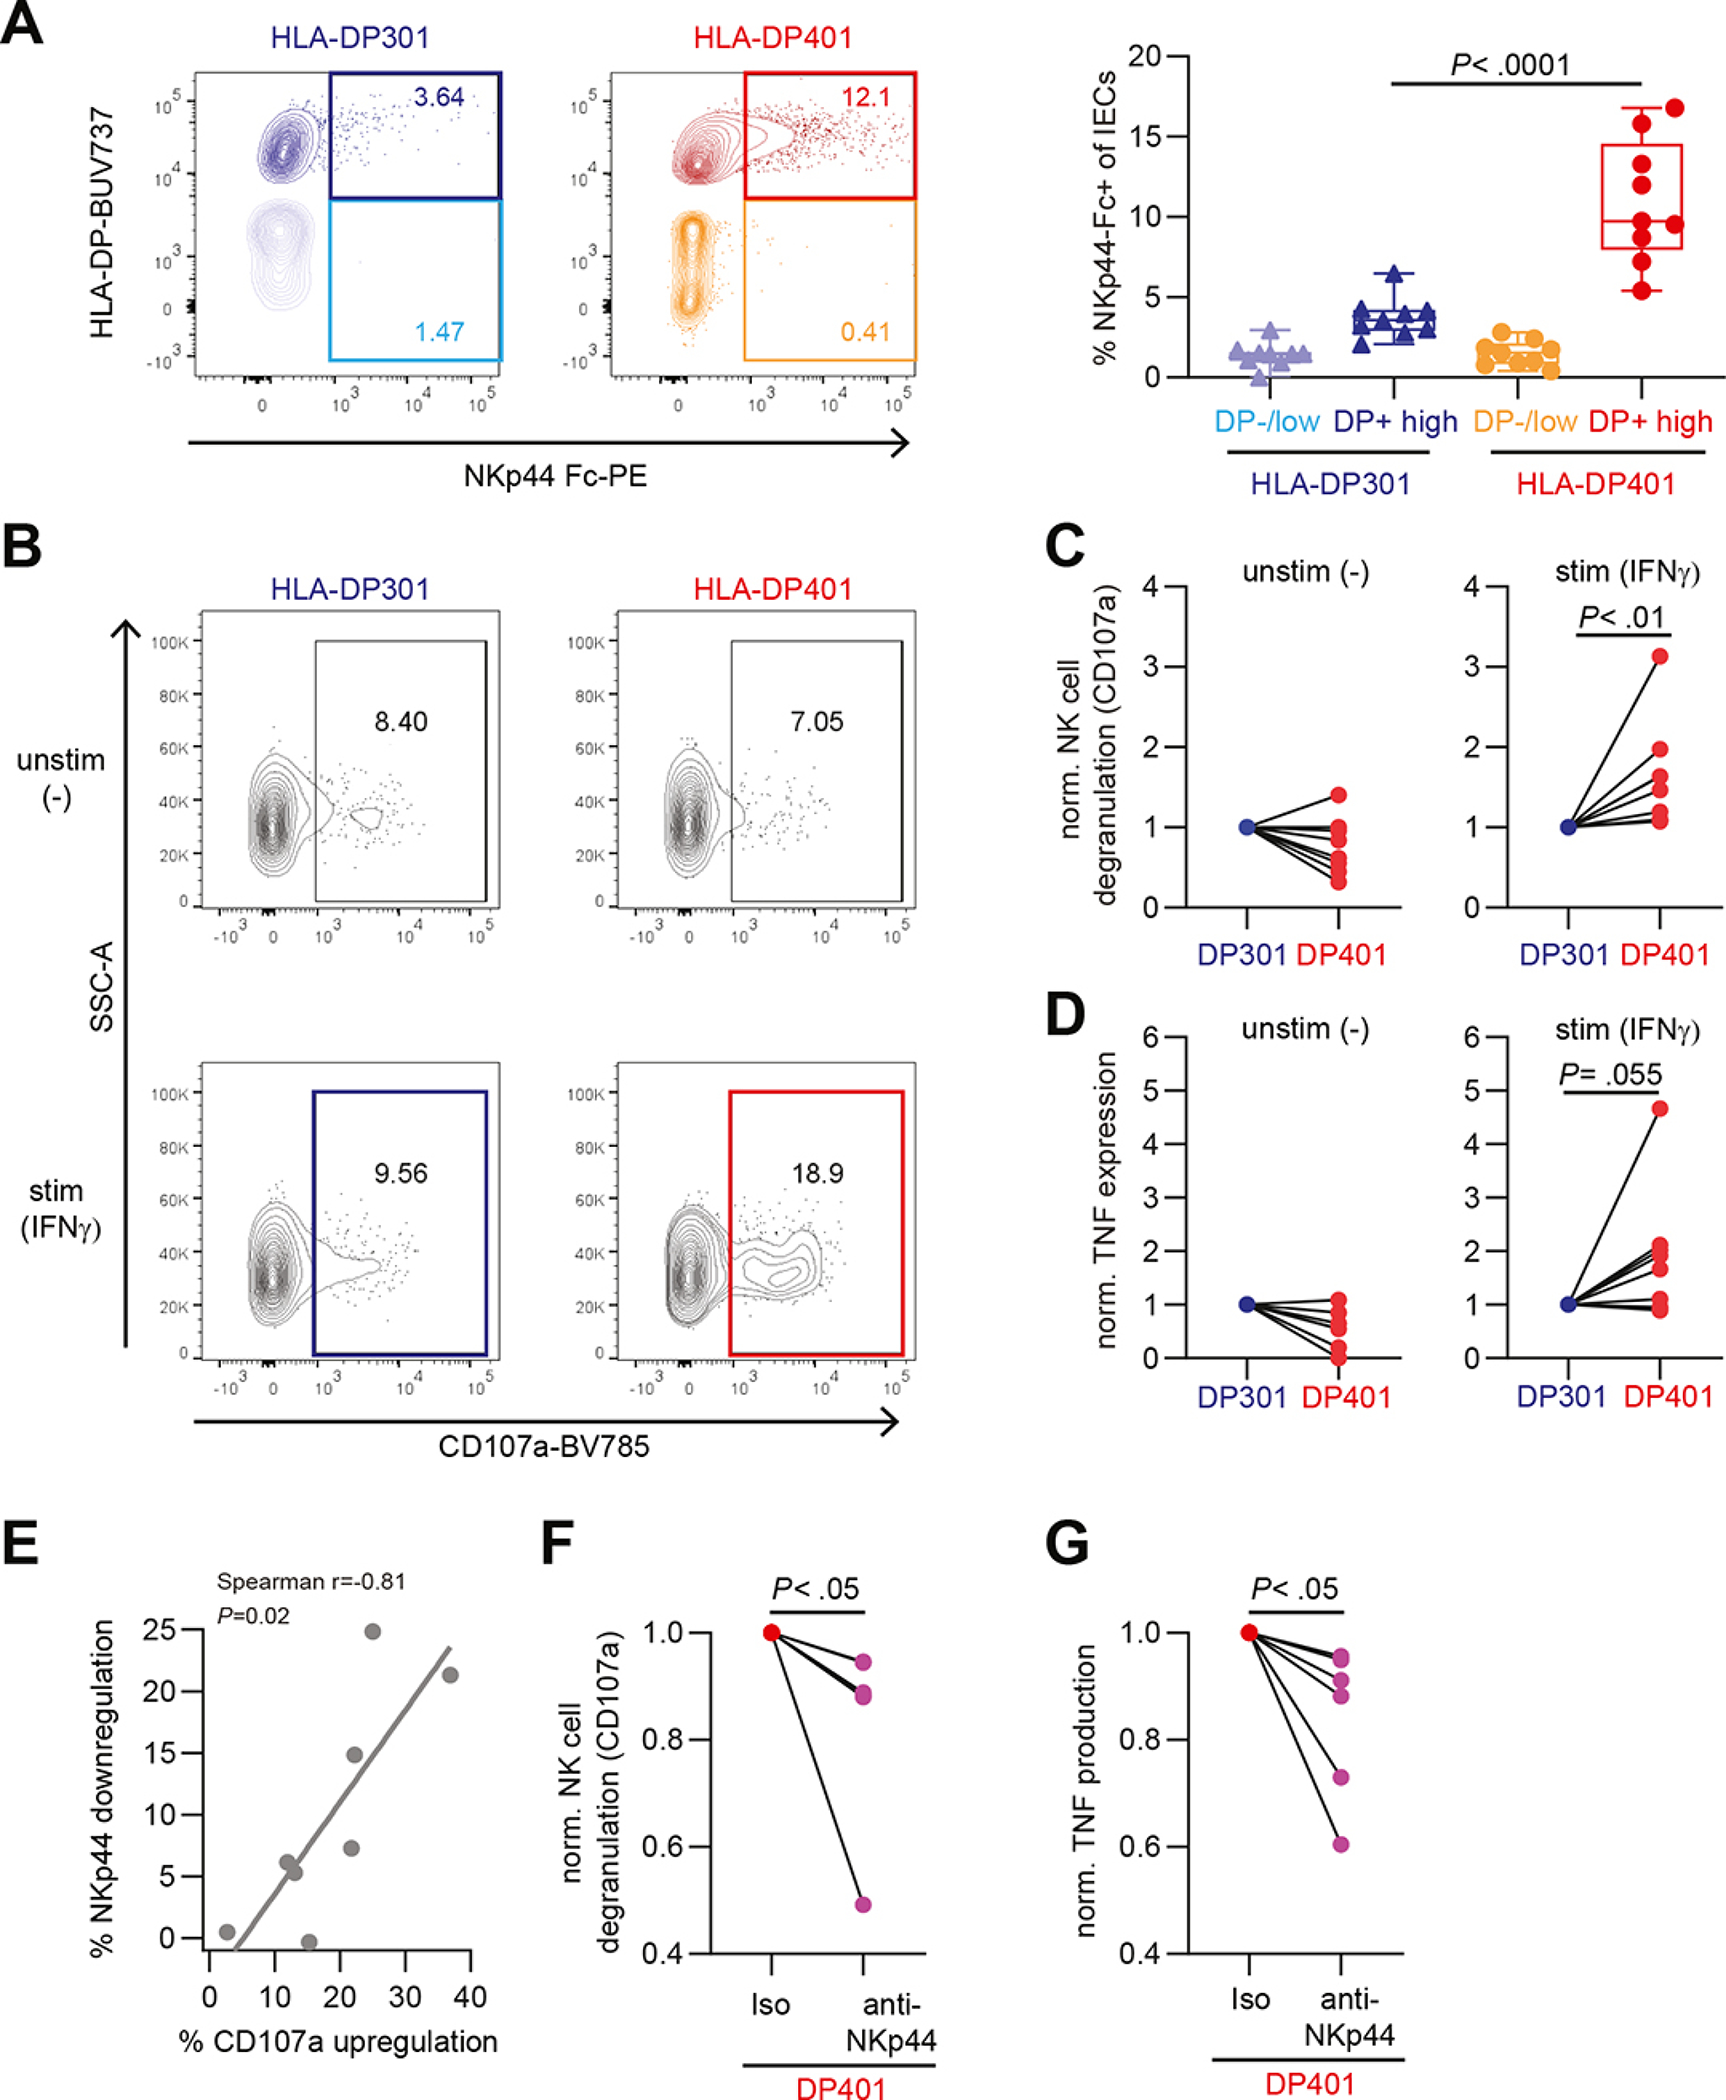
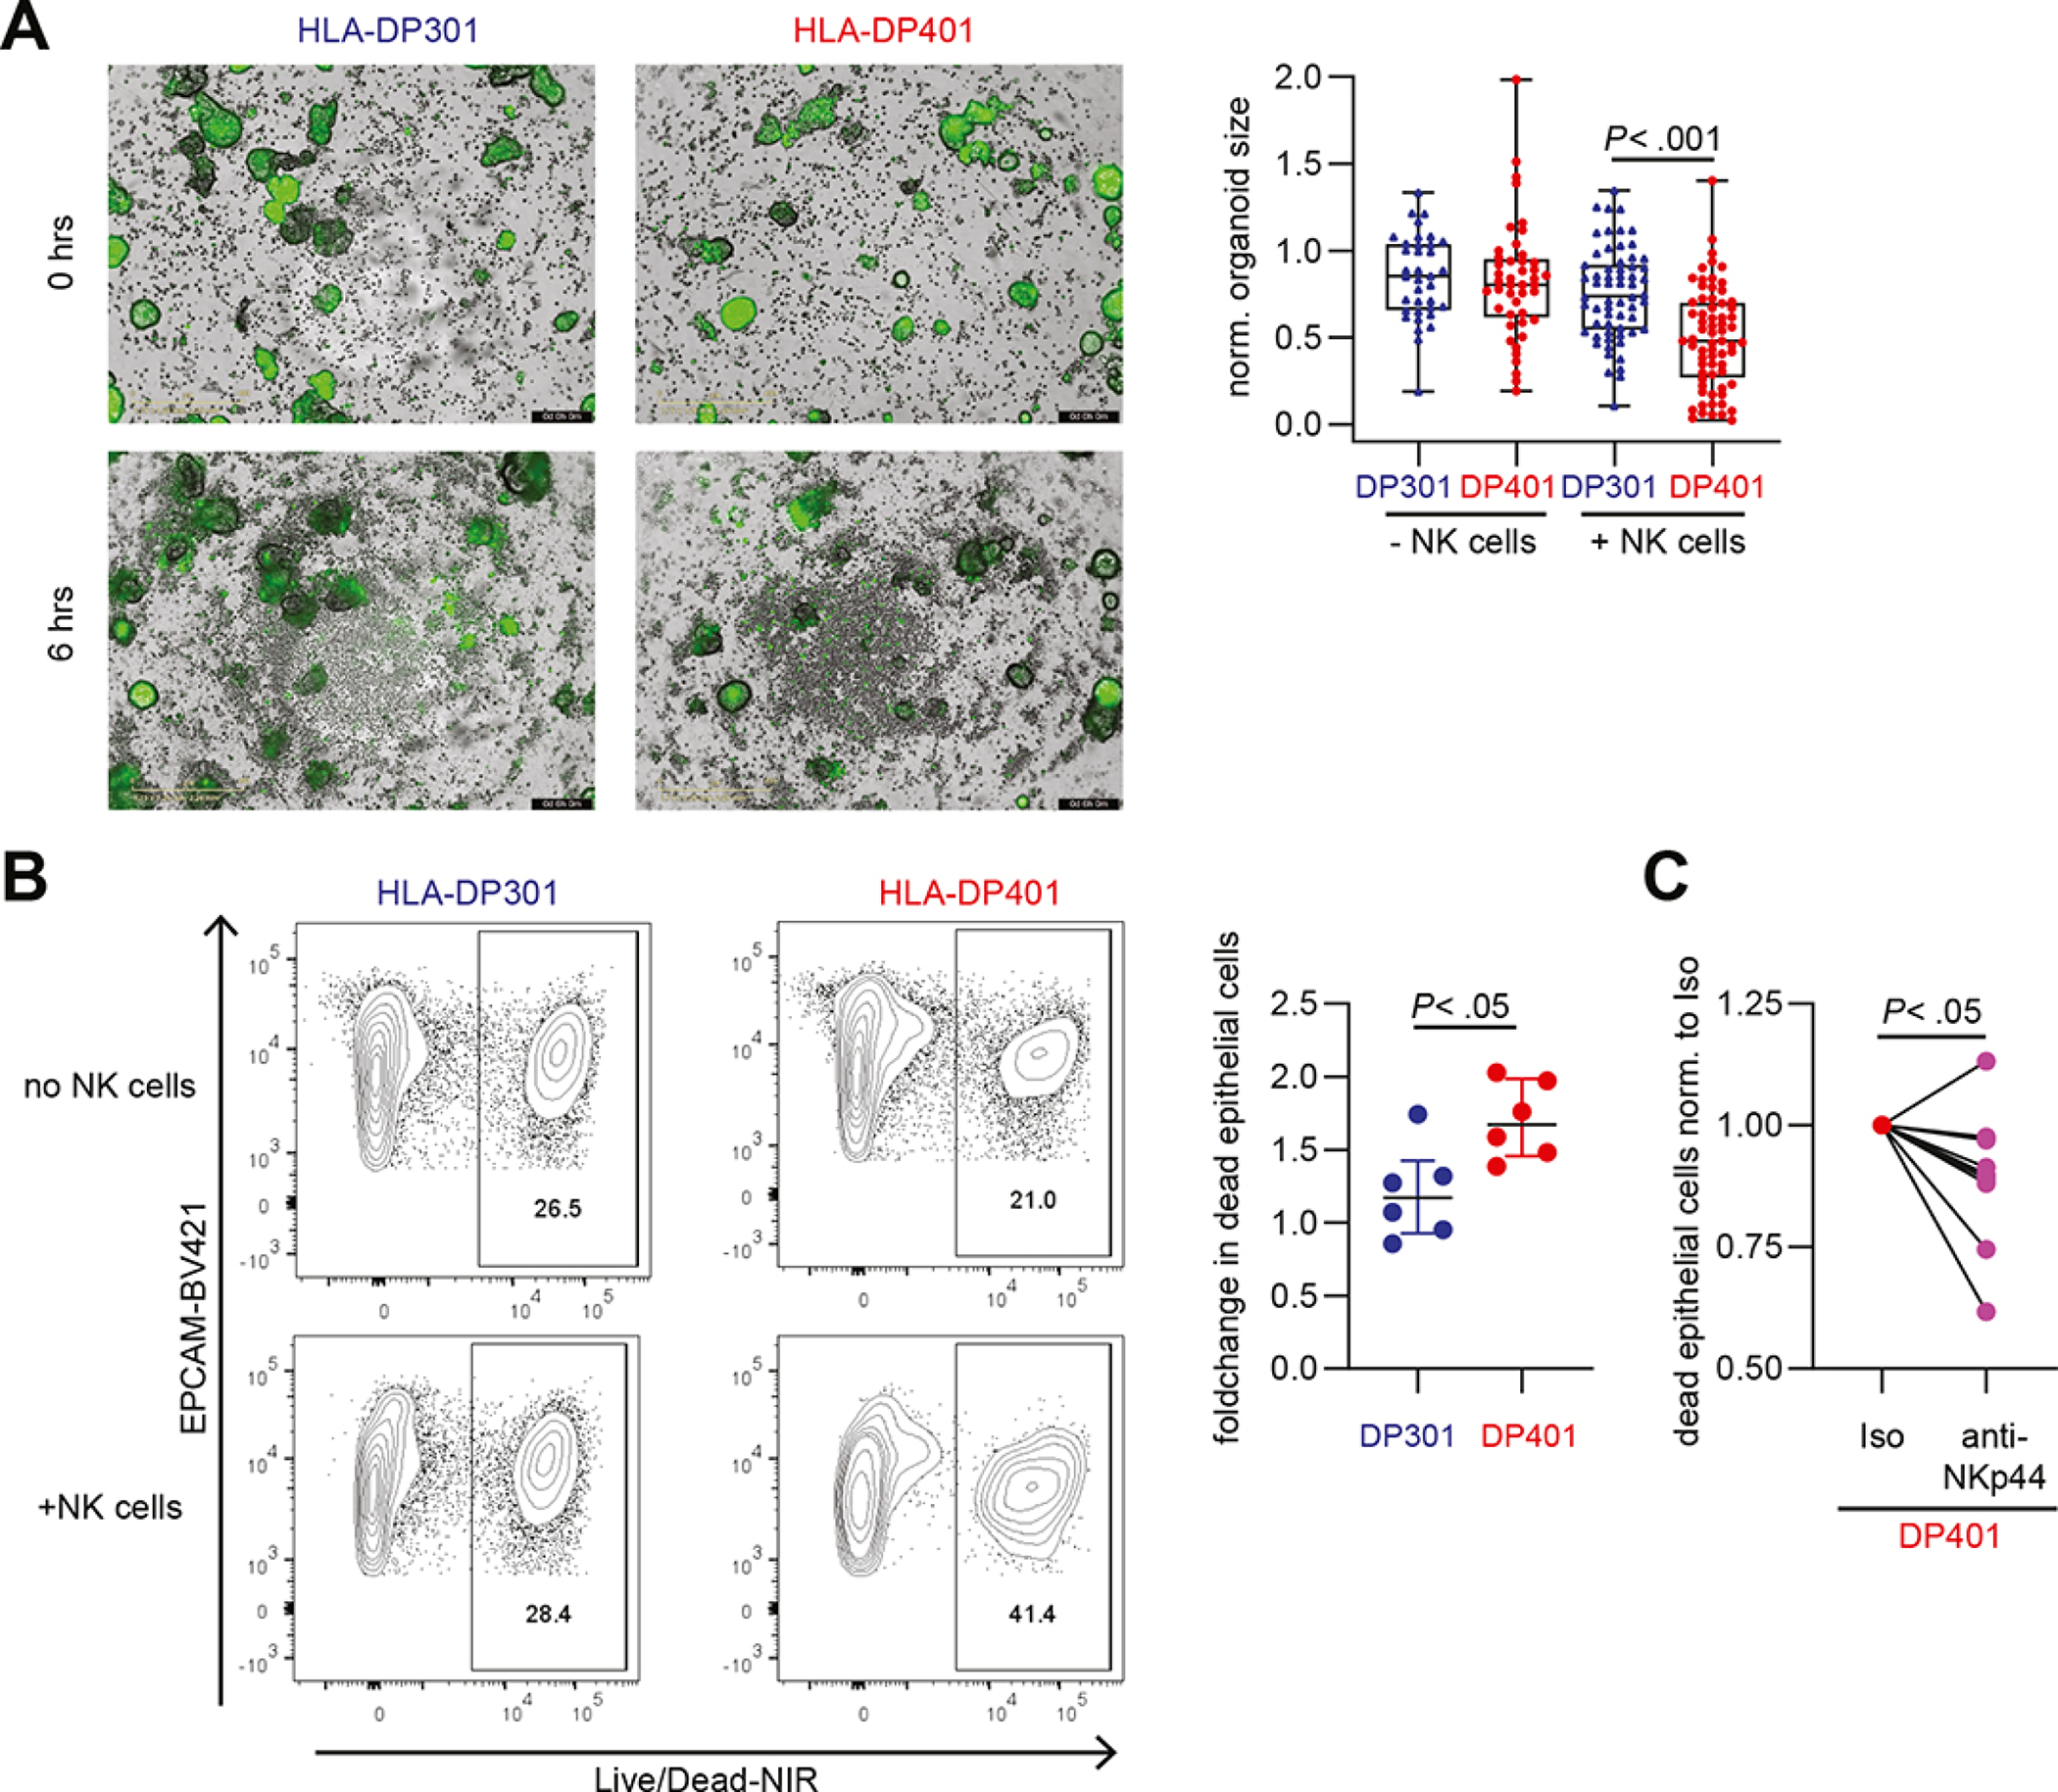
Results: These studies identified HLA-DPA1∗01:03-DPB1∗04:01 (HLA-DP401) as a risk haplotype and HLA-DPA1∗01:03-DPB1∗03:01 (HLA-DP301) as a protective haplotype for UC in European populations. HLA-DP expression was significantly higher on IECs of individuals with UC compared with controls. IECs in human intestinal 3D organoids derived from HLA-DP401pos individuals showed significantly stronger binding of NKp44 compared with HLA-DP301pos IECs. HLA-DP401pos IECs in organoids triggered increased degranulation and tumor necrosis factor production by NKp44+ NK cells in cocultures, resulting in enhanced epithelial cell death compared with HLA-DP301pos organoids. Blocking of HLA-DP401-NKp44 interactions (anti-NKp44) abrogated NK cell activity in cocultures.

Conclusions: We identified an UC risk HLA-DP haplotype that engages NKp44 and activates NKp44+ NK cells, mediating damage to intestinal epithelial cells in an HLA-DP haplotype-dependent manner. The molecular interaction between NKp44 and HLA-DP401 in UC can be targeted by therapeutic interventions to reduce NKp44+ NK cell-mediated destruction of the intestinal epithelium in UC.

Keywords: HLA-DP; Intestinal Organoids; NK Cells; NKp44; Ulcerative Colitis.


Conflict of interest statement

Declaration of Interests

A.N. and M.A. are inventors of one provisional patent that describes the binding of NKp44 to a subset of HLA-DP molecules, and the role of these interactions in Graft versus Host Disease. All other authors declare no conflicts of interest.

Figures

Figure 1:
Figure 1:. HLA-DP risk haplotype for UC binds to NKp44.
A. Imputation of HLA-DPA1-DPB1 genotypes using HIBAG (left) and MichiganImpServer (right) showing UC risk and protective HLA-DPA1-DPB1 haplotypes with a frequency of >1% and a False Discovery Rate P (P(FDR)) of < .05. Odds ratios (OR) and 95% confidence intervals are shown. B. NKp44 Fc construct binding to beads coated with different HLA-DP molecules was determined and medians of fluorescence intensity (MFIs) of all individual experiments (n= 8) are depicted. Boxes indicate medians with 25% and 75% quartile ranges, and whiskers indicate minimum and maximum MFI of each HLA-DP molecule tested. HLA-DP molecules that exhibited higher median binding to the NKp44 Fc construct than to the positive control (IgG-coated beads) are marked in red and less in blue. Statistical significance was measured using Mann-Whitney U comparisons.
Figure 2:
Figure 2:. High HLA-DP expression on intestinal epithelial cells of individuals with UC.
A. Images of immunohistochemical analyses of control and UC colons. Specific HLA-DP expression is labelled in red, hemalumn was used as a nuclear counterstain (blue). Lower row shows magnifications of the selected ROI (white box in images of upper row). White arrows point to HLA-DP expressing cells. Scale bars: 250 μm. B. Representative histograms of HLA-DP expression in EpCAM+ IECs of control (ctrl) and individuals with UC measured by flow cytometry (left panel). Expression of HLA-DP (MFI) on EpCAM+ IECs (middle panel). Median percentage of HLA-DP+ cells of EpCAM+ IECs of controls (n = 7) and individuals with UC (n = 6) (right panel). C. Relative mRNA expression of TNF and IFNG to reference gene GAPDH in the intestinal epithelium of individuals with UC (n = 4) compared to controls (n = 5). D. Representative histograms of HLA-DP expression in EpCAM+ epithelial cells in organoids derived from controls or individuals with UC upon stimulation with IFNγ (100 U/ml) and TNF (20 ng/ml) for the indicated time points measured by flow cytometry (left panel). Plot shows MFI of HLA-DP on IECs in intestinal organoids of controls (n = 8) and individuals with UC (n = 3) upon IFNγ and TNF stimulation (right panel). All boxes indicate medians with 25% and 75% quartile ranges, and whiskers indicate minimum and maximum values. Statistical significance was measured using Mann-Whitney U comparisons.
Figure 3:
Figure 3:. Increased activation and TNF production by NK cells of individuals with UC after engagement with HLA-DP401.
A. Representative flow plots for CD107a and TNF, representative histograms of NKp44 expression and summarized plots of peripheral blood-derived NK cells from controls and individuals with UC after incubation with PBS, HLA-DP301 and HLA-DP401 measured by flow cytometry. Each dot represents an individual donor and lines connect CD107a, TNF or NKp44 expression of one donor (ctrl: n = 9 replicates of 5 donors; UC: n = 8 replicates of 4 donors). B. Representative histograms of NKp44 expression on intestinal CD56+ NK cells in colon of non-inflammatory controls (ctrl) and individuals with UC (left panel) measured by flow cytometry. Median percentages of NKp44+ cells of CD56+ NK cells in non-inflammatory controls (n = 7) and individuals with UC (n = 6) (middle panel). Median counts of NKp44+ CD56+ NK cells per cm2 in control (n = 7) and UC-affected tissues (n = 6) (right panel). C. Representative single and merged fluorescence images of HLA-DP, CD56 and DAPI of control and UC-affected colon tissues. Scale bars: 20 μm. All boxes indicate medians with 25% and 75% quartile ranges, and whiskers indicate minimum and maximum values. Statistical significance was measured using Wilcoxon signed rank tests (A) or Mann-Whitney U comparisons (B).
Figure 4:
Figure 4:. Expression of HLA-DP401 on IECs is recognized by NK cells and results in NK cell activation.
A. Representative flow cytometric plots of NKp44 Fc construct binding to HLA-DP301- or HLA-DP401-expressing IECs in organoids after IFNγ stimulation (200 U/ml for 3 days) (left panel). Median percentages of NKp44 Fc construct binding to HLA-DP−/low or HLA-DPhigh IECs (n = 9 replicates of 2 donors in 3 independent experiments for each haplotype) (right panel). B. Representative flow cytometric plots showing CD107a expression of CD56++ NK cells after co-culture with HLA-DP301- or HLA-DP401 expressing IECs. IECs were either unstimulated (−) or stimulated (IFNγ) (200 U/ml for 3 days). C. Plots show fold change degranulation of CD56++ NK cells after co-culture with unstimulated (−) (left panel) or stimulated (IFNγ) (right panel) IECs (degranulation upon culture with HLA-DP301-expressing IECs was set to 1 for each NK cell donor). Each dot represents an individual donor (n = 8 NK cell donors) and lines connect CD107a expression of one NK cell donor. D. Plots show fold change of TNF expression of CD56++ NK cells after co-culture with unstimulated (−) (left panel) or stimulated (IFNγ) (right panel) IECs (TNF expression upon culture with HLA-DP301-expressing IECs was set to 1 for each NK cell donor). Each dot represents an individual donor (n = 8 NK cell donors) and lines connect TNF expression of one NK cell donor. E. Plot showing correlation between percentage of NKp44 downregulation against percentage of CD107 upregulation on NK cells co-cultured with HLA-DP401 expressing IECs (n = 8 NK cell donors). Line indicates linear regression. F. and G. Plots show fold change degranulation (F) and TNF expression (G) of CD56++ NK cells after co-culture with IFNγ-stimulated HLA-DP401+ IECs in presence of an isotype or anti-NKp44 blocking antibody (degranulation and TNF expression of CD56++ NK cells upon co-culture with HLA-DP401-expressing IECs in presence of an isotype antibody was set to 1 for each NK cell donor). Each dot represents an individual donor (n = 6 NK cell donors) and lines connect CD107a or TNF expression of one NK cell donor. All boxes indicate medians with 25% and 75% quartile ranges, and whiskers indicate minimum and maximum values. Statistical significance was measured using Mann-Whitney U comparisons (A) or Wilcoxon signed rank tests (C, D, F, G).
Figure 5:
Figure 5:. Expression of HLA-DP401 on IECs results in the induction of cytotoxicity by NK cells and reduces IECs viability.
A. Representative images of co-cultures of CD56++ NK cells with IFNγ-stimulated, Calcein-labelled (green) HLA-DP301- or HLA-DP401-expressing intestinal organoids at 0 hrs and 6 hrs (left panel). Plot shows normalized organoid size of HLA-DP301- and HLA-DP401-expressing intestinal organoids in presence or absence of CD56++ NK cells (n = 36–68 organoids per condition from experiments with 3 different NK cell donors). Scale Bars: 400 μm. B. Representative flow cytometric plots showing LIVE/DEAD Fixable Near-IR Dead Cell Stain of HLA-DP301+ or HLA-DP401+ EpCam+ IECs after incubation without NK cells or after co-culture with CD56++ NK cells. Plot shows fold change (normalized to dead IECs (LIVE/DEAD Fixable Near-IR Dead Cell Stain) without NK cells) in dead HLA-DP301+ or HLA-DP401+ IECs after co-culture with CD56++ NK cells (n = 6 replicates from 2 NK cell donors). C. Plot shows fold change in dead HLA-DP401+ IECs (LIVE/DEAD Fixable Near-IR Dead Cell Stain) after co-culture with CD56++ NK cells in presence of an isotype or anti-NKp44 blocking antibody (percentage of dead IECs upon culture with CD56++ NK cells in presence of an isotype antibody was set to 1 for each NK cell donor). Each dot represents an individual donor (n = 10 replicates from 5 NK cell donors) and lines connect one NK cell donor. All boxes indicate medians with 25% and 75% quartile ranges, and whiskers indicate minimum and maximum values. Statistical significance was measured using Ordinary Two-way ANOVA (A), Mann-Whitney U comparisons (B) or Wilcoxon signed rank tests (C).

Similar articles

Cited by

References

    1. Alatab S, Sepanlou SG, Ikuta K, et al. The global, regional, and national burden of inflammatory bowel disease in 195 countries and territories, 1990–2017: a systematic analysis for the Global Burden of Disease Study 2017. Lancet Gastroenterol Hepatol 2020;5. - PMC - PubMed
    1. Boer NKH de, Ahuja V, Almer S, et al. Thiopurine Therapy in Inflammatory Bowel Diseases: Making New Friends Should Not Mean Losing Old Ones. Gastroenterology 2019;156. - PubMed
    1. Al-Horani R, Spanudakis E, Hamad B. The market for ulcerative colitis. Nat Rev Drug Discov 2022;21. - PubMed
    1. Panaccione R, Ghosh S, Middleton S, et al. Combination therapy with infliximab and azathioprine is superior to monotherapy with either agent in ulcerative colitis. Gastroenterology 2014;146. - PubMed
    1. Kobayashi T, Siegmund B, Berre C Le, et al. Ulcerative colitis. Nat Rev Dis Prim 2020;6. - PubMed

Publication types

Substances