. 2023 Nov 13;4(6):100660.
doi: 10.1016/j.xplc.2023.100660. Epub 2023 Jul 17.

Histone H3 lysine 27 trimethylation suppresses jasmonate biosynthesis and signaling to affect male fertility under high temperature in cotton

Affiliations

Histone H3 lysine 27 trimethylation suppresses jasmonate biosynthesis and signaling to affect male fertility under high temperature in cotton

Yanlong Li et al. Plant Commun. .

Abstract

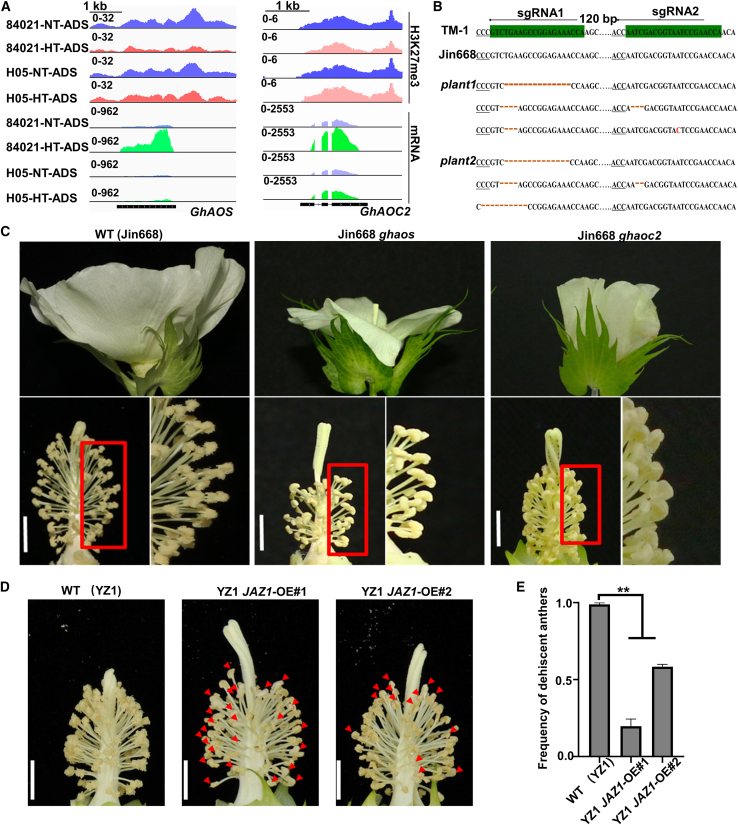
High-temperature (HT) stress causes male sterility in crops, thus decreasing yields. To explore the possible contribution of histone modifications to male fertility under HT conditions, we defined the histone methylation landscape for the marks histone H3 lysine 27 trimethylation (H3K27me3) and histone H3 lysine 4 trimethylation (H3K4me3) by chromatin immunoprecipitation sequencing (ChIP-seq) in two differing upland cotton (Gossypium hirsutum) varieties. We observed a global disruption in H3K4me3 and H3K27me3 modifications, especially H3K27me3, in cotton anthers subjected to HT. HT affected the bivalent H3K4me3-H3K27me3 modification more than either monovalent modification. We determined that removal of H3K27me3 at the promoters of jasmonate-related genes increased their expression, maintaining male fertility under HT in the HT-tolerant variety at the anther dehiscence stage. Modulating jasmonate homeostasis or signaling resulted in an anther indehiscence phenotype under HT. Chemical suppression of H3K27me3 deposition increased jasmonic acid contents and maintained male fertility under HT. In summary, our study provides new insights into the regulation of male fertility by histone modifications under HT and suggests a potential strategy for improving cotton HT tolerance.

Keywords: H3K27me3; H3K4me3; cotton anther; high temperature; jasmonate.


Figures

Figure 1
Figure 1
Male fertility phenotypes and histone methylation patterns during anther development under HT stress. (A) HT-dependent pollen sterility phenotype of H05. Representative images of anthers (top) at the anther dehiscence stage (ADS) for 84021 and H05 and pollen viability determined by 0.8% (w/v) 2,3,5-triphenyltetrazolium (TTC) staining (bottom). Red arrows indicate fertile pollen, and blue arrows indicate sterile pollen. Scale bars, 1 cm (top), 100 μm (bottom). (B) Circos plots summarizing the H3K4me3 and H3K27me3 profiles across the 26 chromosomes (A01–A13 for the At subgenome and D01–D13 for the Dt subgenome) of the G. hirsutum genome. Numbered tracks are as follows: 1, transposable element density; 2, number of protein-coding (PC) genes; 3–6, H3K4me3 or H3K27me3 modification levels at the tapetum degradation stage (TDS) of 84021 under NT (3), at the TDS of 84021 under HT (4), at the ADS of 84021 under NT (5), and at the ADS of 84021 under HT (6); 7–10, H3K4me3 or H3K27me3 modification levels at the TDS of H05 under NT (7), at the TDS of H05 under HT (8), at the ADS of H05 under NT (9), and at the ADS of H05 under HT (10). (C) Number of H3K4me3 peaks and H3K27me3 peaks in all samples. (D) Expression levels of genes encoding H3K4me3 and H3K27me3 writers and erasers at the TDS and ADS in 84021 and H05 under NT and HT conditions based on RNA-seq data. NT, normal temperature; HT, high temperature. Statistical significance was determined by paired two-tailed Student’s t-tests. ∗∗∗P < 0.001; ∗∗P < 0.01; ∗P < 0.05; ns, not significant.
Figure 2
Figure 2
Changes in and expression regulation by H3K4me3 and H3K27me3 under HT conditions. (A) Number of promoters that gained (right) or lost (left) H3K4me3 or H3K27me3 marks under HT conditions in different samples compared with the corresponding NT samples. (B) Metaplots showing normalized H3K4me3 and H3K27me3 tag density at promoter regions in 84021 and H05 under NT and HT conditions. (C) Metaplot of normalized H3K4me3 signal (right) and H3K27me3 signal (middle) over the gene body of protein-coding genes at the ADS stage under NT in 84021 spanning –2 kb upstream to +4 kb downstream of the TSS. Genes were ordered according to their expression level. Regularized logarithm (rlog) of counts, red line to the right. (D) Gene expression levels as a function of H3K4me3 modification status or H3K27me3 modification status at the ADS stage under NT in H05. P values were calculated by a Kolmogorov–Smirnov test. ∗∗∗P < 0.001; ∗∗P < 0.01; ∗P < 0.05; ns, P > 0.05. (E and G) Venn diagrams showing the extent of overlap between differentially expressed genes (DEGs) and genes whose promoters exhibit changes in H3K4me3 levels (E) or DEGs and genes whose promoters exhibit changes in H3K27me3 levels (G) at the ADS stage in 84021 between HT and NT conditions. Significance levels for the common elements were determined by a hypergeometric test: ∗∗P < 0.01; ∗P < 0.05; ns, P > 0.05. (F) Fraction of DEGs with changes in H3K4me3 levels in their promoters in the same direction or in opposite directions across all samples. (H) Fraction of DEGs with changes in H3K27me3 levels in their promoters in the same direction or in opposite directions across ADS samples. Statistical significance was determined by paired two-tailed Student’s t-tests in (F and H): ∗∗P < 0.01; ∗P < 0.05; ns, P > 0.05. TSS, transcriptional start site; TDS, tapetum degradation stage; ADS, anther dehiscence stage.
Figure 3
Figure 3
Changes in bivalent H3K4me3–H3K27me3 marks are more pronounced under HT conditions. (A and B) Biological processes enriched in genes whose promoters exhibit significant changes in H3K4me3 (A) or H3K27me3 (B) levels under HT. Color key indicates the significance (log10(P value)) of the enriched GO terms among upregulated (right) and downregulated (left) DEGs. (C) Venn diagram showing the extent of overlap between H3K4me3-modified promoters and H3K27me3-modified promoters at the ADS stage in H05 under NT. The other samples are shown in Supplemental Figure 9. (D) Normalized expression levels of genes whose promoters harbor H3K4me3 only, H3K27me3 only, or both marks at the ADS stage in H05 under NT. (E and F) Metaplots of normalized tag numbers for promoters with bivalent H3K4me3–H3K27me3 marks or H3K4me3 only (E) and for promoters with bivalent H3K4me3–H3K27me3 marks or H3K27me3 only (F) at the ADS stage in H05 under NT. (G) The ratio of H3K4me3 signal intensity between HT and NT in promoters harboring bivalent H3K4me3–H3K27me3 marks or single H3K4me3 at the ADS in H05. (H) The ratio of H3K27me3 signal intensity between HT and NT in promoters harboring bivalent H3K4me3–H3K27me3 marks or single H3K27me3 at the ADS in H05. (I) Number of promoters with bivalent marks under NT and their significant changes in all samples under HT conditions. Top, promoters that lost bivalent marks under HT; bottom, promoters that gained bivalent marks under HT. (J) Biological processes enriched in genes whose promoters showed significant changes in bivalent marks. Color key indicates the significance (log10(P value)) of the enriched GO terms associated with loss (right) or gain (left) of bivalent marks. Statistical significance was determined using a Kolmogorov–Smirnov test in (D) and paired Student’s t-tests in (E)(H): ∗∗∗P < 0.001; ∗∗P < 0.01; ∗P < 0.05; ns, not significant.
Figure 4
Figure 4
H3K27me3 modulates JA homeostasis by regulating a number of JA-related genes under HT conditions. (A–D) Heatmap representation of expression levels (B and D) and H3K27me3 (A and C) modification levels at the promoters of all JA biosynthesis genes (A and B) and all JA signal transduction genes (C and D) at the ADS in 84021 and H05 under NT and HT conditions. (E) JA contents in H05 and 84021 at the TDS and ADS under NT and HT conditions. Samples were collected from the field. Values are means ± SE from six biologically independent experiments. Asterisks indicate significant differences (∗∗P < 0.01) based on Student’s t-test. (F) Representative anther phenotypes from each treatment. H05 + ddH2O → HT and H05 + MeJA → HT indicate treatment with distilled deionized water or MeJA, respectively, applied four times to flower buds of H05 (at 7, 5, 3, and 0 d before the temperature was increased to the stress point, which was followed by sustained HT damage for 7 d). The temperature was then restored to normal for 1 week, and photographs were taken. Scale bars, 1 cm.
Figure 5
Figure 5
Abnormal function of JA-related genes leads to male sterility. (A) Integrative Genomics Viewer windows for GhAOS and GhAOC2 loci showing the H3K27me3 signals and their expression levels at the ADS in 84021 and H05. (B) Genome editing of GhAOS, resulting in Ghaos plant1 and plant2. The sgRNA target sites and the protospacer adjacent motif (PAM) regions are highlighted in green and underlined, respectively. (C) Representative images of flowers from the WT, one Ghaos mutant, and one Ghaoc2 mutant. The anthers of Ghaos and Ghaoc2 are non-dehiscent. Scale bars, 5 mm. (D) Representative images of flowers from WT (YZ1) and GhJAZ1-overexpressing lines (JAZ1-OE#1 and JAZ1-OE#2) under NT conditions. Red arrows indicate non-dehiscent anthers. Scale bars, 5 mm. (E) Frequency of dehiscent anthers for WT and GhJAZ1-overexpression lines. Statistical significance was determined using an unpaired Student’s t-test: ∗∗P < 0.01; ∗P < 0.05; ns, not significant.
Figure 6
Figure 6
Suppression of H3K27me3 deposition rescues male fertility in cotton under HT conditions. (A and B) Normalized H3K27me3 modification levels (A) and metaplot (B) of H3K27me3 modification levels of promoter regions at the ADS in the H05–H3K27me3 inhibitor–HT treatment and H05–water–HT treatment. (C) Volcano plot of DEGs between the H05–H3K27me3 inhibitor–HT treatment and the H05–water–HT treatment at the ADS. Red circles, upregulated genes in the H05–H3K27me3 inhibitor–HT treatment; blue circles, downregulated genes in the H05–H3K27me3 inhibitor–HT treatment. (D) Treatment of H05 anthers with exogenous H3K27me3 inhibitor rescues their sterility defect. Red pollen grains are fertile, whereas white pollen grains are sterile. Scale bars, 5 mm (top), 100 μm (bottom). (E) Anther sections of H05–water–NT, H05–water–HT, H05–H3K27me3 inhibitor–NT, and H05–H3K27me3 inhibitor–HT at the TDS and ADS, showing the rescue of pollen development by treatment with an H3K27me3 inhibitor. Scale bars, 50 μm. T, tapetum; MSP, microspore; PG, pollen grain; En, endothecium. (F) Significantly enriched GO terms among DEGs between the H05–H3K27me3 inhibitor–HT treatment and the H05–water–HT treatment at the ADS. (G) Changes in H3K27me3 modification and mRNA expression levels of genes related to JA biosynthesis and JA response under the H05–H3K27me3 inhibitor–HT treatment at the ADS. (H and I) Integrative Genomics Viewer windows for the GhAOS(H) and GhAOC2(I) loci, showing their H3K27me3 signals and mRNA levels at the ADS in the H05–H3K27me3 inhibitor–HT treatment and the H05–water–HT treatment. (J) Relative expression levels of GhAOS and GhAOC2 in the H05–H3K27me3 inhibitor–HT treatment and the H05–water–HT treatment at the ADS, as determined by RT–qPCR. GhUBQ7 (Ghir_A11G011460) was used as an internal reference. Values are means ± SE (n = 4). (K) JA contents in the H05–H3K27me3 inhibitor–HT treatment and the H05–water–HT treatment. Samples were collected in the greenhouse. Values are means ± SE from six biologically independent experiments. Statistical significance was determined using the Wilcoxon rank sum test (A and G) and paired Student’s t-test (B, J, and K). ∗∗∗P < 0.001; ∗∗P < 0.01; ∗P < 0.05; ns, P > 0.05.
Figure 7
Figure 7
A model for H3K27me3-mediated control of male thermotolerance in cotton through modulation of jasmonate homeostasis. Levels of H3K27me3 modification decrease at the promoters of JA biosynthesis genes in the HT-tolerant line but are maintained at a high level in the HT-sensitive line under HT conditions, thus activating (HT tolerant) or repressing (HT sensitive) the expression of JA biosynthesis genes under HT conditions. Increased expression of JA biosynthesis genes in the HT-tolerant line leads to normal JA homeostasis, ultimately leading to male fertility under HT conditions. The relatively low expression of JA biosynthesis genes in the HT-sensitive line leads to disturbed JA homeostasis, ultimately leading to male sterility under HT conditions.

References

    1. Allis C.D., Jenuwein T. The molecular hallmarks of epigenetic control. Nat. Rev. Genet. 2016;17:487–500. - PubMed
    1. Ahmad P., Rasool S., Gul A., Sheikh S.A., Akram N.A., Ashraf M., Kazi A.M., Gucel S. Jasmonates: Multifunctional Roles in Stress Tolerance. Front. Plant Sci. 2016;7:813. - PMC - PubMed
    1. Anders S., Pyl P.T., Huber W. HTSeq--a Python framework to work with high-throughput sequencing data. Bioinformatics. 2015;31:166–169. - PMC - PubMed
    1. Azuara V., Perry P., Sauer S., Spivakov M., Jørgensen H.F., John R.M., Gouti M., Casanova M., Warnes G., Merkenschlager M., et al. Chromatin signatures of pluripotent cell lines. Nat. Cell Biol. 2006;8:532–538. - PubMed
    1. Bernstein B.E., Mikkelsen T.S., Xie X., Kamal M., Huebert D.J., Cuff J., Fry B., Meissner A., Wernig M., Plath K., et al. A bivalent chromatin structure marks key developmental genes in embryonic stem cells. Cell. 2006;125:315–326. - PubMed

Publication types

LinkOut - more resources