3D synaptic organization of layer III of the human anterior cingulate and temporopolar cortex
- PMID: 37455478
- PMCID: PMC10472499
- DOI: 10.1093/cercor/bhad232
3D synaptic organization of layer III of the human anterior cingulate and temporopolar cortex
Abstract
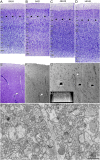
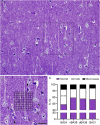
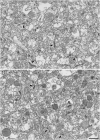
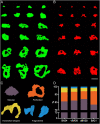
The human anterior cingulate and temporopolar cortices have been proposed as highly connected nodes involved in high-order cognitive functions, but their synaptic organization is still basically unknown due to the difficulties involved in studying the human brain. Using Focused Ion Beam/Scanning Electron Microscopy (FIB/SEM) to study the synaptic organization of the human brain obtained with a short post-mortem delay allows excellent results to be obtained. We have used this technology to analyze layer III of the anterior cingulate cortex (Brodmann area 24) and the temporopolar cortex, including the temporal pole (Brodmann area 38 ventral and dorsal) and anterior middle temporal gyrus (Brodmann area 21). Our results, based on 6695 synaptic junctions fully reconstructed in 3D, revealed that Brodmann areas 24, 21 and ventral area 38 showed similar synaptic density and synaptic size, whereas dorsal area 38 displayed the highest synaptic density and the smallest synaptic size. However, the proportion of the different types of synapses (excitatory and inhibitory), the postsynaptic targets, and the shapes of excitatory and inhibitory synapses were similar, regardless of the region examined. These observations indicate that certain aspects of the synaptic organization are rather homogeneous, whereas others show specific variations across cortical regions.
Keywords: FIB-SEM; autopsy; cerebral cortex; postsynaptic targets; ultrastructure.
© The Author(s) 2023. Published by Oxford University Press. All rights reserved. For permissions, please e-mail: journals.permissions@oup.com.
Figures


Similar articles
-
Volume electron microscopy analysis of synapses in primary regions of the human cerebral cortex.Cereb Cortex. 2024 Aug 1;34(8):bhae312. doi: 10.1093/cercor/bhae312. Cereb Cortex. 2024. PMID: 39106175 Free PMC article.
-
Three-Dimensional Synaptic Organization of Layer III of the Human Temporal Neocortex.Cereb Cortex. 2021 Aug 26;31(10):4742-4764. doi: 10.1093/cercor/bhab120. Cereb Cortex. 2021. PMID: 33999122 Free PMC article.
-
Three-dimensional synaptic organization of the human hippocampal CA1 field.Elife. 2020 Jul 21;9:e57013. doi: 10.7554/eLife.57013. Elife. 2020. PMID: 32690133 Free PMC article.
-
Short-term synaptic plasticity in the nociceptive thalamic-anterior cingulate pathway.Mol Pain. 2009 Sep 4;5:51. doi: 10.1186/1744-8069-5-51. Mol Pain. 2009. PMID: 19732417 Free PMC article. Review.
-
Silent synapses in pain-related anterior cingulate cortex.Mol Pain. 2023 Jan-Dec;19:17448069231179011. doi: 10.1177/17448069231179011. Mol Pain. 2023. PMID: 37227022 Free PMC article. Review.
Cited by
-
Volume electron microscopy reveals 3D synaptic nanoarchitecture in postmortem human prefrontal cortex.iScience. 2025 May 26;28(7):112747. doi: 10.1016/j.isci.2025.112747. eCollection 2025 Jul 18. iScience. 2025. PMID: 40585366 Free PMC article.
-
Unambiguous identification of asymmetric and symmetric synapses using volume electron microscopy.Front Neuroanat. 2024 Apr 5;18:1348032. doi: 10.3389/fnana.2024.1348032. eCollection 2024. Front Neuroanat. 2024. PMID: 38645671 Free PMC article.
-
Of mice and men: Dendritic architecture differentiates human from mice neuronal networks.bioRxiv [Preprint]. 2024 Dec 18:2023.09.11.557170. doi: 10.1101/2023.09.11.557170. bioRxiv. 2024. Update in: iScience. 2025 Jun 18;28(7):112928. doi: 10.1016/j.isci.2025.112928. PMID: 39763990 Free PMC article. Updated. Preprint.
-
Of mice and men: Dendritic architecture differentiates human from mouse neuronal networks.iScience. 2025 Jun 18;28(7):112928. doi: 10.1016/j.isci.2025.112928. eCollection 2025 Jul 18. iScience. 2025. PMID: 40687823 Free PMC article.
-
Invariance of Mitochondria and Synapses in the Primary Visual Cortex of Mammals Provides Insight Into Energetics and Function.J Comp Neurol. 2024 Sep;532(9):e25669. doi: 10.1002/cne.25669. J Comp Neurol. 2024. PMID: 39291629
References
-
- Baddeley A, Rubak E, Turner R. Spatial point patterns: methodology and applications with R. Boca Raton, CA: Chapman and Hall/CRC Press; 2015.
-
- Barbas H. General cortical and special prefrontal connections: principles from structure to function. Annu Rev Neurosci. 2015:38(1):269–289. - PubMed
Publication types
MeSH terms
LinkOut - more resources
Full Text Sources

