. 2023 Aug 1;136(15):jcs261355.
doi: 10.1242/jcs.261355. Epub 2023 Aug 9.

Targeted volume correlative light and electron microscopy of an environmental marine microorganism

Affiliations

Targeted volume correlative light and electron microscopy of an environmental marine microorganism

Karel Mocaer et al. J Cell Sci. .

Abstract

Photosynthetic microalgae are responsible for an important fraction of CO2 fixation and O2 production on Earth. Three-dimensional (3D) ultrastructural characterization of these organisms in their natural environment can contribute to a deeper understanding of their cell biology. However, the low throughput of volume electron microscopy (vEM) methods along with the complexity and heterogeneity of environmental samples pose great technical challenges. In the present study, we used a workflow based on a specific electron microscopy sample preparation method compatible with both light and vEM imaging in order to target one cell among a complex natural community. This method revealed the 3D subcellular landscape of a photosynthetic dinoflagellate, which we identified as Ensiculifera tyrrhenica, with quantitative characterization of multiple organelles. We show that this cell contains a single convoluted chloroplast and show the arrangement of the flagellar apparatus with its associated photosensitive elements. Moreover, we observed partial chromatin unfolding, potentially associated with transcription activity in these organisms, in which chromosomes are permanently condensed. Together with providing insights in dinoflagellate biology, this proof-of-principle study illustrates an efficient tool for the targeted ultrastructural analysis of environmental microorganisms in heterogeneous mixes.

Keywords: Correlative light and electron microscopy; Dinoflagellate; Environmental sample; Focused ion beam-scanning electron microscopy; Plankton; Volume electron microscopy.


Conflict of interest statement

Competing interests The authors declare no competing or financial interests.

Figures
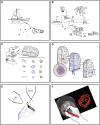
Fig. 1.
Fig. 1.
Workflow of the study. (A) Sample collection in the Villefranche-sur-Mer bay area, Mediterranean sea, France. (B) High-pressure freezing in close proximity to the sampling site, later followed by freeze substitution (FS) and resin embedding. (C) Mapping of the block using confocal microscopy and identification of various microorganisms present in the heterogeneous sample. (D) Targeting of a specific cell and determination of its x, y and z coordinates (red target), followed by ultramicrotome trimming to approach the cell of interest in z (in blue) and finally laser branding to mark the cell position in x and y on the block surface (in purple). (E) FIB-SEM acquisition of the cell of interest. (F) Segmentation of the organelles of the targeted cell. Here, the chloroplast is shown during segmentation and after rendering in red.
Fig. 2.
Fig. 2.
Confocal characterization of the high-pressure-frozen freeze-substituted planktonic sample embedded in a plastic block. (A) 3D rendering of the two-color tiled z-stack confocal acquisition of the resin block. (B–M) Fluorescence (B,C,F,G,J,M) and transmitted light (D,H,L) imaging of three different cells from A. The imaging settings are the same for the different cells in each channel. Maximum-intensity projections of the confocal stacks are displayed for both fluorescence channels. For the transmitted light channel, single slices are shown. Fluorescence and transmitted light images are overlaid in E,I,M. The cells were putatively identified as belonging to the genera Prorocentrum (B–E), Cochlodinium (F–I) and Protoperidinium (J–M).
Fig. 3.
Fig. 3.
Targeting of a cell of interest (a photosynthetic dinoflagellate). (A) 3D rendering of a high-resolution confocal stack in a selected area allows the identification of the target dinoflagellate cell (dashed square). (B,C) Confocal xz views of the cell of interest in the resin block before (B) and after (C) the trimming steps. The arrowhead indicates the block surface, as visualized in the reflection channel (cyan). Distance between the upper edge of the cell and the block surface is displayed. The dashed circle corresponds to the target position of the cell to be acquired by FIB-SEM. (D) NIR branding of the block surface generates landmarks around the cell of interest, visualized by transmitted light. (E) The embossed lines generated by the branding are visible by FIB imaging. These lines are used to define the region to be acquired by FIB-SEM. The overlaid profiles (green trapezoid and rectangle, red lines and yellow bounding box) illustrate the software (Atlas) sample preparation shapes used to define the slice-and-view acquisition. (F) SEM view of the imaging surface after FIB sample preparation, right before starting the acquisition. The cell of interest is not exposed yet and the dashed circle represents its predicted position from Fig. 2C. (G) Low magnification SEM overview (keyframe) during the acquisition, showing the precision of the region-of-interest prediction. The dashed circle is in the same position as in F.
Fig. 4.
Fig. 4.
Overlay of autofluorescence signal and ultrastructure from vEM. (A) Fluorescence pattern of the cell of interest. The image shows a confocal slice along the longitudinal axis, with an optical thickness of 2.2 µm. (B) Single orthoslice through the FIB-SEM volume in the region corresponding to the fluorescence signal. (C) Fluorescence and FIB-SEM overlay. A single slice of the overlay is shown. The pattern of the 633 nm excited signal clearly overlaps with the position of the chloroplast and nucleus.
Fig. 5.
Fig. 5.
Morphometrics of organelles in the targeted photosynthetic dinoflagellate. (A) 3D rendering of the theca in ventral (top) and antiapical views (center, bottom). The enlargement of the antiapical view in the lower panel shows the pore arrangement and presence of small knobs on the lower plates. All images of intracellular organelle segmentation (B–E) are shown in the same orientation as the top panel (ventral view), with the theca shown in transparency. (B) Segmentation of the nucleus/nuclear envelope (NE) (cyan) and Golgi apparatus (yellow). (C) Segmentation of the single convoluted chloroplast (red) and associated starch (white). (D) Segmentation of the mitochondrion (green). (E) Segmentation of the mucocysts (orange). (F) Segmentation of the trichocysts (T). Short linear trichocysts are shown in magenta. Long and convoluted trichocysts are in light pink. (G) Size distribution of the two classes of trichocysts. n=80 for the short and 41 for the long class. Each individual point represents the measurement of a trichocyst. Means±s.d. are shown on the graph. (H) Volumes of the segmented organelles expressed as relative percentage of the full cell volume (1008.76 µm3).
Fig. 6.
Fig. 6.
Nucleus and chromatin organization. (A) Single orthoslice through the FIB-SEM volume in the nuclear region (NE, nuclear envelope; nu, nucleolus, chr, condensed chromosome). The arrowhead highlights filamentous structures originating from a small chromosome and expanding in the nucleolus. (B) 3D rendering of the segmentation of the chromatin (white in transparency), nucleolus (purple in transparency) and filamentous structure (light blue) associated with small chromosomes located adjacent to the nucleolus (dark blue). (C) Close up view of the segmentation of nucleolus (purple in transparency) with associated small chromosomes (dark blue) and extended filamentous structure (light blue). (D) Rendering of the segmentation of the intranucleolar filamentous chromatin structure overlaid with an image of the raw data, illustrating the connection between the filament and the small chromosome associated with the nucleolus.
Fig. 7.
Fig. 7.
3D organization of the flagellar apparatus and eyespot. (A) Single orthoslice through the FIB-SEM volume in the eyespot region (C, chloroplast; T, theca). The filled arrowhead indicates the eyespot and empty arrowhead indicates the longitudinal flagellum. (B) 3D rendering of the segmentation of the eyespot (white), located within the chloroplast (red in transparency), and of the flagella (green) and associated filaments (yellow). The theca is shown in white in transparency. (C) Rendering of the segmentation of the longitudinal flagellum overlaid with a slice of the FIB-SEM volume. Arrowheads indicate the position of the theca, demonstrating that the flagellum extends inside the theca. (D) Rendering of the segmentation of a microtubule sheet (yellow) overlaid with a slice through the volume, showing the basal body of the flagellum (arrowhead). (E,F) Close up of the segmentation of the chloroplast (red in transparency), flagella (green) and associated filaments (yellow), as well as the eyespot (white) located within the chloroplast. Part of the array, close to the longitudinal flagellum, could not be fully discriminated with the resolution of our dataset. Even though the array seemed to extend towards the eyespot, segmentation was performed only on the part we could unambiguously assign.

References

    1. Belevich, I., Joensuu, M., Kumar, D., Vihinen, H. and Jokitalo, E. (2016). Microscopy image browser: a platform for segmentation and analysis of multidimensional datasets. PLoS Biol. 14, e1002340. 10.1371/journal.pbio.1002340 - DOI - PMC - PubMed
    1. Bhaud, Y., Guillebault, D., Lennon, J., Defacque, H., Soyer-Gobillard, M. O. and Moreau, H. (2000). Morphology and behaviour of dinoflagellate chromosomes during the cell cycle and mitosis. J. Cell Sci. 113, 1231-1239. 10.1242/jcs.113.7.1231 - DOI - PubMed
    1. Bouck, G. B. and Sweeney, B. M. (1966). The fine structure and ontogeny of trichocysts in marine dinoflagellates. Protoplasma 61, 205-223. 10.1007/BF01247920 - DOI - PubMed
    1. Calado, A. J. and Moestrup, Ø. (2002). Ultrastructural study of the type species of Peridiniopsis, Peridiniopsis borgei (Dinophyceae), with special reference to the peduncle and flagellar apparatus. Phycologia 41, 567-584. 10.2216/i0031-8884-41-6-567.1 - DOI
    1. Calado, A. J., Hansen, G. and Moestrup, Ø. (1999). Architecture of the flagellar apparatus and related structures in the type species of peridinium, p. cinctum (dinophyceae). Eur. J. Phycol. 34, 179-191. 10.1080/09670269910001736232 - DOI

Publication types

MeSH terms