. 2023 Jun 27:12:336.
doi: 10.12688/f1000research.131283.2. eCollection 2023.

The genome sequence of the Loggerhead sea turtle, Caretta caretta Linnaeus 1758

Affiliations

The genome sequence of the Loggerhead sea turtle, Caretta caretta Linnaeus 1758

Glenn Chang et al. F1000Res. .

Abstract

We present a genome assembly of Caretta caretta (the Loggerhead sea turtle; Chordata, Testudines, Cheloniidae), generated from genomic data from two unrelated females. The genome sequence is 2.13 gigabases in size. The assembly has a busco completion score of 96.1% and N50 of 130.95 Mb. The majority of the assembly is scaffolded into 28 chromosomal representations with a remaining 2% of the assembly being excluded from these.

Keywords: Caretta caretta; Loggerhead sea turtle; chromosomal; genome sequence; reptile.


Conflict of interest statement

No competing interests were disclosed.

Figures
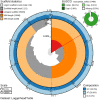
Figure 1.
Figure 1.. Genome assembly of Caretta caretta, rCarCar2: metrics.
Snail plot showing N50 metrics, base pair composition and BUSCO gene completeness for C. caretta (rCarCar2) generated from Blobtoolkit v.2.6.4 ( Challis et al., 2020). The plot is divided into 1,000 size-ordered bins around the circumference with each bin representing 0.1% of the 2,134,012,717 bp assembly. The distribution of chromosome lengths is shown in dark grey with the plot radius scaled to the longest chromosome present in the assembly (345,741,823 bp) shown in red. Orange and pale-orange arcs show the N50 and N90 chromosome lengths (130,956,235 and 23,648,662 bp, respectively). The pale grey spiral shows the cumulative chromosome count on a log scale with white scale lines showing successive orders of magnitude. The blue and pale-blue area around the outside of the plot displays the distribution of GC (blue), AT (pale blue) and N (white) percentages using the same bins as the inner plot. A summary of complete (96.1%), fragmented (0.4%), duplicated (0.9%), and missing (3.5%) BUSCO genes in the sauropsida_odb10 set is show in the top right.
Figure 2.
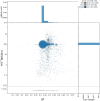
Figure 2.. Genome assembly of Caretta caretta, rCarCar2: GC-content.
GC-coverage plot of C. caretta (rCarCar2) generated from Blobtoolkit v.2.6.4 ( Challis et al., 2020). Scaffolds are coloured by phylum with Chordata represented by blue and no-hit represented by pale blue. Circles are sized in proportion to scaffold length. Histograms show the distribution of scaffold length sum along each axis.
Figure 3.
Figure 3.. Genome assembly of Caretta caretta, rCarCar2: cumulative sequence length.
Cumulative sequence length of C. caretta (rCarCar2) generated from Blobtoolkit v.2.6.4 ( Challis et al., 2020). The grey line shows the cumulative length for all scaffolds. Coloured lines show cumulative lengths of scaffolds assigned to each phylum using the BUSCO genes tax rule, with Chordata represented by blue and no-hit represented by pale blue.
Figure 4.
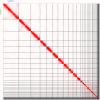
Figure 4.. Genome assembly of Caretta caretta, rCarCar2: Hi-C contact map.
HiC contact map of rCarCar2 assembly visualized using JuiceBox v2.13.07 ( Durand et al., 2016a). Chromosomes are shown in order of size from left to right and top to bottom. As an additional confirmation for the quality of the assembly, the microchromosomes are visible as a cluster of spatially-associated contigs in the lower right, as reported in by Waters et al., 2021.
Figure 5.
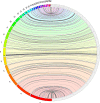
Figure 5.. Jupiter plot alignment of Caretta caretta with Chelonia mydas (green sea turtle).
Full genome alignment of Caretta caretta genome, rCarCar2 (right), and Chelonia mydas (green sea turtle) genome (primary haplotype v2), rCheMyd1 (left), generated using Jupiter Plot ( Chu, 2018). The left of the circle shows 28 green sea turtle chromosomes and the right of the circle shows 28 loggerhead sea turtle chromosomes. Coloured bands represent synteny between the genomes, and lines crossing the circle indicate genomic rearrangements, or break points in the scaffolds.

References

    1. Aken BL, et al. : The Ensembl gene annotation system. Database. 2016;2016. 10.1093/database/baw093 - DOI - PMC - PubMed
    1. Alduina R, Gambino D, Presentato A, et al. : Is Caretta caretta a carrier of antibiotic resistance in the Mediterranean Sea? Antibiotics. 2020;9(3):116. 10.3390/antibiotics9030116 - DOI - PMC - PubMed
    1. Caracappa S, Persichetti M, Piazza A, et al. : Incidental catch of loggerhead sea turtles (Caretta caretta) along the Sicilian coasts by longline fishery. PeerJ. 2018;6:e5392. 10.7717/peerj.5392 - DOI - PMC - PubMed
    1. Casale P, Tucker A: Caretta caretta (amended version of 2015 assessment). IUCN red list of threatened species. 2015. 10.2305/iucn.uk.2017-2.rlts.t3897a119333622.en - DOI
    1. Challis R, Richards E, Rajan J, et al. : BlobToolKit – Interactive quality assessment of genome assemblies. G3: Genes, Genomes, Genetics. 2020;10(4):1361–1374. 10.1534/g3.119.400908 - DOI - PMC - PubMed

Publication types