. 2023 Jun 19;26(7):107167.
doi: 10.1016/j.isci.2023.107167. eCollection 2023 Jul 21.

Probiotics formulation and cancer nanovaccines show synergistic effect in immunotherapy and prevention of colon cancer

Affiliations

Probiotics formulation and cancer nanovaccines show synergistic effect in immunotherapy and prevention of colon cancer

Xiangxiang Xu et al. iScience. .

Abstract

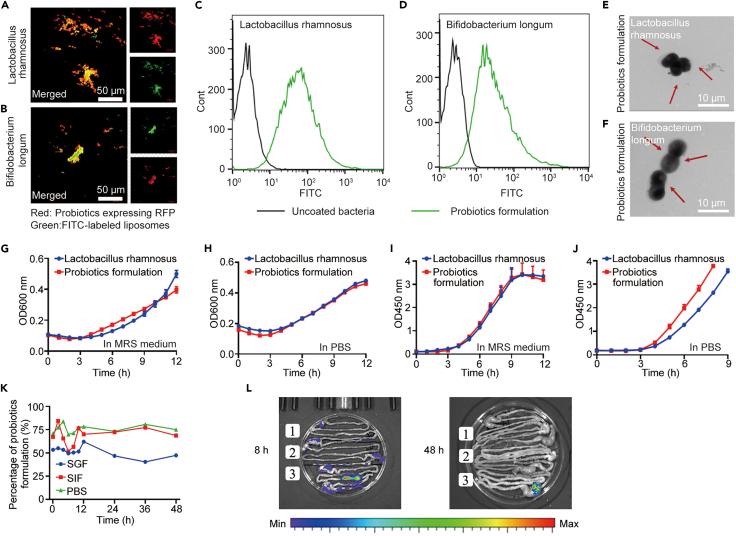
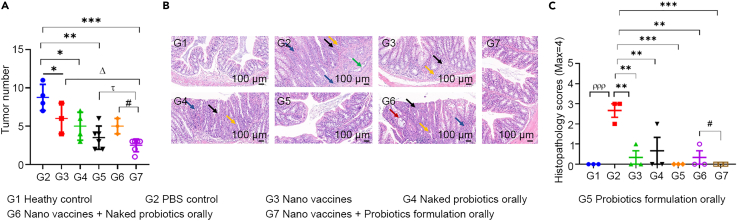
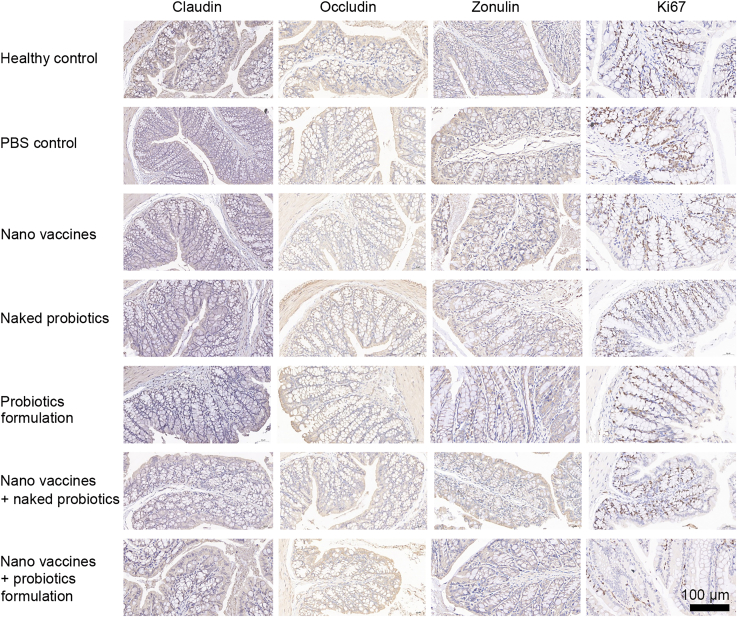
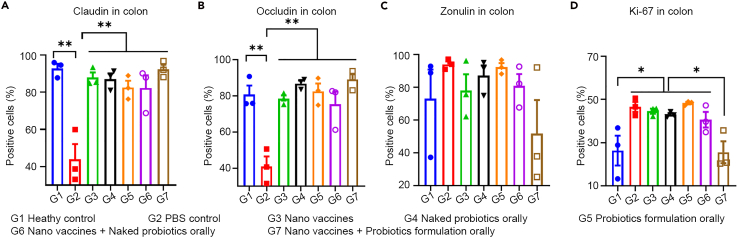
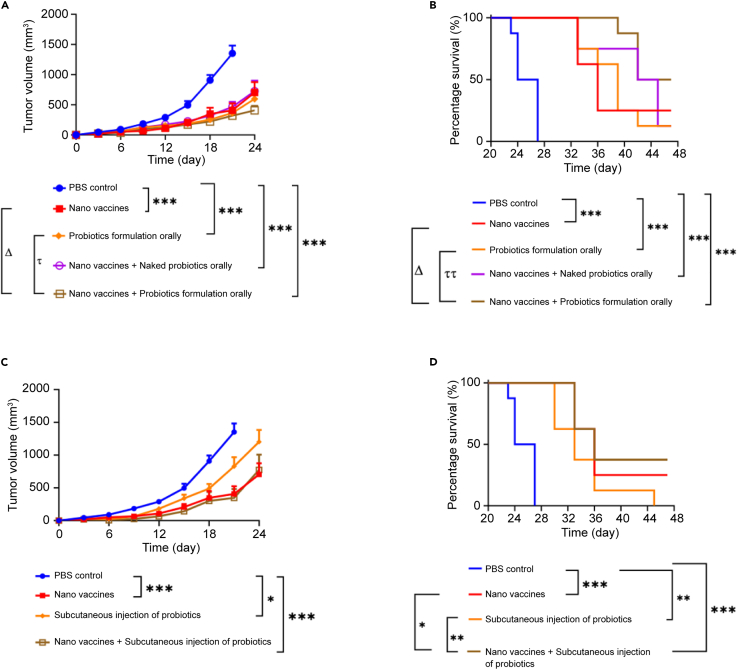
Probiotics play essential roles in immune modulation. Combining probiotics with cancer vaccines potentially can achieve a synergistic effect. To maximize the efficacy of probiotics, proper probiotics formulation is necessary. Herein, Lactobacillus rhamnosus and Bifidobacterium longum are coated with lipid membrane to achieve the goal of losing less activity and bettering colonization in colon. In the subcutaneous transplanted colon cancer mouse model, probiotics formulation showed potent preventive and therapeutic efficacy, and the efficacy could be further improved by combining with cancer nanovaccines. Probiotics formulation can perform as immune adjuvants to enhance the innate immune response or as in-situ cancer vaccines. In the study of preventing chemical-induced orthotopic colon cancer model, probiotics formulation alone efficiently reduced tumor number in colon and the efficacy is improved by combining with cancer nanovaccines. All in all, the studies demonstrated that probiotics formulation can assist to maximize the efficacy of cancer nanovaccines.

Keywords: Biological sciences; Biotechnology; Cancer; Immunology; Microbiology; Nanocomplex.


Conflict of interest statement

M.L. is a shareholder of Suzhou Ersheng Biopharmaceutical Co., Ltd, Suzhou, People’s Republic of China. M.L. has applied a patent related to this study. The remaining authors have reported no financial interests or potential conflicts of interest.

Figures

None
Graphical abstract
Figure 1
Figure 1
Schematic illustration of combined application of probiotics formulation and cancer vaccines (A) Preparation of probiotics formulation. (B) Schematic diagram of probiotics formulation orally administration combined with nanovaccines. (C) Schematic diagram of probiotics formulation intratumoral administration combined with nanovaccines.
Figure 2
Figure 2
Characterization of probiotics formulations and activity test of probiotics formulation and GI track retention test. Representative LSCM images of Lactobacillus rhamnosus (A) and Bifidobacterium longum (B) based probiotics formulation (scale bar: 50 μm , Red: Probiotics expressing RFP, Green: FITC-labeled liposomes, Yellow: Merged). Flow cytometric analysis of FITC-labeled probiotics formulation (Lactobacillus rhamnosus (C) and Bifidobacterium longum (D). Representative TEM images of Lactobacillus rhamnosus (E) and Bifidobacterium longum (F) based probiotics formulation (scale bar: 10 μm). (G and H) The growth curves of LGG/probiotics formulation in MRS medium/PBS. (I and J) The cell viability of LGG/probiotics formulation in MRS medium/PBS. (K) Flow cytometric analysis of probiotics formulation after incubation in SGF/SIF/PBS. (L) Representative IVIS images of mouse intestinal tracts after oral gavage of PBS (1), naked Escherichia coli carrying pGEN- luxCDABE (2) and LCB (3) for 8 h/48 h.
Figure 3
Figure 3
Analysis of the efficacy of probiotic formulations (orally administration) and nanovaccines in preventing AOM/DSS-induced orthotopic colon cancer (A) The number of colon tumors in mice with various treatments. (B) H&E staining analysis of mouse colon of each group (1000×, scale bar: 100 μm). (C) The pathological scores of the colons in each group after H&E staining (n = 3). ∗, τ,# and Δ means significant difference and p 0.05; ∗∗ means significant difference and p 0.01;∗∗∗ and ρρρ means significant difference and p 0.005.
Figure 4
Figure 4
Analysis of colonic goblet cells in mice in each group after AOM/DSS treatment induction of colon cancer (A) The AB/PAS staining analysis images of the colons of the mice in each group (200×, scale bar: 100 μm). (B) The number of goblet cells per unit length of the colons of the mice in each group after AB/PAS staining (n = 3). ∗ Means significant difference and p 0.05; ∗∗ means significant difference and p 0.01;∗∗∗ means significant difference and p 0.005.
Figure 5
Figure 5
IHC staining analysis of claudin, occludin, zonulin and Ki67 after AOM/DSS induction (200×, scale bar: 100 μm)
Figure 6
Figure 6
Immunohistochemical analysis of tight junction protein in colon (A) Analysis of the proportion of claudin-positive cells in colon after AOM/DSS induction. (B) Analysis of the proportion of occludin-positive cells in colon after AOM/DSS induction. (C) Analysis of the proportion of zonulin-positive cells in colon after AOM/DSS induction. (D) Analysis of the proportion of Ki-67 positive cells in colon after AOM/DSS induction (n = 3). ∗ Means significant difference and p 0.05; ∗∗ means significant difference and p 0.01.
Figure 7
Figure 7
Probiotics formulation combined with cancer nanovaccine suppressed the growth of MC38 colon tumor (A) Treatment strategy of nanovaccines for colon cancer bearing mice. (B) Treatment strategy of naked or formulated probiotics for colon cancer bearing mice. (C and D) Tumor growth curves and survival curves of mice treated with oral probiotics formulation and/or subcutaneous injection of nanovaccines (n = 8). (E and F) Tumor growth curves and survival curves of mice when treated with intratumoral injection of probiotics formulation and/or subcutaneous injection of nanovaccines (n = 8). ∗, δ and Δ means significant difference and p 0.05; ∗∗, ΔΔ,ττ and ## means significant difference and p 0.01;∗∗∗means significant difference and p 0.005.
Figure 8
Figure 8
Analysis of tumor antigen-specific T cells in mouse splenocytes and in tumor microenvironment after treated with probiotics and nanovaccines (A) Flow cytometry analysis of the percentage of IFN-γ+ CD8+ T cells in splenocytes (n = 3). (B) Flow cytometry analysis of IFN-γ+ CD4+ T cells in splenocytes (n = 3). (C) Flow cytometry analysis of the percentage of total T cells in all tumor tissue cells (n = 3). (D) Flow cytometry analysis of the percentage of CD8+ IFN-γ+cells in all tumor tissue cells (n = 3). (E) Flow cytometry analysis of the percentage of CD4+ IFN-γ+T cells in all tumor tissue cells (n = 3). (F) Analysis of the ratio of Teff (CD3+ CD8+) over Treg (CD3+ CD25+ FOXP3+)in all tumor tissue cells (n = 3). (G) Flow cytometry analysis of the percentage of DC in all tumor tissue cells (n = 3). (H) Flow cytometry analysis of the percentage of macrophages in all tumor tissue cells (n = 3). (I) Flow cytometry analysis of the percentage of NK cells in all tumor tissue cells (n = 3). # means significant difference and p 0.05; ## means significant difference and p 0.01;###means significant difference and p 0.005.
Figure 9
Figure 9
Comparison of the efficacy of probiotics formulations (oral or subcutaneous injection) and nanovaccines (subcutaneous injection) in preventing MC38 colon cancer (A and B) Tumor growth curves and mouse survival curves of mice prevented by orally administered probiotics formulation and subcutaneous injected nanovaccines (n = 8). (C and D) Tumor growth curves and mouse survival curves of mice prevented by subcutaneous injection of probiotics and nanovaccines (n = 8). ∗ Means significant difference and p 0.05; ∗∗ means significant difference and p 0.01;∗∗∗ means significant difference and p 0.005.

References

    1. Labianca R., Beretta G.D., Kildani B., Milesi L., Merlin F., Mosconi S., Pessi M.A., Prochilo T., Quadri A., Gatta G., et al. Colon cancer. Crit. Rev. Oncol. Hematol. 2010;74:106–133. doi: 10.1016/j.critrevonc.2010.01.010. - DOI - PubMed
    1. Taghizadeh H., Prager G.W. Personalized Adjuvant Treatment of Colon Cancer. Visc. Med. 2020;36:397–406. doi: 10.1159/000508175. - DOI - PMC - PubMed
    1. Sung H., Ferlay J., Siegel R.L., Laversanne M., Soerjomataram I., Jemal A., Bray F. Global Cancer Statistics 2020: GLOBOCAN Estimates of Incidence and Mortality Worldwide for 36 Cancers in 185 Countries. Ca - Cancer J. Clin. 2021;71:209–249. doi: 10.3322/caac.21660. - DOI - PubMed
    1. Page A.J., Cosgrove D.C., Herman J.M., Pawlik T.M. Advances in understanding of colorectal liver metastasis and implications for the clinic. Expet Rev. Gastroenterol. Hepatol. 2015;9:245–259. doi: 10.1586/17474124.2014.940897. - DOI - PubMed
    1. Gao J., Logan K.A., Nesbitt H., Callan B., McKaig T., Taylor M., Love M., McHale A.P., Griffith D.M., Callan J.F. A single microbubble formulation carrying 5-fluorouridine, Irinotecan and oxaliplatin to enable FOLFIRINOX treatment of pancreatic and colon cancer using ultrasound targeted microbubble destruction. J. Contr. Release. 2021;338:358–366. doi: 10.1016/j.jconrel.2021.08.050. - DOI - PubMed

LinkOut - more resources