. 2023 Jul 10:11:e15661.
doi: 10.7717/peerj.15661. eCollection 2023.

Varying intensities of chronic stress induce inconsistent responses in weight and plasma metabolites in house sparrows (Passer domesticus)

Affiliations

Varying intensities of chronic stress induce inconsistent responses in weight and plasma metabolites in house sparrows (Passer domesticus)

Ursula K Beattie et al. PeerJ. .

Abstract

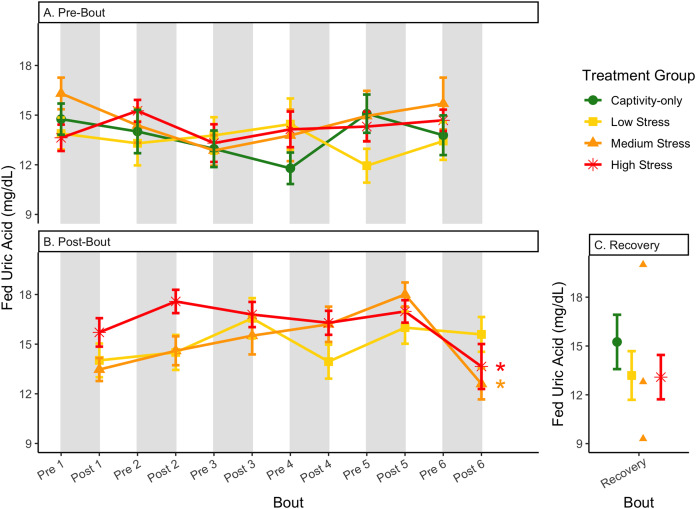
One of the biggest unanswered questions in the field of stress physiology is whether variation in chronic stress intensity will produce proportional (a gradient or graded) physiological response. We were specifically interested in the timing of the entrance into homeostatic overload, or the start of chronic stress symptoms. To attempt to fill this knowledge gap we split 40 captive house sparrows (Passer domesticus) into four groups (high stress, medium stress, low stress, and a captivity-only control) and subjected them to six bouts of chronic stress over a 6-month period. We varied the number of stressors/day and the length of each individual bout with the goal of producing groups that would experience different magnitudes of wear-and-tear. To evaluate the impact of chronic stress, at the start and end of each stress bout we measured body weight and three plasma metabolites (glucose, ketones, and uric acid) in both a fasted and fed state. All metrics showed significant differences across treatment groups, with the high stress group most frequently showing the greatest changes. However, the changes did not produce a consistent profile that matched the different chronic stress intensities. We also took samples after a prolonged recovery period of 6 weeks after the chronic stressors ended. The only group difference that persisted after 6 weeks was weight-all differences across groups in metabolites recovered. The results indicate that common blood metabolites are sensitive to stressors and may show signs of wear-and-tear, but are not reliable indicators of the intensity of long-term chronic stress. Furthermore, regulatory mechanisms are robust enough to recover within 6 weeks post-stress.

Keywords: Glucose; House sparrow; Ketones; Plasma metabolites; Reactive scope; Stress; Uric acid.


Conflict of interest statement

The authors declare that they have no competing interests.

Figures

Figure 1
Figure 1. Timeline of chronic stress and samples taken.
Panels correspond to treatment group, with group names on the left side. Grey rectangles indicate periods of applied chronic stress. Black-outlined shapes represent a decrease, consistent, or increase in the numbers of stressors birds experience in day. Black dots indicate a blood sample taken.
Figure 2
Figure 2. Point-of-care devices detect post-prandial metabolite changes.
Glucose and uric acid increase after feeding because of glucose and uric acid in diet (A and C). β-hydroxybutyrate decreases (B) after feeding as birds stop relying on ketones for energy (as during phase II of fasting). Refeeding was done remotely to show that experimenter presence during refeeding does not affect metabolite levels. Asterisks indicate p < 0.05.
Figure 3
Figure 3. Statistical pipeline for weight and metabolite analyses.
“Metric” (to the left of the tilde) indicate what metric is being statistically tested (i.e., weight, fasted/fed/fold-change glucose, ketones, or uric acid). The factors to the right of the tilde are the factors being tested in the statistical analysis. The asterisk indicates where interactions were tested. “(1|Bird)” indicates that bird was a random effect and thus controlled for statistically. Captivity-only birds were only sampled at “pre-bout” timepoints (though they did not actually experience bouts of stress).
Figure 4
Figure 4. Weight changes during 6 months of chronic stress and after 6 weeks of recovery.
Birds were subjected to six bouts of chronic stress of varying length (depicted as grey regions in (A) and (B)) and intensity, depending on treatment group. Weights were measured at the start (A) and end (B) of each bout, as well as after 6 weeks of chronic stress (C). Graphed values represent percent change from initial weight, but statistics were performed on raw values. In (A) and (B), asterisks indicate treatment groups with a significant effect (p < 0.05) of bout and letters indicate post hoc analysis across groups. Annotation in (C) reflects significant differences (p < 0.05) from an ANOVA. The medium stress group was excluded from recovery analysis due to low sample size but is graphed for completeness.
Figure 5
Figure 5. Changes in blood glucose in a fasted state through 6 months of chronic stress and after 6 weeks of recovery.
Birds were subjected to six bouts of chronic stress of varying length (depicted as grey regions in (A) and (B)) and intensity, depending on treatment group. Blood samples for metabolite analysis were measured at the start (A) and end (B) of each bout, as well as after 6 weeks of chronic stress (C). In (A) and (B), asterisks indicate treatment groups with a significant effect (p < 0.05) of bout. The medium stress group was excluded from recovery analysis due to low sample size but is graphed for completeness.
Figure 6
Figure 6. Changes in blood glucose in a fed state through 6 months of chronic stress and after 6 weeks of recovery.
Birds were subjected to six bouts of chronic stress of varying length (depicted as grey regions in (A) and (B)) and intensity, depending on treatment group. Blood samples for metabolite analysis were measured at the start (A) and end (B) of each bout, as well as after 6 weeks of chronic stress (C). In (B), asterisks indicate treatment groups with a significant effect (p < 0.05) of bout. The medium stress group was excluded from recovery analysis due to low sample size but is graphed for completeness.
Figure 7
Figure 7. Changes in postprandial fold-change blood glucose through 6 months of chronic stress and after 6 weeks of recovery.
Fold-change was calculated by dividing fed blood glucose by fasted blood glucose. Birds were subjected to six bouts of chronic stress of varying length (depicted as grey regions in (A) and (B)) and intensity, depending on treatment group. Blood samples for metabolite analysis were measured at the start (A) and end (B) of each bout, as well as after 6 weeks of chronic stress (C). In (A), letters indicate post hoc analysis across groups. The medium stress group was excluded from recovery analysis due to low sample size but is graphed for completeness.
Figure 8
Figure 8. Changes in blood ketones (β-hydroxybutyrate) in a fasted state through 6 months of chronic stress and after 6 weeks of recovery.
Birds were subjected to six bouts of chronic stress of varying length (depicted as grey regions in (A) and (B)) and intensity, depending on treatment group. Blood samples for metabolite analysis were measured at the start (A) and end (B) of each bout, as well as after 6 weeks of chronic stress (C). In (B), asterisks indicate treatment groups with a significant effect (p < 0.05) of bout. The medium stress group was excluded from recovery analysis due to low sample size but is graphed for completeness.
Figure 9
Figure 9. Changes in blood ketones (β-hydroxybutyrate) in a fed state through 6 months of chronic stress and after 6 weeks of recovery.
Birds were subjected to six bouts of chronic stress of varying length (depicted as grey regions in (A) and (B)) and intensity, depending on treatment group. Blood samples for metabolite analysis were measured at the start (A) and end (B) of each bout, as well as after 6 weeks of chronic stress (C). In (A) and (B), asterisks indicate treatment groups with a significant effect (p < 0.05) of bout and letters indicate post hoc analysis across groups. The medium stress group was excluded from recovery analysis due to low sample size but is graphed for completeness.
Figure 10
Figure 10. Changes in postprandial fold-change blood ketones (b-hydroxybutyrate) through 6 months of chronic stress and after 6 weeks of recovery.
Fold-change was calculated by dividing fed blood β-hydroxybutyrate by fasted blood β-hydroxybutyrate. Birds were subjected to six bouts of chronic stress of varying length (depicted as grey regions in (A) and (B)) and intensity, depending on treatment group. Blood samples for metabolite analysis were measured at the start (A) and end (B) of each bout, as well as after 6 weeks of chronic stress (C). In (A) and (B), asterisks indicate treatment groups with a significant effect (p < 0.05) of bout. The medium stress group was excluded from recovery analysis due to low sample size but is graphed for completeness.
Figure 11
Figure 11. Changes in uric acid in a fasted state through 6 months of chronic stress and after 6 weeks of recovery.
Birds were subjected to six bouts of chronic stress of varying length (depicted as grey regions in (A) and (B)) and intensity, depending on treatment group. Blood samples for metabolite analysis were measured at the start (A) and end (B) of each bout, as well as after 6 weeks of chronic stress (C). In (A) and (B), asterisks indicate treatment groups with a significant effect (p < 0.05) of bout and letters indicate post hoc analysis across groups. The medium stress group was excluded from recovery analysis due to low sample size but is graphed for completeness.
Figure 12
Figure 12. Changes in blood uric acid in a fed state through 6 months of chronic stress and after 6 weeks of recovery.
Birds were subjected to six bouts of chronic stress of varying length (depicted as grey regions in (A) and (B)) and intensity, depending on treatment group. Blood samples for metabolite analysis were measured at the start (A) and end (B) of each bout, as well as after 6 weeks of chronic stress (C). In (B), asterisks indicate treatment groups with a significant effect (p < 0.05) of bout. The medium stress group was excluded from recovery analysis due to low sample size but is graphed for completeness.
Figure 13
Figure 13. Changes in postprandial fold-change blood uric acid through 6 months of chronic stress and after 6 weeks of recovery.
Fold-change was calculated by dividing fed blood uric acid by fasted blood uric acid. Birds were subjected to six bouts of chronic stress of varying length (depicted as grey regions in (A)) and intensity, depending on treatment group. Blood samples for metabolite analysis were measured at the start and end of each bout (A), as well as after 6 weeks of chronic stress (B). There was no significant difference between samples taken at the start vs. end of the bout, so they are graphed together. In (A), letters indicate post hoc analysis across groups (p < 0.05). The medium stress group was excluded from recovery analysis due to low sample size but is graphed for completeness.

References

    1. Alonso-Alvarez C, Ferrer M. A biochemical study of fasting, subfeeding, and recovery processes in yellow-legged gulls. Physiological and Biochemical Zoology. 2001;74(5):703–713. doi: 10.1086/322932. - DOI - PubMed
    1. Armario A, Lopez-Calderón A, Jolin T, Castellanos JM. Sensitivity of anterior pituitary hormones to graded levels of psychological stress. Life Sciences. 1986;39(5):471–475. doi: 10.1016/0024-3205(86)90527-8. - DOI - PubMed
    1. Armario A, Marti J, Gil M. The serum glucose response to acute stress is sensitive to the intensity of the stressor and to habituation. Psychoneuroendocrinology. 1990;15(5–6):341–347. doi: 10.1016/0306-4530(90)90059-I. - DOI - PubMed
    1. Armario A, Montero JL, Balasch J. Sensitivity of corticosterone and some metabolic variables to graded levels of low intensity stresses in adult male rats. Physiology & Behavior. 1986;37(4):559–561. doi: 10.1016/0031-9384(86)90285-4. - DOI - PubMed
    1. Awerman JL, Romero LM. Chronic psychological stress alters body weight and blood chemistry in European starlings (Sturnus vulgaris) Comparative Biochemistry and Physiology Part A: Molecular & Integrative Physiology. 2010;156(1):136–142. doi: 10.1016/j.cbpa.2010.01.010. - DOI - PubMed

Publication types

Supplementary concepts

LinkOut - more resources