. 2023 Jun 7:40:58-71.
doi: 10.1016/j.jot.2023.05.001. eCollection 2023 May.

Osteocyte β3 integrin promotes bone mass accrual and force-induced bone formation in mice

Affiliations

Osteocyte β3 integrin promotes bone mass accrual and force-induced bone formation in mice

Lei Qin et al. J Orthop Translat. .

Abstract

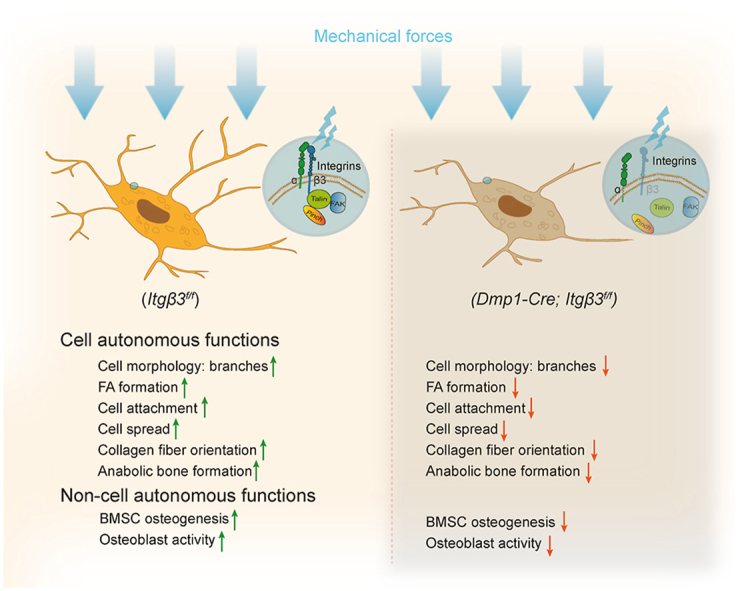
Background: Cell culture studies demonstrate the importance of β3 integrin in osteocyte mechanotransduction. However, the in vivo roles of osteocyte β3 integrin in the regulation of bone homeostasis and mechanotransduction are poorly defined.

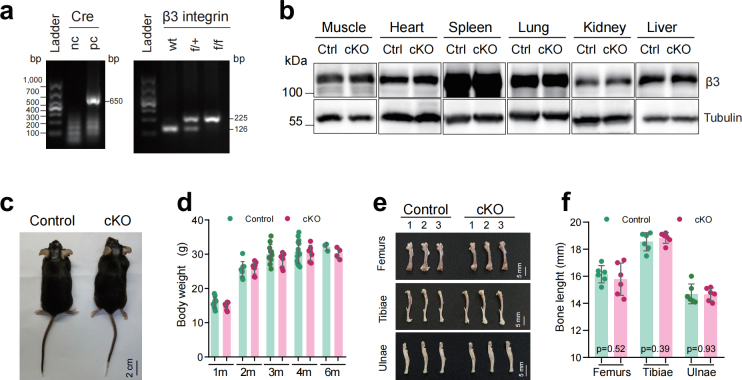
Materials and methods: To study the in vivo role of osteocyte β3 integrin in bone, we utilized the 10-kb Dmp1 (dentin matrix acidic phosphoprotein 1)-Cre to delete β3 integrin expression in osteocyte in mice. Micro-computerized tomography (μCT), bone histomorphometry and in vitro cell culture experiments were performed to determine the effects of osteocyte β3 integrin loss on bone mass accrual and biomechanical properties. In addition, in vivo tibial loading model was applied to study the possible involvement of osteocyte β3 integrin in the mediation of bone mechanotransduction.

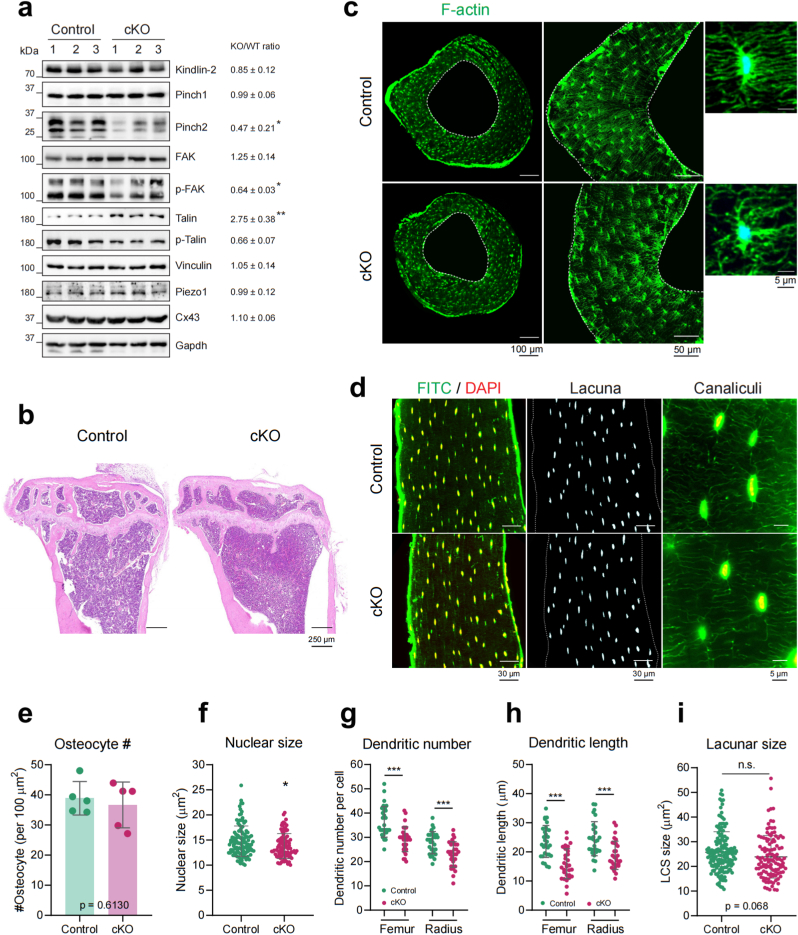
Results: Deletion of β3 integrin in osteocytes resulted in a low bone mass and impaired biomechanical properties in load-bearing long bones in adult mice. The loss of β3 integrin led to abnormal cell morphology with reduced number and length of dentritic processes in osteocytes. Furthermore, osteocyte β3 integrin loss did not impact the osteoclast formation, but significantly reduced the osteoblast-mediated bone formation rate and reduced the osteogenic differentiation of the bone marrow stromal cells in the bone microenvironment. In addition, mechanical loading failed to accelerate the anabolic bone formation in mutant mice.

Conclusions: Our studies demonstrate the essential roles of osteocyte β3 integrin in regulating bone mass and mechanotransduction.

Keywords: Bone homeostasis; Mechanotransduction; Osteocyte; β3 integrin.


Conflict of interest statement

A conflict of interest occurs when an individual's objectivity is potentially compromised by a desire for financial gain, prominence, professional advancement or a successful outcome. The Editors of the Journal of Orthopaedic Translation strive to ensure that what is published in the Journal is as balanced, objective and evidence-based as possible. Since it can be difficult to distinguish between an actual conflict of interest and a perceived conflict of interest, the Journal requires authors to disclose all and any potential conflicts of interest.

Figures

Image 1
Graphical abstract
Fig. 1
Fig. 1
β3 integrin loss in osteocytes results in osteopenia of long bones in adult mice. (a) Immunohistochemistry (IHC) of the tibia cortical bone sections with anti-mouse β3 integrin antibody from control and cKO mice. (bc) Western blotting (WB) and its quantitative results of β3 integrin and β1 integrin expression of femurs and tibiae cortical bone samples from control and cKO mice. n ​= ​3 for each group. Gapdh was used as a loading control. (d) Representative micro-computerized tomography (μCT) images of the mid-shaft cortical bone (Ct.) and distal trabecular bone (Tb.) of femurs from 2-month-old and 6-month-old male control and cKO mice. (eh) Quantitative μCT analyses of the cortical thickness (Ct.Th), trabecular bone mineral density (BMD, g/cm3), bone volume fraction (BV/TV) and trabecular number (Tb.N, 1/mm) of femurs. n ​= ​8 for 2-month groups; n ​= ​6 for 6-month groups. (i) Representative μCT images of the Ct. and Tb. of ulnae from 6-month-old male control and cKO mice. (jl) Quantitative μCT analyses of trabecular BMD, BV/TV, and Tb.N of ulnae. n ​= ​4–5 for each group. (m) Representative μCT images of the skull from 6-month-old male control and cKO mice. (np) Quantitative μCT analyses of BMD, BV/TV, and skull thickness of control and cKO mice. n ​= ​3 for each group. Results are expressed as mean ​± ​standard deviation (s.d.). n. s. P ​> ​0.05; ∗p ​< ​0.05; ∗∗p ​< ​0.01; ∗∗∗p ​< ​0.001.
Fig. 2
Fig. 2
β3 integrin loss in osteocytes impairs mechanical properties of long bones in mice. (a) Representative load–displacement curve of three-point-bending (3 ​PB) test from 4-month-old male control and cKO femurs. (bd) Quantitative analyses of maximum load force, maximum displacement and stiffness in 3 ​PB. n ​= ​13 for Control group; n ​= ​16 for cKO group. (e) Representative load–displacement curve of nano-indentation test from 4-month-old male control and cKO tibiae. (fg) Quantitative analyses of Young's modulus and Hardness in nano-indentation test. n ​= ​5 for each group. (hj) Sirius red/fast green collagen staining and semi-quantitative measurement of the collagen content on the sagittal tibia sections from 6-month-old male control and cKO mice. n ​= ​4 for each group. (kl) Two-photon microscopy images of cortical and trabecular collagen fibers from 6-month-old male control and cKO tibial sections. (m) Quantitative analyses of cortical (Ct.) and trabecular (Tb.) collagen fiber intensity for control and cKO mice. n ​= ​5 for each group. Results are expressed as mean ​± ​standard deviation (s.d.). n. s. P ​> ​0.05; ∗p ​< ​0.05; ∗∗p ​< ​0.01. (For interpretation of the references to colour in this figure legend, the reader is referred to the Web version of this article.)
Fig. 3
Fig. 3
β3 integrin loss influences bone formation in vivo and in vitro. (a) Serum CTX-1 level detection by ELISA in control and cKO mice. n ​= ​3 for each group. (b) TRAP staining in control and cKO tibial sections. (cd) Quantitative measurement of osteoclast surface and osteoclast number from TRAP staining results. n ​= ​5 for each group. (e) Serum P1NP level detection by ELISA in control and cKO mice. n ​= ​3 for each group. (f) Representative in vivo double calcein labeling images for bone formation detection in the trabecular bone of tibia sections of male control and cKO mice. (gi) Quantitative analyses of the MAR, MS/BS and BFR for double calcein labeling results. n ​= ​4 for each group. (jk) Alkaline phosphatase (Alp) activity detection from in vitro BMSC osteogenic differentiation experiments. (l) The transcriptions of osterix/Osx, Alp, Runx2, Collα1, Bsp and osteocalcin/Ocn were detected through quantitative PCR analysis after BMSC osteogenic differentiation. (mn) Oil red O staining results and quantification of in vitro BMSC adipogenic differentiation. (o) The transcriptions of Cebpα, Cebpβ, Adipo, Ap2, Pparγ2, and Pref-1 were detected through quantitative PCR analysis after BMSC adipogenic differentiation. Results were collected from three biological replicates (n ​= ​3) for each group. Results are expressed as mean ​± ​standard deviation (s.d.). n. s. P ​> ​0.05; ∗p ​< ​0.05; ∗∗p ​< ​0.01; ∗∗∗p ​< ​0.001. (For interpretation of the references to colour in this figure legend, the reader is referred to the Web version of this article.)
Fig. 4
Fig. 4
β3 integrin deletion in osteocytes leads to altered FA signaling pathway and abnormal cell morphology. (a) Western blotting analyses of FA signaling pathway proteins in cortical bone samples from control and cKO mice. Gapdh was used as a loading control. n ​= ​3 for each group. (b) Representative H&E staining images of tibiae bone sections of control and cKO mice. (c) Representative images from F-actin cytoskeleton staining of control and cKO radius bones. (d) Representative images from LCS staining of control and cKO femurs. (ei) Quantitative analyses of osteocyte numbers, nuclear size, dendritic number per cell, the longest dendritic length in each cell and the lacunar size between control and cKO bone samples. n ​= ​5 for each group. Results are expressed as mean ​± ​standard deviation (s.d.). n. s. P ​> ​0.05; ∗p ​< ​0.05; ∗∗p ​< ​0.01; ∗∗∗p ​< ​0.001.
Fig. 5
Fig. 5
β3 integrin knockdown reduces cell spreading and attachment ability with decreased FA formation in MLO-Y4 cells. (a) Western blotting analyses of FA signaling pathway proteins in β3 integrin siRNA treatment. Si-NC as negative control; si-Gapdh as positive control; si-β3 was the transient knockdown of β3 integrin in MLO-Y4 cells for 48 ​h. Tubulin was used as a loading control. n ​= ​3 for each group. Snapshots and quantification of si-NC and si-β3 MLO-Y4 cells attached on non-coated culture flask (b,e), collagen-1 (Col1) coated surfaces (c,f), and fibronectin (FN) coated surfaces (d,g) for 30 ​min, 1 ​h, 3 ​h and 6 ​h. n ​= ​3 for each group. (h, i) Cell spreading area measurement and quantification on FN-coated surfaces for 30 ​min, 3 ​h and 6 ​h. n ​= ​3 for each group. (j) Quantification of FA size in 2D at 24 ​h after cell seeding on FN-coated surfaces. (k) SEM images of si-NC and si-β3 MLO-Y4 cells attached on FN-coated surfaces for 24 ​h. (l) Representative IF images of si-NC and si-β3 MLO-Y4 cells with anti-p-FAK and anti-Talin1 antibodies. Results are expressed as mean ​± ​standard deviation (s.d.). n. s. P ​> ​0.05; ∗p ​< ​0.05; ∗∗p ​< ​0.01; ∗∗∗p ​< ​0.001.
Fig. 6
Fig. 6
β3 integrin deletion in osteocytes compromises anabolic bone formation upon mechanical stimulation in mice. (a) Representative 3D μCT images of cortical (Ct.) and trabecular (Tb.) bones of right tibiae of control and cKO mice at day 1 (D1) before loading and day 14 (D14) after loading treatments. (bc) Quantitative results and percentage change (%) of trabecular BMD after loading in control and cKO mice. (de) Quantitative results and percentage change (%) of trabecular BV/TV after loading in control and cKO mice. (fg) Quantitative results and percentage change (%) of cortical thickness after loading in control and cKO mice. n ​= ​6 for control group; n ​= ​7 for cKO group. Results are expressed as mean ​± ​standard deviation (s.d.). n. s. P ​> ​0.05; ∗p ​< ​0.05; ∗∗p ​< ​0.01.
figs1
figs1
figs2
figs2
figs3
figs3
figs4
figs4

Similar articles

Cited by

References

    1. Bonewald L.F. The amazing osteocyte. J Bone Miner Res. 2011;26(2):229–238. - PMC - PubMed
    1. Robling A.G., Bonewald L.F. The osteocyte: new insights. Annu Rev Physiol. 2020;82(1):485–506. - PMC - PubMed
    1. Dallas S.L., Prideaux M., Bonewald L.F. The osteocyte: an endocrine cell … and more. Endocr Rev. 2013;34(5):658–690. - PMC - PubMed
    1. Qin L., Liu W., Cao H., Xiao G. Molecular mechanosensors in osteocytes. Bone Research. 2020;8(1):23. - PMC - PubMed
    1. Li M.C.M., Chow S.K.H., Wong R.M.Y., Qin L., Cheung W.H. The role of osteocytes-specific molecular mechanism in regulation of mechanotransduction – a systematic review. Journal of Orthopaedic Translation. 2021;29:1–9. - PMC - PubMed

LinkOut - more resources