. 2023 Jul 10:18:3781-3800.
doi: 10.2147/IJN.S406649. eCollection 2023.

Gentiopicroside-Loaded Chitosan Nanoparticles Inhibit TNF-α-Induced Proliferation and Inflammatory Response in HaCaT Keratinocytes and Ameliorate Imiquimod-Induced Dermatitis Lesions in Mice

Affiliations

Gentiopicroside-Loaded Chitosan Nanoparticles Inhibit TNF-α-Induced Proliferation and Inflammatory Response in HaCaT Keratinocytes and Ameliorate Imiquimod-Induced Dermatitis Lesions in Mice

Kaixuan Zhao et al. Int J Nanomedicine. .

Abstract

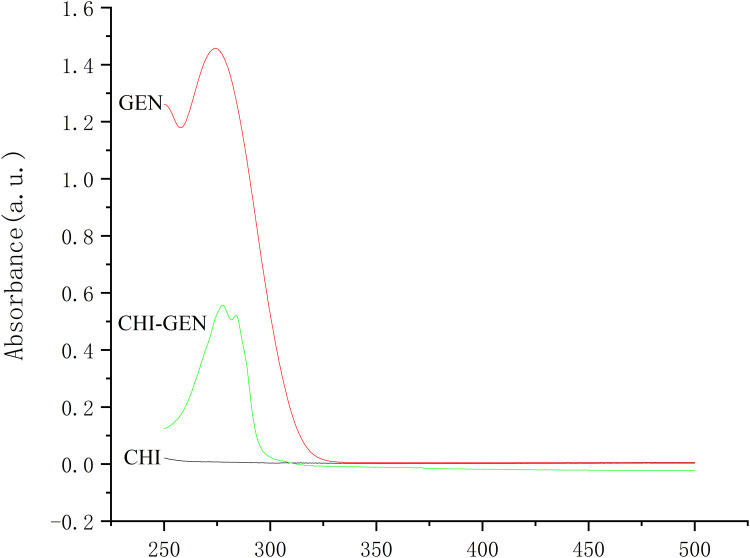
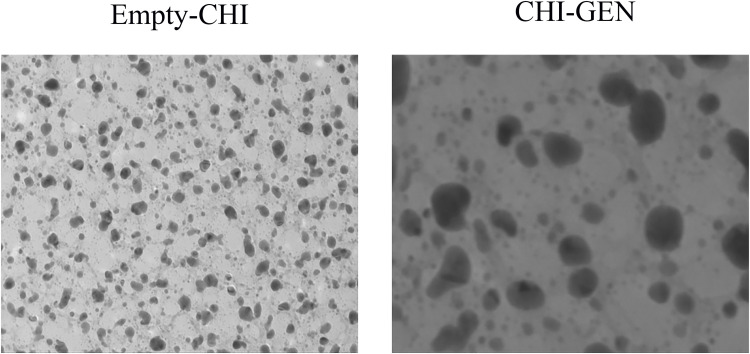
Purpose: In this study, we aimed to report the biological characteristics of the first successful synthesis of gentiopicroside-loaded chitosan nanoparticles and to evaluate the therapeutic effects and preliminary mechanisms of gentiopicrin-loaded chitosan on psoriasis-like cell and mouse models.

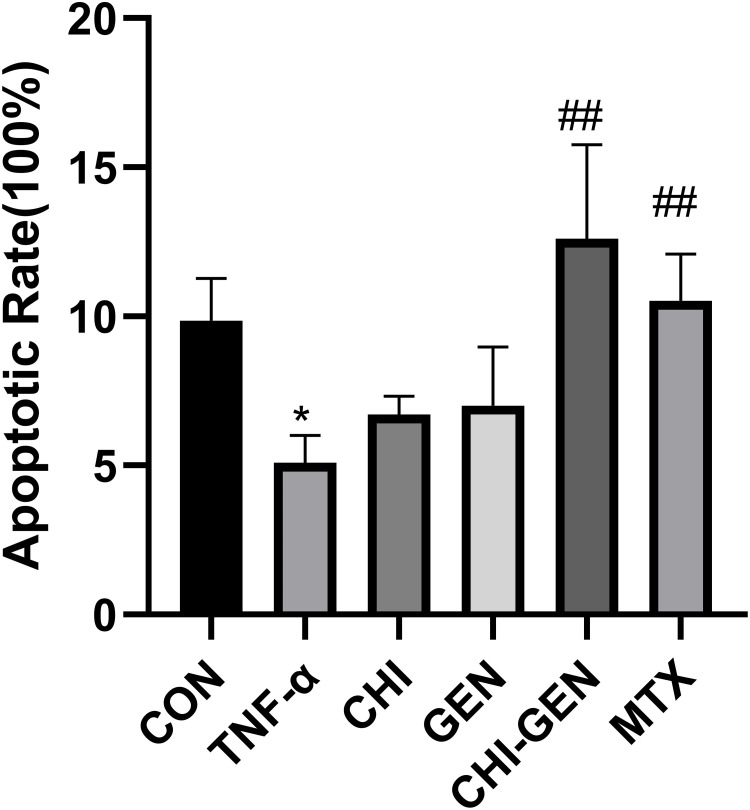
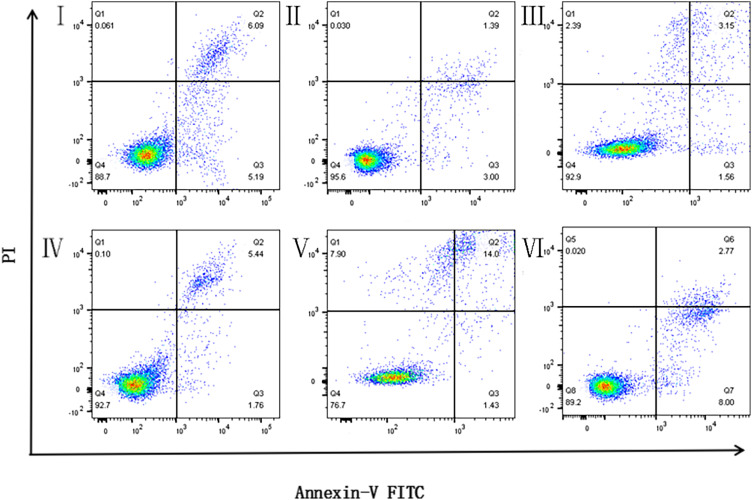
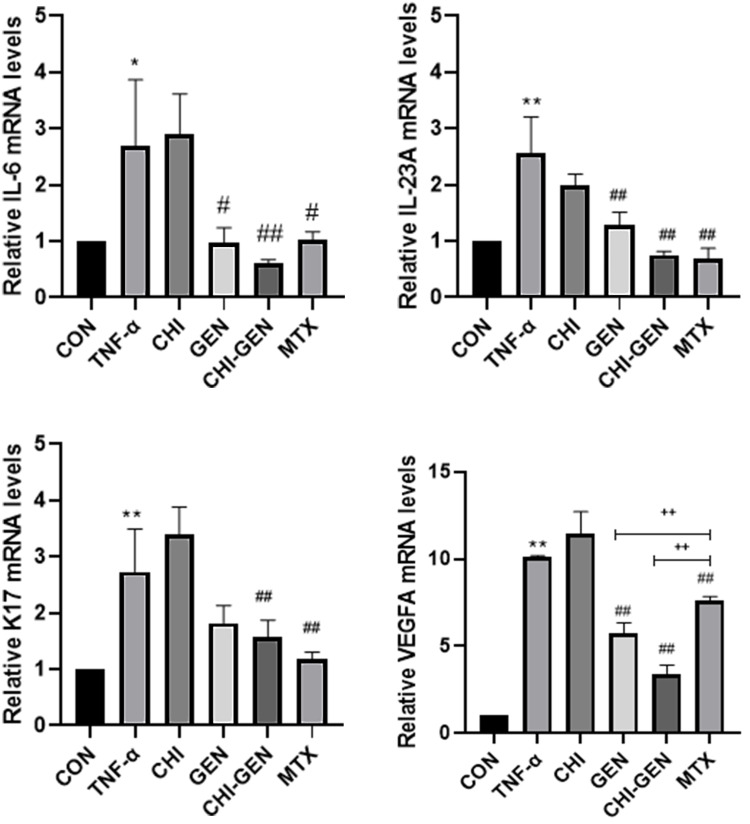
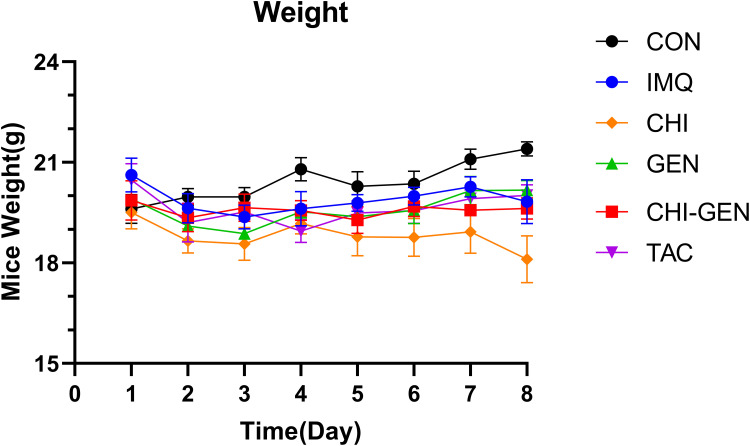
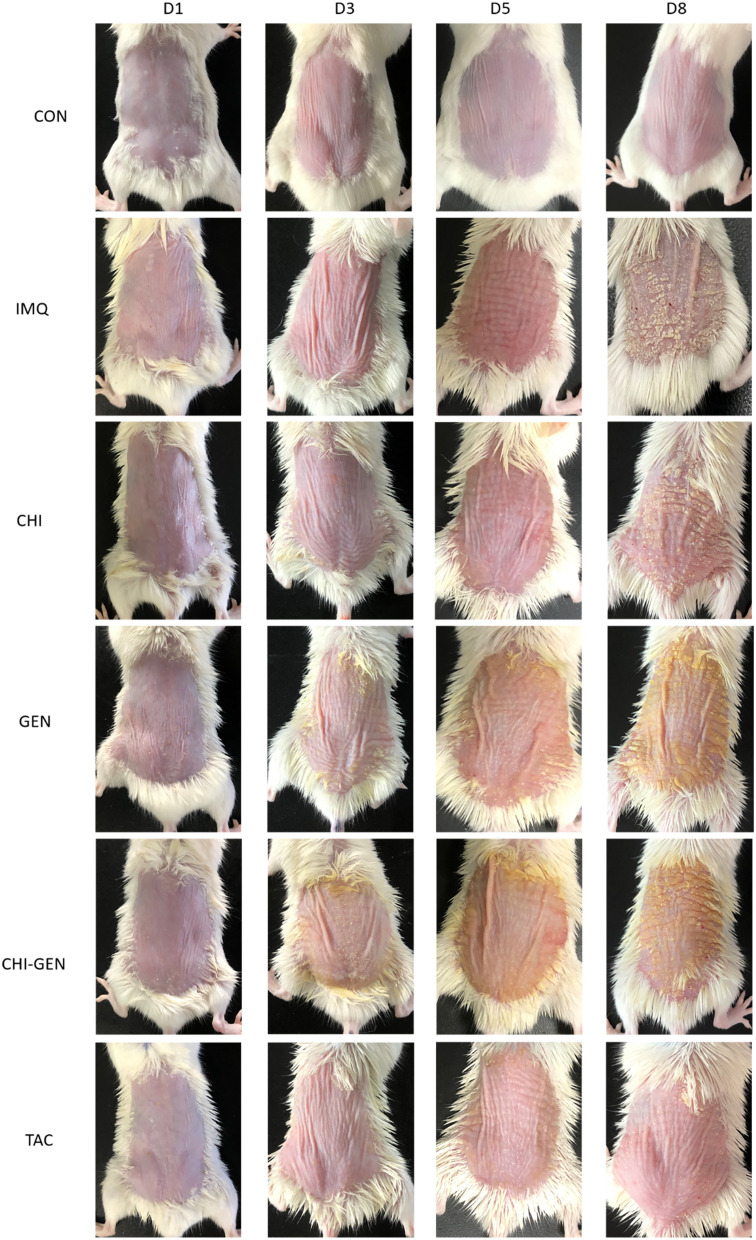
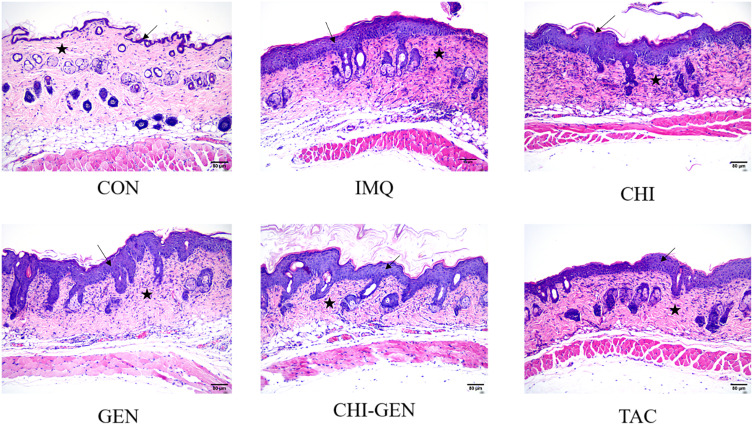
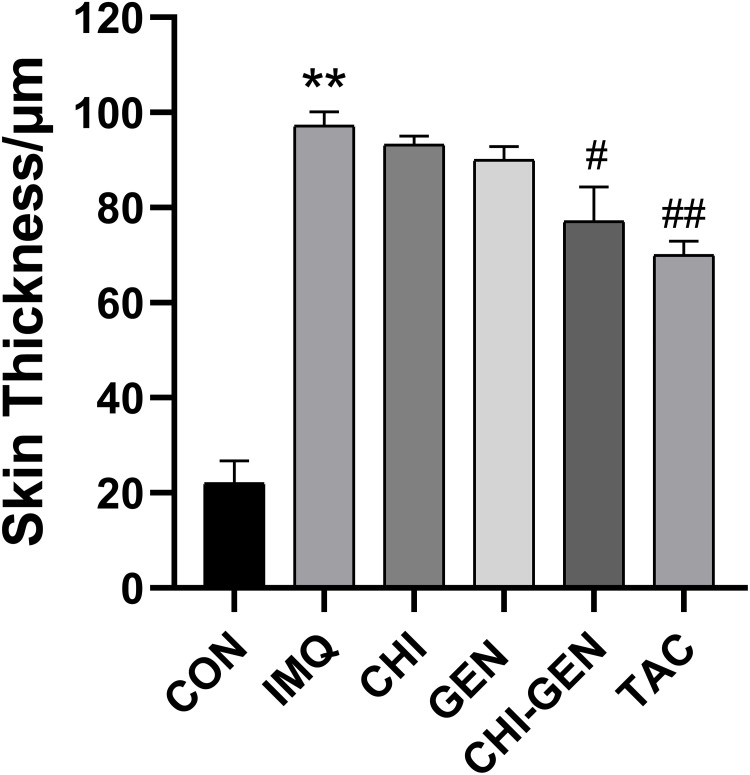
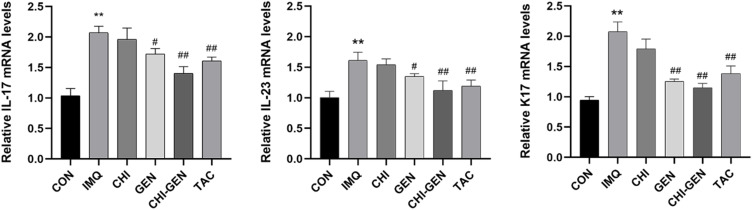
Methods: Gentiopicroside-loaded chitosan nanoparticles (CHI-GEN) were prepared, and their biological characteristics were evaluated. HaCaT keratinocytes were stimulated with TNF-α to establish a psoriatic keratinocyte model. MTT assay and flow cytometry were used to measure cell viability and apoptosis, respectively. mRNA levels of K17, VEGF A, and IL-6 and IL-23A were detected using qRT-PCR. These tests were used to preliminarily assess the effects of CHI-GEN on keratinocyte proliferation and inflammation. Imiquimod was used to construct a psoriasis-like mice model. The severity of psoriasis was scored based on the psoriasis area severity index (PASI), H&E staining was used to observe the histological changes and the level of inflammation and cell proliferation of skin lesions was evaluated by measuring the mRNA levels of K17, IL-23A, and IL-17A using qRT-PCR.

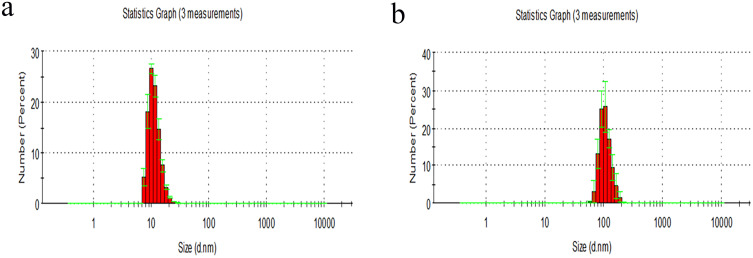
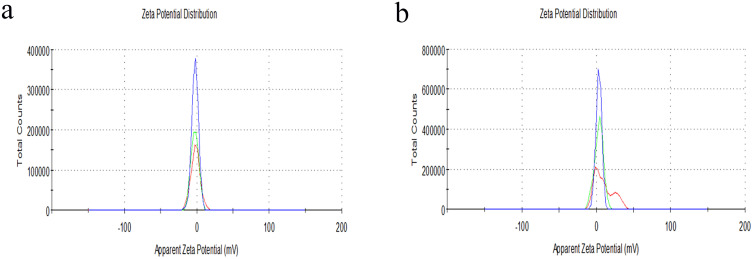
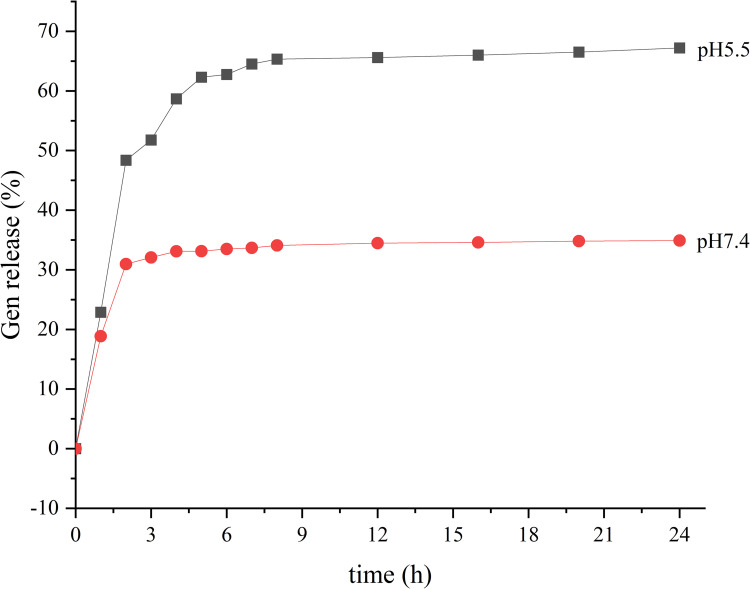
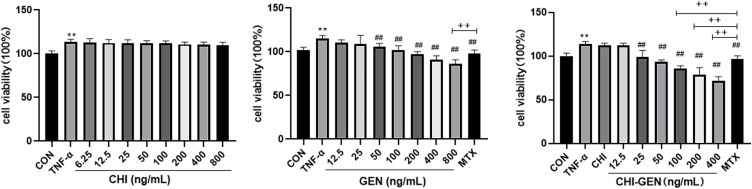
Results: The average particle size of CHI-GEN nanoparticles was approximately 100 nm, and the zeta potential was 2.69 ± 0.87 mV. The cumulative release was 67.2% in solutions of pH 5.5 at 24 h. GEN reduced TNF-α-induced excessive proliferation of HaCaT keratinocytes and downregulated mRNA levels of K17, VEGF A, and inflammatory cytokines IL-6 and IL-23A, which was more obvious in the CHI-GEN treatment group. Additionally, CHI-GEN significantly improved the severity of skin lesions in psoriasis-like mice and downregulated the mRNA expressions of IL-6, IL-23A, and IL-17A in mice skin lesions.

Conclusion: In conclusion, we successfully prepared gentiopicrin-chitosan nanoparticles. Our results show that these nanoparticles have anti-psoriasis activity, inhibits keratinocyte proliferation and improves symptoms in psoriasis model mice and can be used to develop an effective strategy for the treatment of psoriasis.

Keywords: chitosan; chitosan-loaded nano cream for external use; gentiopicroside; nanoparticles; proliferation and inflammation; psoriasis.


Conflict of interest statement

The authors report no conflicts of interest in this work.

Figures

Figure 1
Figure 1
CHI-GEN synthesis diagram.
Figure 2
Figure 2
UV absorption of GEN, CHI, and CHI-GEN.
Figure 3
Figure 3
Micrographs of non-loaded CHI and CHI-GEN taken by TEM with scale bar = 100nm.
Figure 4
Figure 4
Hydration particle sizes of non-loaded CHI and CHI-GEN detected using DLS. (a) non-loaded CHI particle size and (b) CHI-GEN particle size.
Figure 5
Figure 5
Zeta potential of GEN and CHI-GEN detected using DLS. (a) GEN Zeta potential (−2.31 ± 0.41 mV); (b) potential after CHI was coated with GEN (2.69 ± 0.87mV).
Figure 6
Figure 6
GEN release in vitro at different pH.
Figure 7
Figure 7
Co-localization of FITC-CHI particles and lysosomes Laser scanning confocal micrograph (100 ×) Scale bar =10 μM.
Figure 8
Figure 8
Uptake of CHI-GEN nanoparticles by HaCaT cells Laser scanning confocal microscope (10 ×) Scale bar = 50 μM.
Figure 9
Figure 9
The effects of different drugs (CHI, GEN, CHI-GEN) on TNF-α -induced HaCaT cell viability expressed as mean ± SD, n = 6, and the differences were evaluated using ANOVA. Compared with control group,**p < 0.01; Compared with TNF-α treated model group, ##p < 0.01; Compared with MTX treated control group,++p < 0.01.
Figure 10
Figure 10
Effects of GEN and CHI-GEN on TNF-α-induced apoptosis of HaCaT cells. Data are expressed as mean ± SD, n = 3, and the differences were evaluated using ANOVA. Compared with control group, *p<0.05; compared with TNF-α treated model group, ##p<0.01; compared with MTX treated control group.
Figure 11
Figure 11
Effect of CHI-GEN on TNF-α -induced apoptosis of HaCaT cells was detected using flow cytometry. I: Control Group; II: Model Group TNF- α (10 ng/mL); III:TNF- α (10 ng/mL) + GEN (200 ng/mL); IV: TNF- α (10 ng/mL) + CHI (50 ng/mL); V: TNF- α (10 ng/mL) + CHI-GEN (50 ng/mL); VI: TNF- α (10 ng/mL) + MTX (5 mg/L).
Figure 12
Figure 12
Effect of different drugs on relative mRNA expression level of HaCaT cells. Data are expressed as mean ± SD, n = 3, and the differences were evaluated using ANOVA. Compared with control group, *p<0.05, **p<0.01; compared with TNF-α treated model group, #p<0.05, ##p<0.01; compared with MTX treated control group,++p<0.01.
Figure 13
Figure 13
Body weight of mice in each group was continuously monitored from day 1 to 8.
Figure 14
Figure 14
Effect of CHI-GEN on imQ-induced psoriasis-like lesions in mice. The macroscopic appearance of mouse back skin on days 1, 3, 5 and 8.
Figure 15
Figure 15
Skin changes on the back of mice were scored according to PASI at days 1–8, including (a) total PASI score, (b) erythema, (c) induration, and (d) scaling.
Figure 16
Figure 16
Histopathological observation of H&E staining of mice dorsal skin showing changes in epidermal thickness and morphology. Black arrows: epidermal layer, stars: dermal layer (× 400).
Figure 17
Figure 17
Back skin thickness of mice. The skin thickness was calculated using Image-Pro Plus 6.0, data are presented as mean ± SD (n = 3), and the differences were evaluated using ANOVA. Compared with CON group, **p < 0.01; Compared with IMQ group, #p < 0.05, ##p < 0.01.
Figure 18
Figure 18
The relative mRNA expression of related cytokines (IL-17A, IL-22, and IL-23) in IMQ-induced psoriatic skin of mice. Data are presented as mean ± SD, n = 3, and differences were assessed using ANOVA. Compared with CON group, ** p<0.01; Compared with IMQ group, #p<0.05, ## p<0.01.

Similar articles

Cited by

References

    1. Griffiths CE, Armstrong AW, Gudjonsson JE, Barker JN. Psoriasis. Lancet. 2021;397(10281):1301–1315. doi:10.1016/S0140-6736(20)32549-6 - DOI - PubMed
    1. Armstrong AW, Read C. Pathophysiology, Clinical presentation, and treatment of psoriasis: a review. JAMA. 2020;323(19):1945–1960. doi:10.1001/jama.2020.4006 - DOI - PubMed
    1. Takeshita J, Grewal S, Langan SM, et al. Psoriasis and comorbid diseases: epidemiology. J Am Acad Dermatol. 2017;76(3):377–390. doi:10.1016/j.jaad.2016.07.064 - DOI - PMC - PubMed
    1. Alqassimi S, Albrashdi S, Galadari H, Hashim MJ. Global burden of psoriasis – comparison of regional and global epidemiology, 1990 to 2017. Int J Dermatol. 2020;59(5):566–571. doi:10.1111/ijd.14864 - DOI - PubMed
    1. Garzorz-Stark N, Eyerich K. Psoriasis Pathogenesis: keratinocytes Are Back intheSpotlight. J Invest Dermatol. 2019;139(5):995–996. doi:10.1016/j.jid.2019.01.026 - DOI - PubMed

MeSH terms