

Prospects for meteotsunami detection in earth's atmosphere using GNSS observations
- PMID: 37457809
- PMCID: PMC10338587
- DOI: 10.1007/s10291-023-01492-8
Prospects for meteotsunami detection in earth's atmosphere using GNSS observations
Abstract
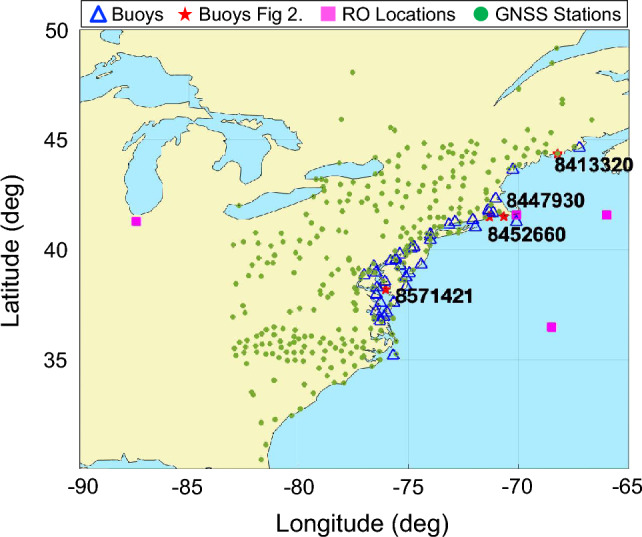
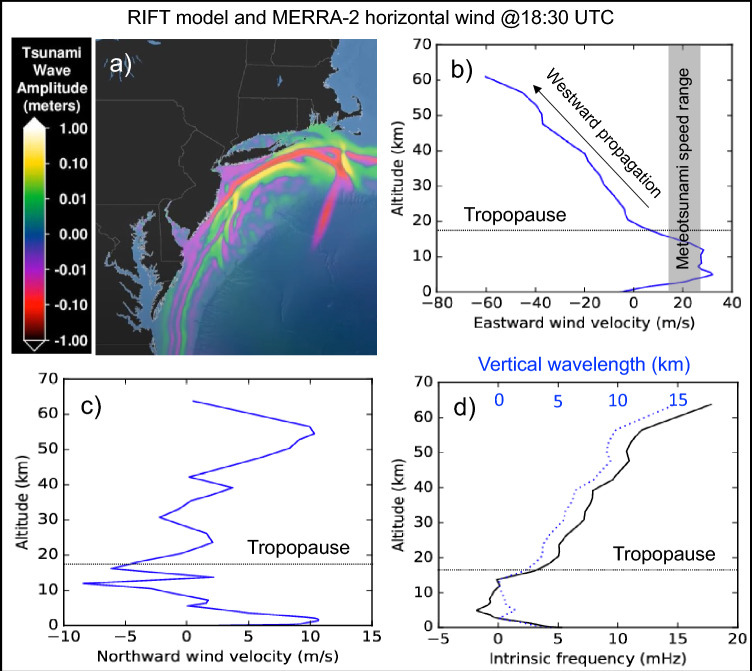
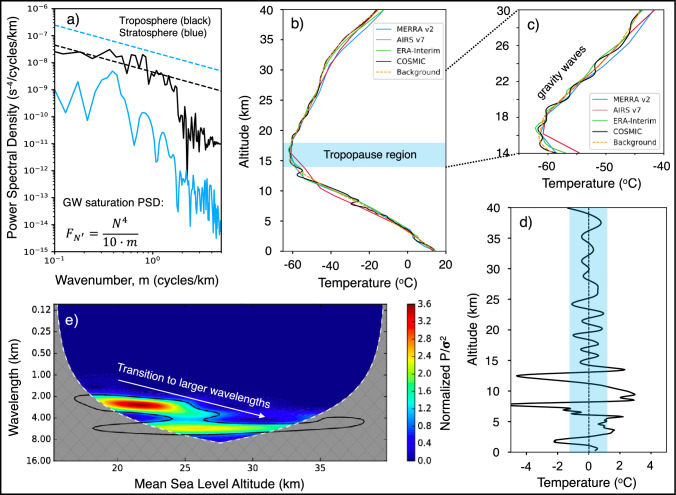
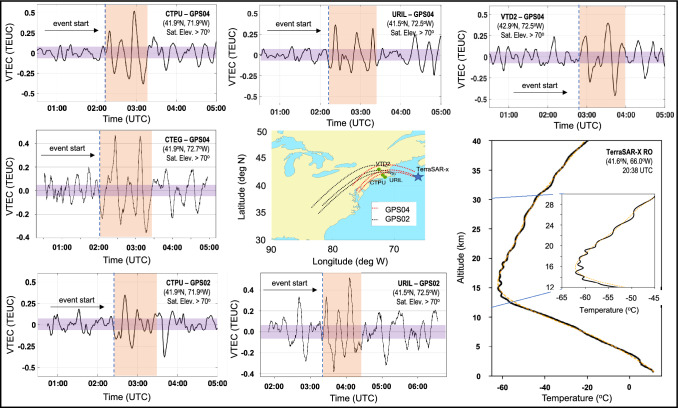
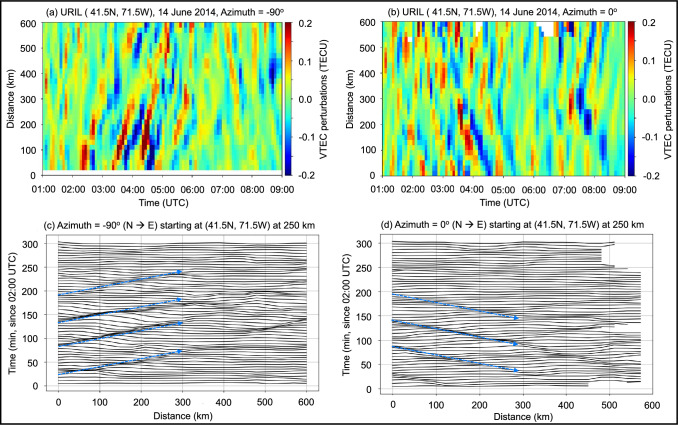
We study, for the first time, the physical coupling and detectability of meteotsunamis in the earth's atmosphere. We study the June 13, 2013 event off the US East Coast using Global Navigation Satellite System (GNSS) radio occultation (RO) measurements, Sounding of the Atmosphere using Broadband Emission Radiometry (SABER) temperatures, and ground-based GNSS ionospheric total electron content (TEC) observations. Hypothesizing that meteotsunamis also generate gravity waves (GWs), similar to tsunamigenic earthquakes, we use linear GW theory to trace their dynamic coupling in the atmosphere by comparing theory with observations. We find that RO data exhibit distinct stratospheric GW activity at near-field that is captured by SABER data in the mesosphere with increased vertical wavelength. Ground-based GNSS-TEC data also detect a far-field ionospheric response 9 h later, as expected by GW theory. We conclude that RO measurements could increase understanding of meteotsunamis and how they couple with the earth's atmosphere, augmenting ground-based GNSS TEC observations.
Keywords: Atmosphere; GNSS; Meteotsunami; Radio occultations; Total electron content.
© The Author(s) 2023.
Conflict of interest statement
Conflict of interestThe authors declare no competing interests.
Figures


Similar articles
-
Space Weather Observations by GNSS Radio Occultation: From FORMOSAT-3/COSMIC to FORMOSAT-7/COSMIC-2.Space Weather. 2014 Nov;12(11):616-621. doi: 10.1002/2014SW001133. Epub 2014 Nov 6. Space Weather. 2014. PMID: 26213514 Free PMC article.
-
Derivation of global ionospheric Sporadic E critical frequency (f o Es) data from the amplitude variations in GPS/GNSS radio occultations.R Soc Open Sci. 2020 Jul 22;7(7):200320. doi: 10.1098/rsos.200320. eCollection 2020 Jul. R Soc Open Sci. 2020. PMID: 32874629 Free PMC article.
-
Probability of intense precipitation from polarimetric GNSS radio occultation observations.Q J R Meteorol Soc. 2018 Nov;144(Suppl Suppl 1):206-220. doi: 10.1002/qj.3161. Epub 2017 Nov 19. Q J R Meteorol Soc. 2018. PMID: 31007290 Free PMC article.
-
Characteristics of atmospheric gravity waves observed using the MU (Middle and Upper atmosphere) radar and GPS (Global Positioning System) radio occultation.Proc Jpn Acad Ser B Phys Biol Sci. 2014;90(1):12-27. doi: 10.2183/pjab.90.12. Proc Jpn Acad Ser B Phys Biol Sci. 2014. PMID: 24492645 Free PMC article. Review.
-
A Review of GNSS/GPS in Hydrogeodesy: Hydrologic Loading Applications and Their Implications for Water Resource Research.Water Resour Res. 2022 Jul;58(7):e2022WR032078. doi: 10.1029/2022WR032078. Epub 2022 Jul 8. Water Resour Res. 2022. PMID: 36247691 Free PMC article. Review.
References
-
- Anderson EJ, Bechle AJ, Wu CH, Schwab DJ, Mann GE, Lombardy KA. Reconstruction of a meteotsunami in lake Erie on 27 May 2012: roles of atmospheric conditions on hydrodynamic response in enclosed basins. J Geophys Res Oceans. 2015 doi: 10.1002/2015JC010883. - DOI
-
- Anthes RA, et al. The COSMIC/FORMOSAT-3 mission: early results. Bull Amer Meteor Soc. 2008 doi: 10.1175/BAMS-89-3-313. - DOI
-
- Astafyeva E. Ionospheric detection of natural hazards. Rev Geophys. 2019 doi: 10.1029/2019RG000668. - DOI
-
- Belušić D, Grisogono B, Klaić ZB. Atmospheric origin of the devastating coupled air-sea event in the East Adriatic. J Geophys Res. 2007 doi: 10.1029/2006JD008204. - DOI
LinkOut - more resources
Full Text Sources
Research Materials