

Inferring human neutral genetic variation from craniodental phenotypes
- PMID: 37457893
- PMCID: PMC10338903
- DOI: 10.1093/pnasnexus/pgad217
Inferring human neutral genetic variation from craniodental phenotypes
Abstract
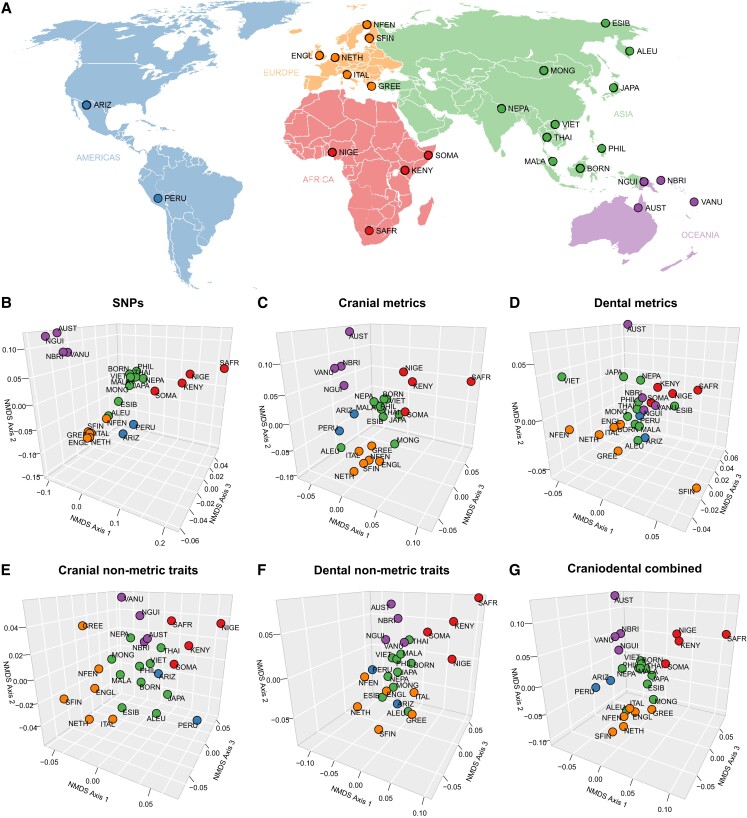
There is a growing consensus that global patterns of modern human cranial and dental variation are shaped largely by neutral evolutionary processes, suggesting that craniodental features can be used as reliable proxies for inferring population structure and history in bioarchaeological, forensic, and paleoanthropological contexts. However, there is disagreement on whether certain types of data preserve a neutral signature to a greater degree than others. Here, we address this unresolved question and systematically test the relative neutrality of four standard metric and nonmetric craniodental data types employing an extensive computational genotype-phenotype comparison across modern populations from around the world. Our computation draws on the largest existing data sets currently available, while accounting for geographically structured environmental variation, population sampling uncertainty, disparate numbers of phenotypic variables, and stochastic variation inherent to a neutral model of evolution. Our results reveal that the four data types differentially capture neutral genomic variation, with highest signals preserved in dental nonmetric and cranial metric data, followed by cranial nonmetric and dental metric data. Importantly, we demonstrate that combining all four data types together maximizes the neutral genetic signal compared with using them separately, even with a limited number of phenotypic variables. We hypothesize that this reflects a lower level of genetic integration through pleiotropy between, compared to within, the four data types, effectively forming four different modules associated with relatively independent sets of loci. Therefore, we recommend that future craniodental investigations adopt holistic combined data approaches, allowing for more robust inferences about underlying neutral genetic variation.
Keywords: cranium; dentition; genetic variation; neutral evolution.
© The Author(s) 2023. Published by Oxford University Press on behalf of National Academy of Sciences.
Figures

References
-
- von Cramon-Taubadel N. 2014. Evolutionary insights into global patterns of human cranial diversity: population history, climatic and dietary effects. J Anthropol Sci. 92:43–77. - PubMed
-
- Weaver TD. 2018. Neutral theory and the evolution of human physical form: an introduction to models and applications. J Anthropol Sci. 96:7–26. - PubMed
-
- Schroeder L, Ackermann RR. 2023. Moving beyond the adaptationist paradigm for human evolution, and why it matters. J Hum Evol. 174:103296. - PubMed
-
- Betti L, von Cramon-Taubadel N, Lycett SJ. 2012. Human pelvis and long bones reveal differential preservation of ancient population history and migration out of Africa. Hum Biol. 84:139–152. - PubMed
LinkOut - more resources
Full Text Sources
