. 2023 Sep 1;55(9):392-413.
doi: 10.1152/physiolgenomics.00128.2022. Epub 2023 Jul 17.

Gene coexpression network analysis reveals perirenal adipose tissue as an important target of prenatal malnutrition in sheep

Affiliations

Gene coexpression network analysis reveals perirenal adipose tissue as an important target of prenatal malnutrition in sheep

Sharmila Ahmad et al. Physiol Genomics. .

Abstract

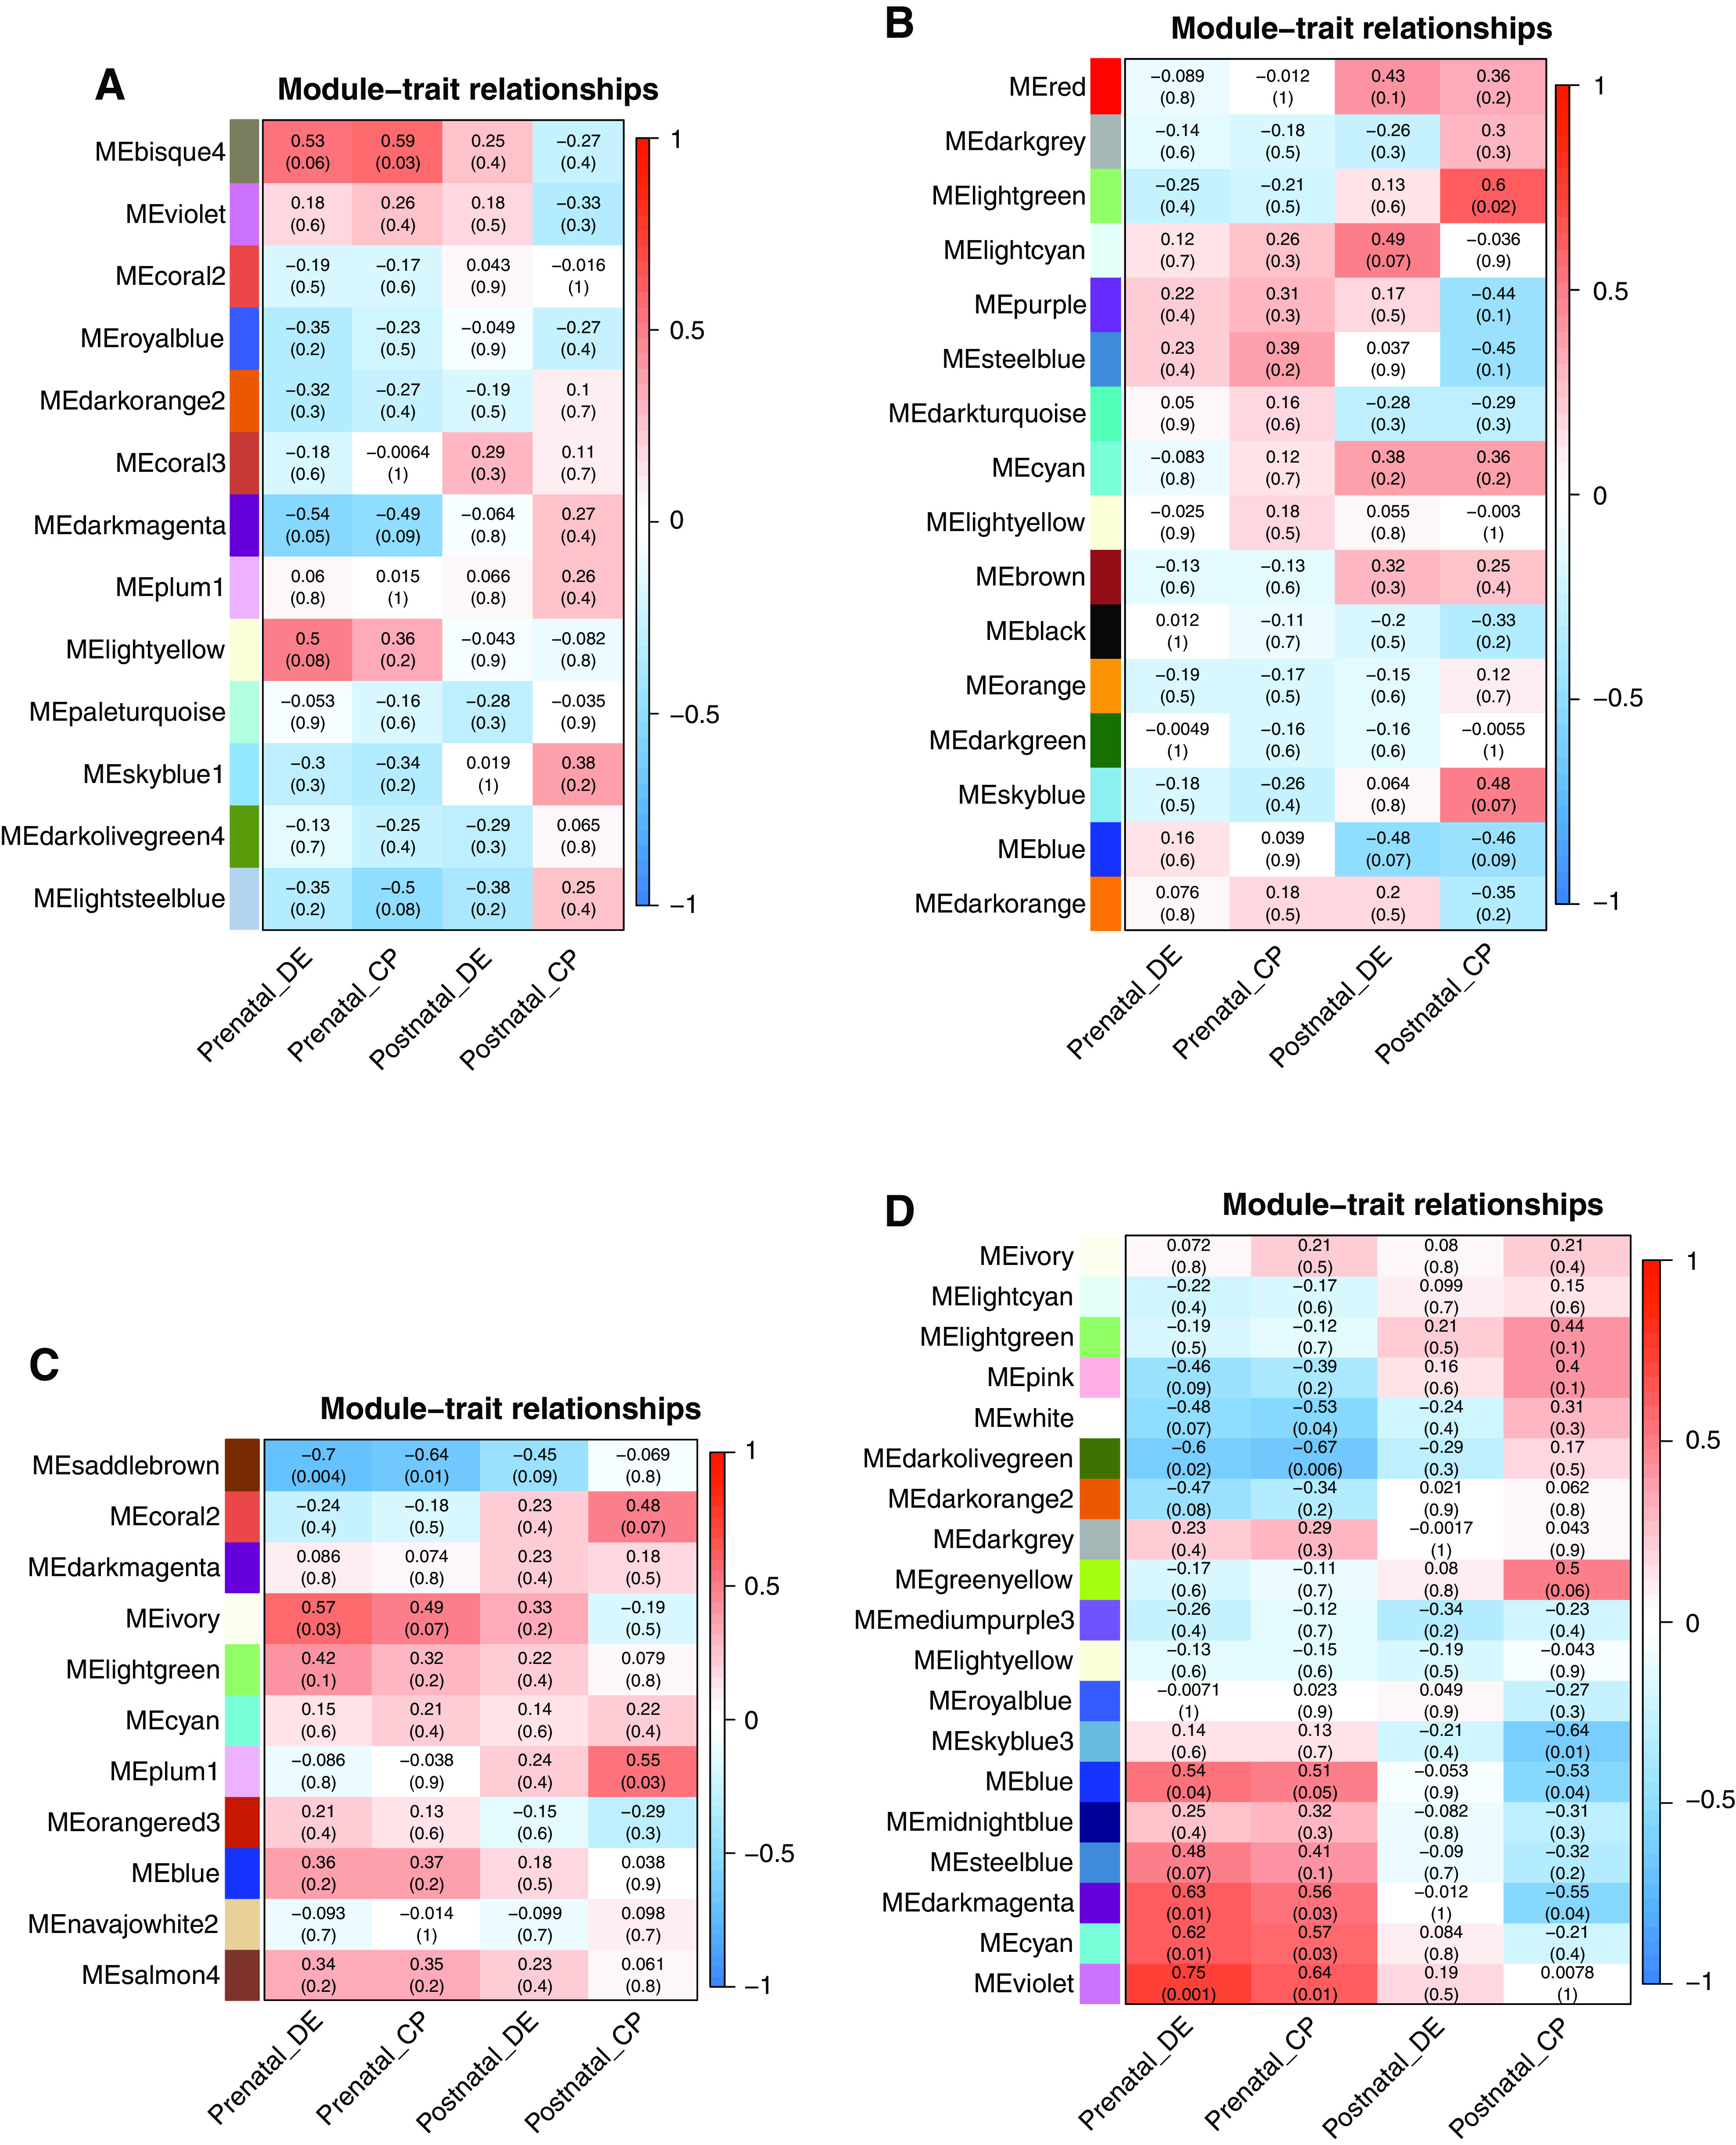
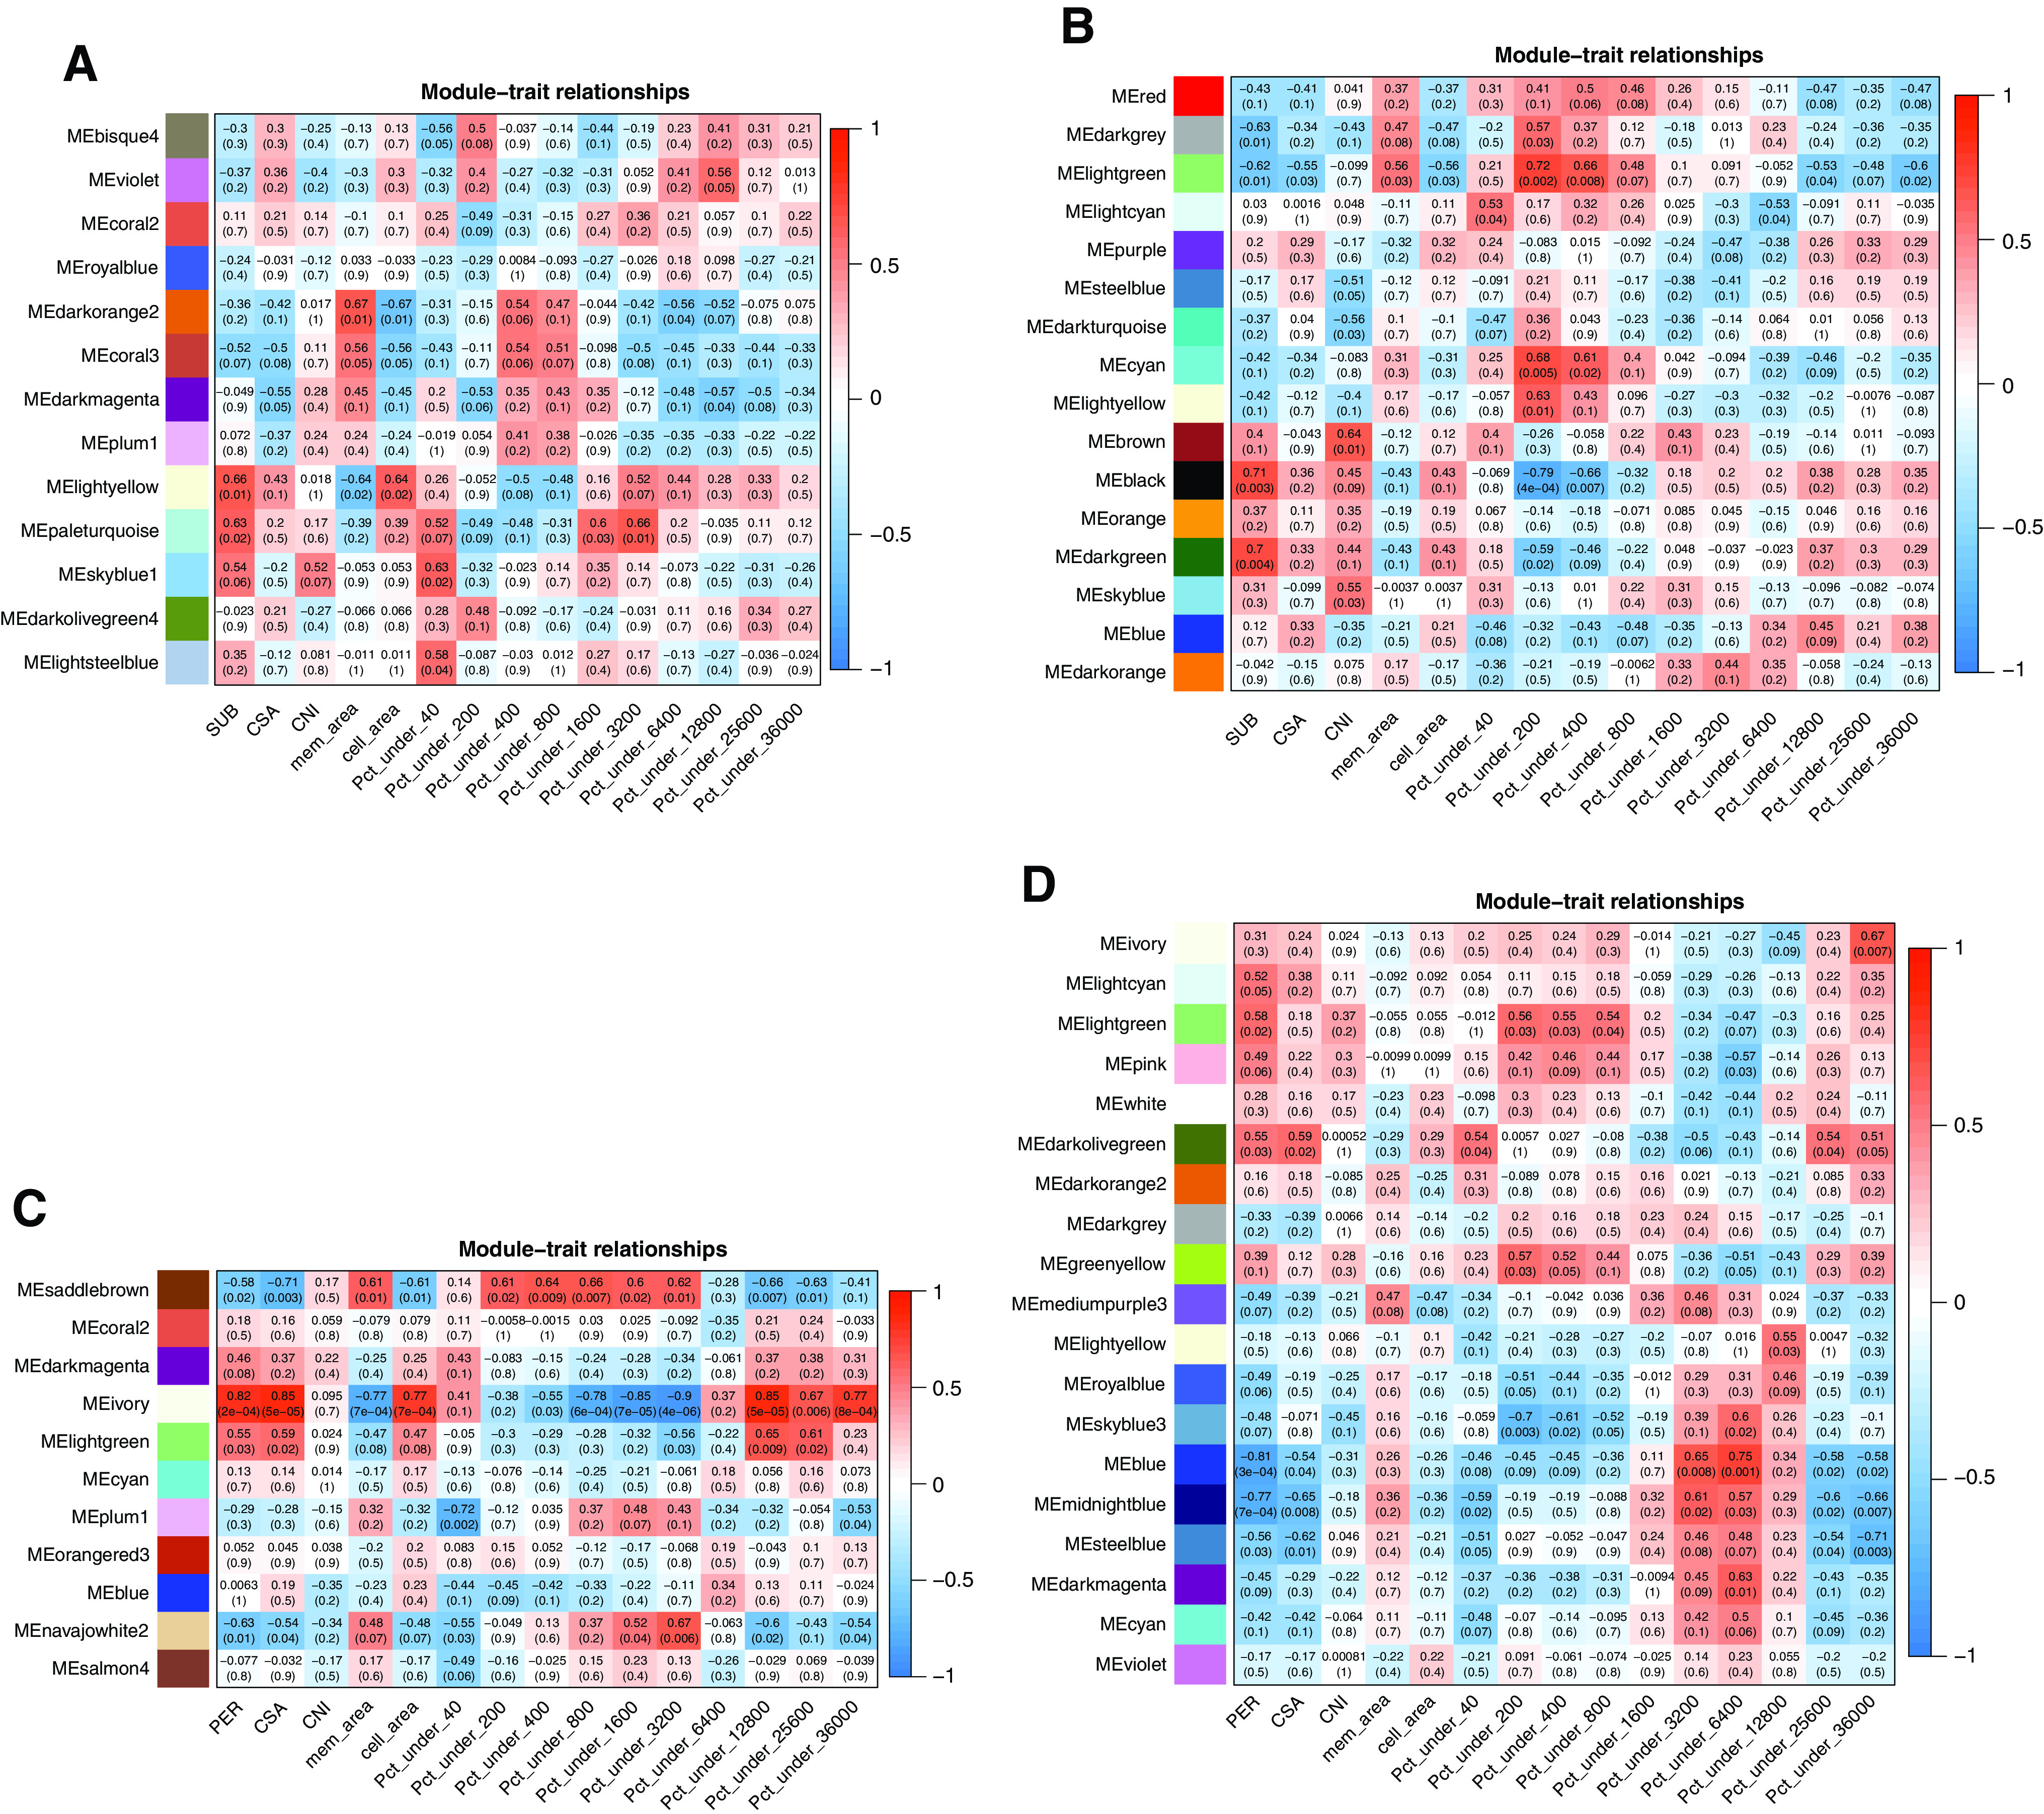
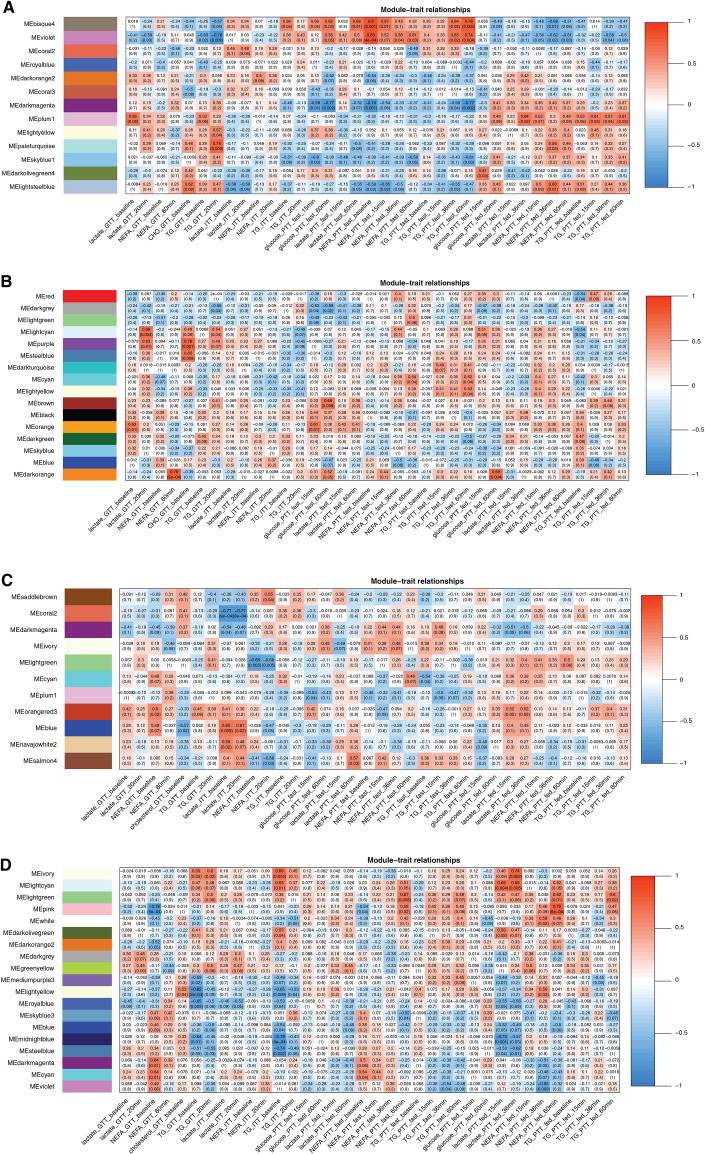
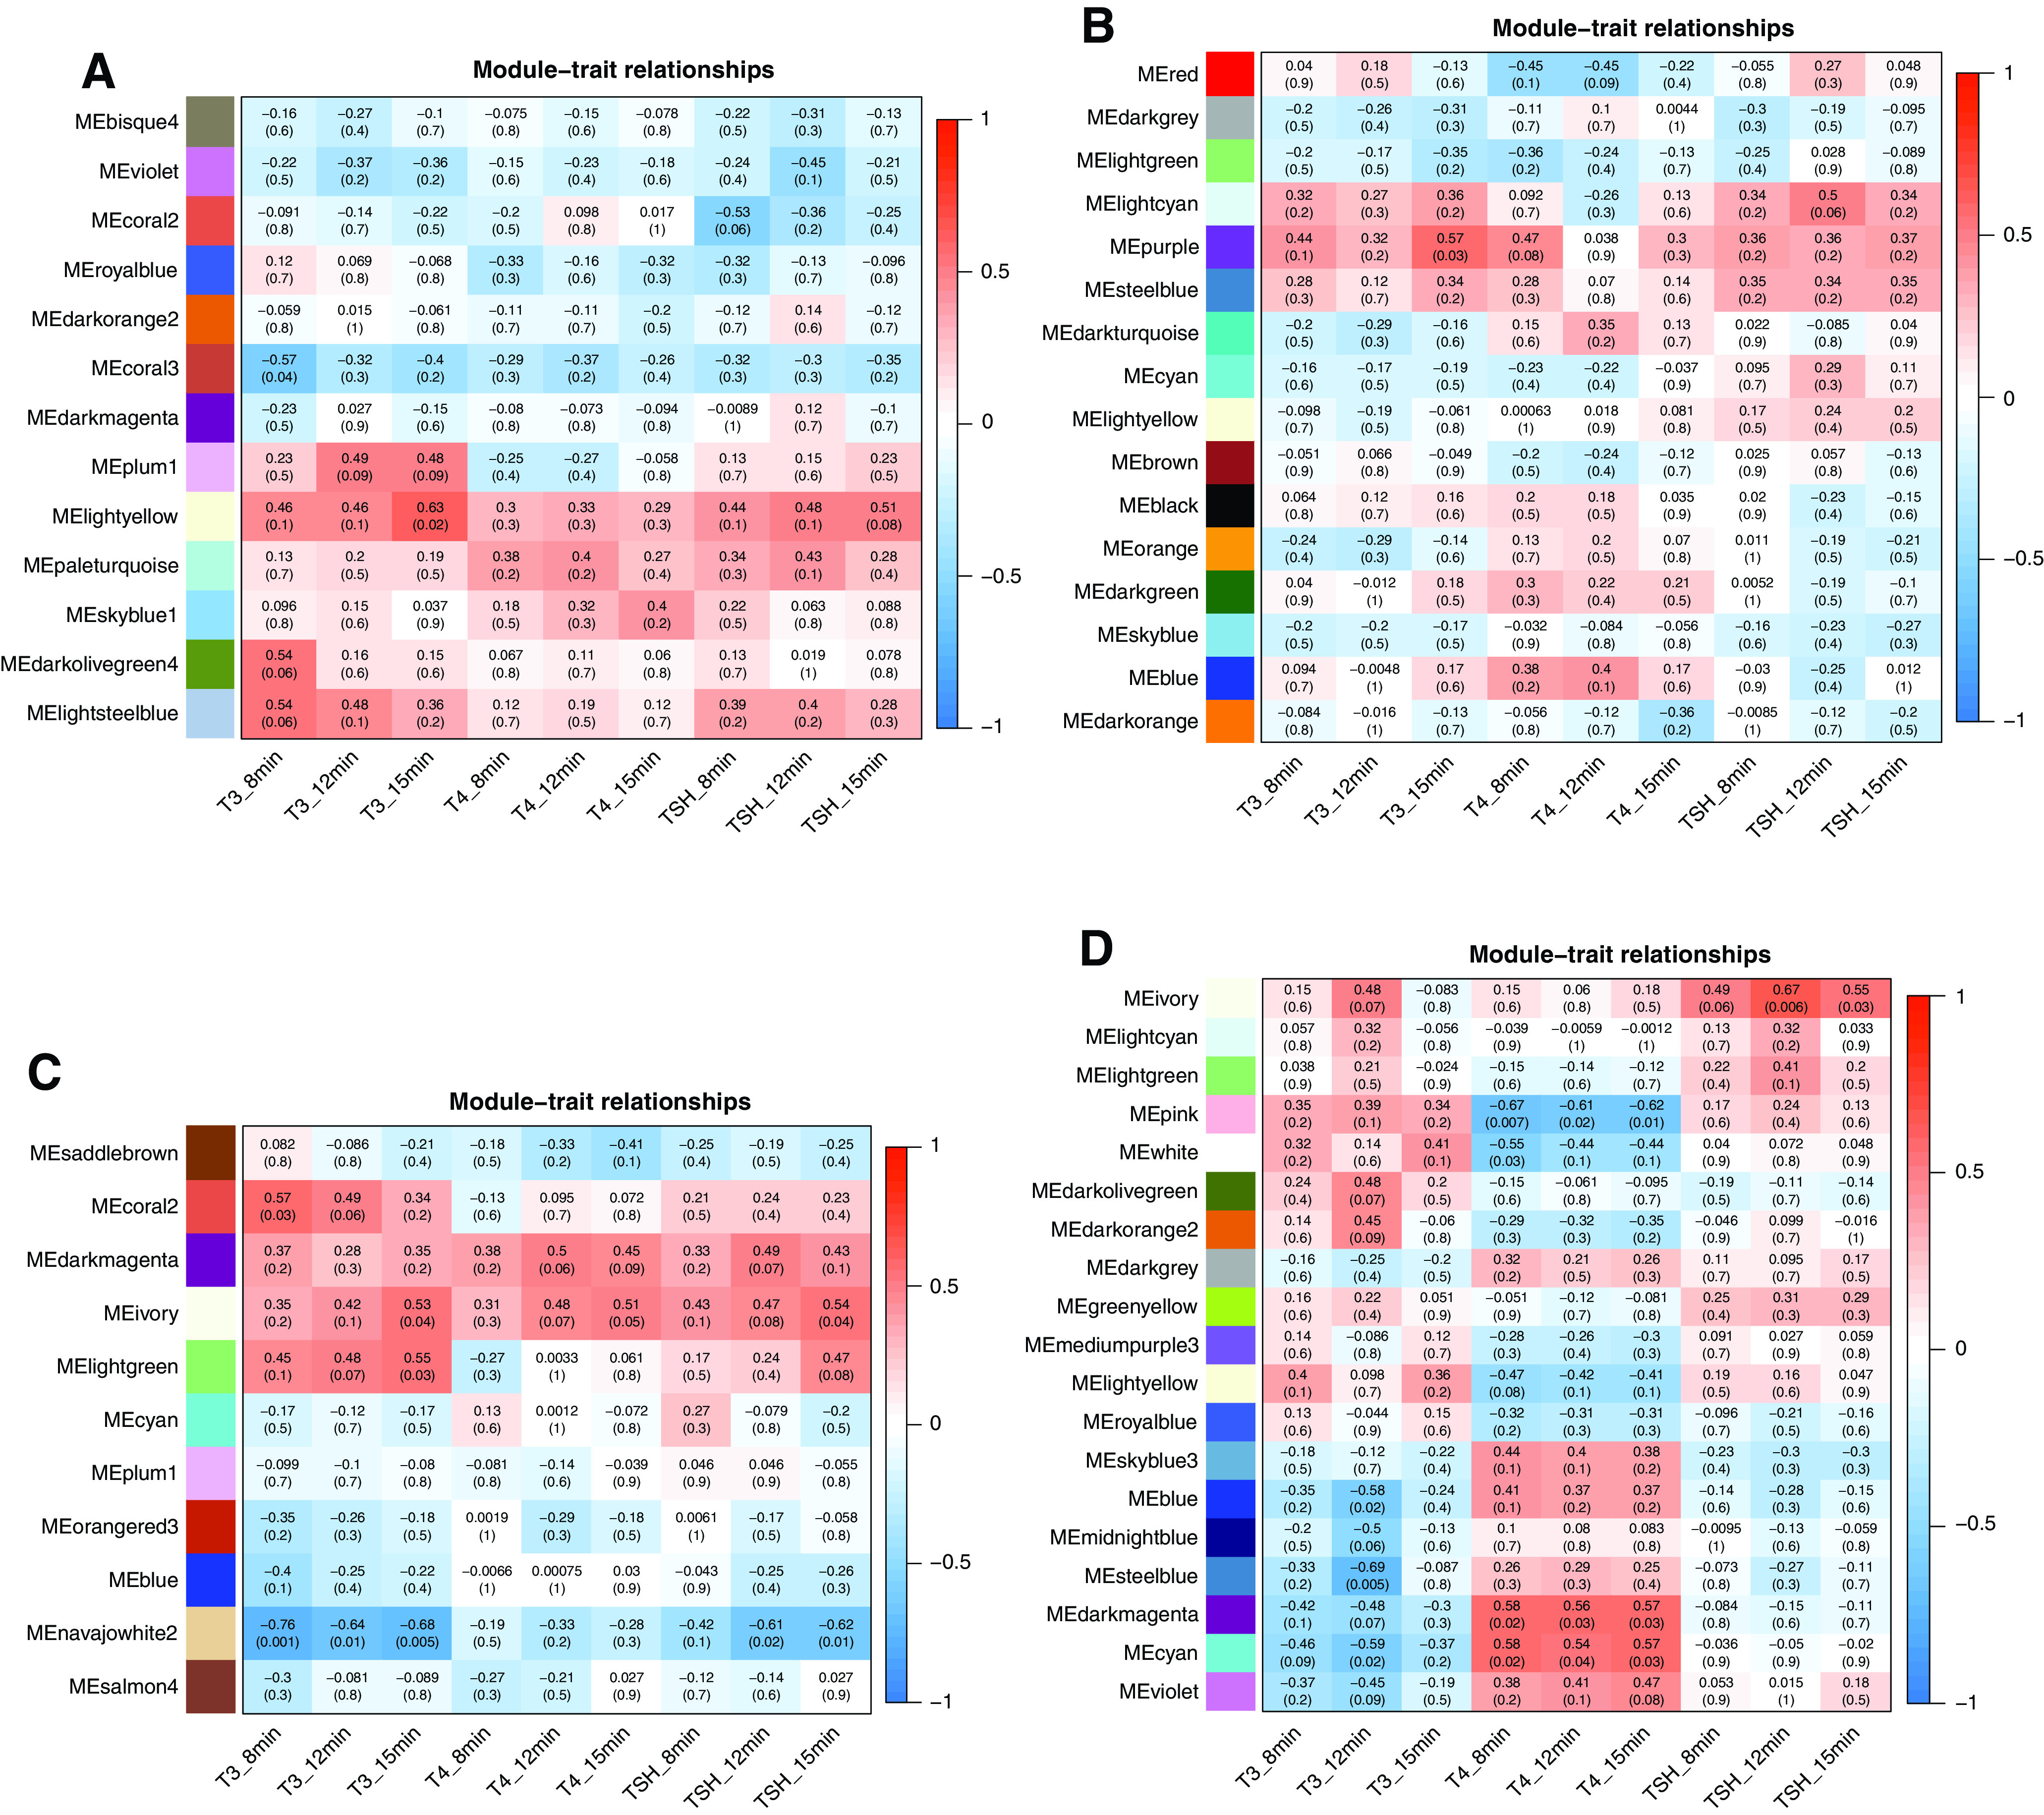
We have previously demonstrated that pre- and early postnatal malnutrition in sheep induced depot- and sex-specific changes in adipose morphological features, metabolic outcomes, and transcriptome in adulthood, with perirenal (PER) as the major target followed by subcutaneous (SUB) adipose tissue. We aimed to identify coexpressed and hub genes in SUB and PER to identify the underlying molecular mechanisms contributing to the early nutritional programming of adipose-related phenotypic outcomes. Transcriptomes of SUB and PER of male and female adult sheep with different pre- and early postnatal nutrition histories were used to construct networks of coexpressed genes likely to be functionally associated with pre- and early postnatal nutrition histories and phenotypic traits using weighted gene coexpression network analysis. The modules from PER showed enrichment of cell cycle regulation, gene expression, transmembrane transport, and metabolic processes associated with both sexes' prenatal nutrition. In SUB (only males), a module of enriched adenosine diphosphate metabolism and development correlated with prenatal nutrition. Sex-specific module enrichments were found in PER, such as chromatin modification in the male network but histone modification and mitochondria- and oxidative phosphorylation-related functions in the female network. These sex-specific modules correlated with prenatal nutrition and adipocyte size distribution patterns. Our results point to PER as a primary target of prenatal malnutrition compared to SUB, which played only a minor role. The prenatal programming of gene expression and cell cycle, potentially through epigenetic modifications, might be underlying mechanisms responsible for observed changes in PER expandability and adipocyte-size distribution patterns in adulthood in both sexes.

Keywords: WGCNA; early postnatal malnutrition; perirenal adipose tissue; prenatal malnutrition; subcutaneous adipose tissue.


Conflict of interest statement

No conflicts of interest, financial or otherwise, are declared by the authors.

Figures

Figure 1.
Figure 1.
The heat map of module-pre/postnatal supply of digestible energy (DE) and crude protein (CP) relationships for subcutaneous male (SUB♂; A; n = 13), subcutaneous female (SUB♀; B; n = 15), perirenal male (PER♂; C; n = 12), and perirenal female (PER♀; D; n = 15) networks. Each matrix in the heat map contains a Pearson’s correlation between pre- and early postnatal CP and DE supply (x-axis) and module color (y-axis) and the corresponding P value in parentheses. The module color represents coregulated genes or modules clusters of highly interconnected genes, densely connected subnetworks from gene modules, which are usually related to biological functions. The red and blue colors of the heat map matrix represent positive and negative correlations, respectively, and the more intense the color, the stronger the correlation.
Figure 2.
Figure 2.
The heat map of module-histomorphometric relationships for subcutaneous male (SUB♂; A; n = 13), subcutaneous female (SUB♀; B; n = 15), perirenal male (PER♂; C; n = 12), and perirenal female (PER♀; D; n = 15) networks. Each matrix in the heat map contains a Pearson’s correlation and the corresponding P value in parentheses between the histomorphometric parameters (x-axis) and module color (y-axis). The red and blue colors of the heat-map matrix represent positive and negative correlations; the more intense the color, the stronger the correlation. On the x-axis of the heat map, SUB and PER represent the weights of subcutaneous and perirenal adipose tissue determined at autopsy. The CSA is the cross-sectional area in histological slides of individual adipocytes, which were automatically categorized by a specially designed application [Iron Hematoxylin Adipose Tissue (APP ID 10113; Visiopharm: protocol 3)] into cell size classes ranging from 0 to 40 (pct_under_40), 40 to 200 (pct_under_200), 200 to 400 (pct_under_400), 400 to 800 (pct_under_800), 800 to 1,600 (pct_under_1600), 1,600 to 3,200 (pct_under_3200), 3,200 to 6,400 (pct_under_6400), 6,400 to 12,800 (pct_under_12800), 12,800 to 25,600 (pct_under_25600), and 25,600 to 36,000 (pct_under_36000) µm2. Based on these different cell size classes (0–36,000 µm2), two different peaks were groups, namely peak 1 (0–6,400 µm2) and peak 2 (6,400–36,000 µm2). Protocol 1 of the application calculates the relative percentages of different tissue structures in the slide: adipocytes (cell_area) and membrane area (mem_area). A cell number index was calculated as CNI = (adipose mass (kg) × percentage adipocyte coverage in tissue slides)/volume of a spherical adipocyte. The volume of the spherical adipocyte was calculated using the formula: V = 4/3πr3, where the radius, r, was derived from a circle with the same area as the average CSA of adipocytes. The cell size distribution patterns, average CSA, and CNI allowed us to evaluate whether differences in fat deposition resulted from changes in adipocyte numbers (hyperplasia) or size (hypertrophy). Details of the protocols in the Iron Hematoxylin Adipose Tissue (APP ID 10113; Visiopharm) application are described in Ref. .
Figure 3.
Figure 3.
The heat map of module-plasma metabolite concentration relationships in 2.5-yr-old adult sheep for subcutaneous male (SUB♂; A; n = 13), subcutaneous female (SUB♀; B; n = 15), perirenal male (PER♂; C; n = 12), and perirenal female (PER♀; D; n = 15) networks. The red and blue colors of the heat map matrix represent positive and negative correlations; the more intense the color, the stronger the correlation. Each matrix in the heat map contains a Pearson’s correlation and the corresponding P value in parentheses between module color (y-axis). Concentrations of plasma metabolites (x-axis) measured in tolerance tests at different time points (in minutes) before (basal) or after intravenous bolus injections of either glucose (GTT), insulin (ITT), or propionate, the latter conducted in both fed (PTT_fed) and fasted (PTT-fasted) states. The determined plasma metabolites were glucose, nonesterified fatty acids (NEFA), triglycerides (TG), blood urea nitrogen, creatinine, lactate, β-hydroxybutyrate (BOHB), γ-glutamyl transferase (GGT), and cholesterol.
Figure 4.
Figure 4.
The heat map of module-thyroid hormone axis function-related relationships for subcutaneous male (SUB♂; A; n = 13), subcutaneous female (SUB♀; B; n = 15), perirenal male (PER♂; C; n = 12), and perirenal female (PER♀; D; n = 15) networks. Each matrix in the heat map contains a Pearson’s correlation and the corresponding P value in parentheses between module color (y-axis) and serum concentrations of thyroid hormones (T4, thyroxine; T3, triiodothyronine) and thyroid stimulating hormone (TSH) (x-axis). The red and blue colors of the heat map matrix represent positive and negative correlations, respectively; the more intense the color, the stronger the correlation. The serum levels of T3, T4, and TSH were determined in 2.5-yr-old adult sheep at different time points during 2 days in response to an intravenous injection of T4 in a thyroxine tolerance test (iTTT) following a period of overnight fasting.

Similar articles

References

    1. Glastonbury CA, Alves AC, Moustafa JS, Small KS. Cell-type heterogeneity in adipose tissue is associated with complex traits and reveals disease-relevant cell-specific eQTLs. Am J Hum Genet 104: 1013–1024, 2019. doi:10.1016/j.ajhg.2019.03.025. - DOI - PMC - PubMed
    1. Saxena A, Tiwari P, Wahi N, Soni A, Bansiwal RC, Kumar A, Sharma B, Punjabi P, Gupta N, Malik B, Medicherla KM, Suravajhala P, Mathur SK. Transcriptome profiling reveals association of peripheral adipose tissue pathology with type-2 diabetes in Asian Indians. Adipocyte 8: 125–136, 2019. doi:10.1080/21623945.2019.1595269. - DOI - PMC - PubMed
    1. Belligoli A, Compagnin C, Sanna M, Favaretto F, Fabris R, Busetto L, Foletto M, Dal Prà C, Serra R, Prevedello L, Da Re C, Bardini R, Mescoli C, Rugge M, Fioretto P, Conci S, Bettini S, Milan G, Vettor R. Characterization of subcutaneous and omental adipose tissue in patients with obesity and with different degrees of glucose impairment. Sci Rep 9: 1, 2019. doi:10.1038/s41598-019-47719-y. - DOI - PMC - PubMed
    1. Manno C, Campobasso N, Nardecchia A, Triggiani V, Zupo R, Gesualdo L, Silvestris F, De Pergola G. Relationship of para- and perirenal fat and epicardial fat with metabolic parameters in overweight and obese subjects. Eat Weight Disord 24: 67–72, 2019. doi:10.1007/s40519-018-0532-z. - DOI - PubMed
    1. Roever L, Resende ES, Veloso FC, Diniz AL, Penha-Silva N, Casella-Filho A, Dourado PM, Chagas AC. Perirenal fat and association with metabolic risk factors: The Uberlândia Heart Study. Medicine (Baltimore) 94: e1105, 2015. doi:10.1097/MD.0000000000001105. - DOI - PubMed

Publication types