. 2023 Aug 14;63(15):4716-4731.
doi: 10.1021/acs.jcim.3c00171. Epub 2023 Jul 17.

Complexity of Guanine Quadruplex Unfolding Pathways Revealed by Atomistic Pulling Simulations

Affiliations

Complexity of Guanine Quadruplex Unfolding Pathways Revealed by Atomistic Pulling Simulations

Petr Stadlbauer et al. J Chem Inf Model. .

Abstract

Guanine quadruplexes (GQs) are non-canonical nucleic acid structures involved in many biological processes. GQs formed in single-stranded regions often need to be unwound by cellular machinery, so their mechanochemical properties are important. Here, we performed steered molecular dynamics simulations of human telomeric GQs to study their unfolding. We examined four pulling regimes, including a very slow setup with pulling velocity and force load accessible to high-speed atomic force microscopy. We identified multiple factors affecting the unfolding mechanism, i.e.,: (i) the more the direction of force was perpendicular to the GQ channel axis (determined by GQ topology), the more the base unzipping mechanism happened, (ii) the more parallel the direction of force was, GQ opening and cross-like GQs were more likely to occur, (iii) strand slippage mechanism was possible for GQs with an all-anti pattern in a strand, and (iv) slower pulling velocity led to richer structural dynamics with sampling of more intermediates and partial refolding events. We also identified that a GQ may eventually unfold after a force drop under forces smaller than those that the GQ withstood before the drop. Finally, we found out that different unfolding intermediates could have very similar chain end-to-end distances, which reveals some limitations of structural interpretations of single-molecule spectroscopic data.


Conflict of interest statement

The authors declare no competing financial interest.

Figures

Figure 1
Figure 1
(A) G-quartet with a metal cation in the central cavity. “R” represents the sugar-phosphate moiety. (B) Illustrative GQ models. Guanines with the anti and syn glycosidic torsion χ orientation are displayed as rectangles in yellow and orange, respectively. Solid red lines indicate cis Watson–Crick Hoogsteen (cWH) base pairing. The bottom quartet is of opposite directionality than the middle and top ones. In the left model, the two blue arrows represent mutually parallel strands, and so do the two black arrows, but the black and blue strands are mutually antiparallel. In the right model, propeller, diagonal, and lateral loops are shown as green, purple, and cyan lines, respectively. The quartet including G closest to the 5′-end, is called “first”, and the indexing continues from it. See Figure 2 for examples of GQ polymorphism. (C) Illustrative schemes of common force-induced unfolding simulation techniques: (1) One selected point (white circle) of a molecule (green line) is connected by a virtual spring to a virtual particle (purple circle) that is moving in a predefined direction and one point is fixed in space (marked as a connection to the gray wall). (2) Instead of a fixed point, there is another connection by the second spring to a particle moving in the opposite direction. (3) Two points connected to a molecule are moving away from each other but not in a predefined direction, only their mutual distance is time-dependent. The springs are not independent but behave as if being just one, i.e., potential energy added by the spring depends on the molecule’s end-to-end distance as in (1) but without a fixed point. Pulling protocols used in this work employ the implementation displayed as option (3).
Figure 2
Figure 2
GQ and G-triplex models used in the pulling simulations. The red arrows indicate which two T’s were pulled away and the initial direction of the pulling force.
Figure 3
Figure 3
Illustration of the four applied pulling protocols as plots showing evolution of the pulling force (in blue) and end-to-end distance (in red) vs time. Protocols differ mainly by the timescale (horizontal axes), resulting in different pulling velocities (see Methods and Tables S1–S8). Zig-zag pulling protocols (plots in the middle) contain (up to) three different phases. Phase I (white area) resembles common constant velocity pulling (comparable to fast and very slow pulling protocols). Phase II (green area) is characterized by designed force drops at certain times (green vertical lines), i.e., at 100 ns, 200 ns, 1 μs, and 2 μs for slow zig-zag pulling and very slow zig-zag pulling simulations. Force drops allowed brief relaxation (often partial refolding) of systems manifested by a decrease in the end-to-end distance in the graphs. Occasionally, Phase III is reached, where systems are kept under constant maximum allowed distance between pulling centers; forces are not shown for this stage (brown area; see Materials and Methods for details). Notice that data for each plot were chosen from pulling simulations of different GQ topologies and thus, detailed side-by-side comparison of forces and distances in these plots would be misleading.
Figure 4
Figure 4
Common structural transitions and structures. The initial state of the transitions depicted in the top row is a native fully folded GQ. In principle, intermediates, such as G-triplexes, may also undergo all shown transitions (except for opening). In addition to the legend used in Figure 2, the color of the perimeter in the cross-like GQ (cross-like structure) indicates which bases are stacked together or are coplanar, solid red lines indicate cWH base pairing and the dashed lines indicate non-cWH base pairing. The bottom row depicts the corresponding snapshots of actual intermediates observed in pulling simulations; Gs from the first, second, and third G-quartet are highlighted in orange, blue, and red, respectively. Both terminal T residues (i.e., pulling centers) are shown in black, the remaining DNA residues are in gray, and channel K+ ions are shown as purple spheres.
Figure 5
Figure 5
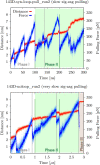
Unfolding of 143Dsyn_loop-pull and 143Dnoloop GQ models during slow zig-zag pulling simulation (top panel) and very slow zig-zag pulling simulation (bottom), respectively. The pulling phases and intended force drops are highlighted by green lines (see Figure 3 and Materials and Methods for details). The pulling force reached ∼290 pN without having any effect on the 143Dsyn_loop-pull model. After the externally induced force drop at 100 ns, an unfolding event occurred at a force of just ∼220 pN (gray vertical line, top panel). The bottom panel shows an example of the second and third quartets resisting a force higher than needed to disrupt the previous quartet; unfolding of the first quartet required ∼210 pN force (leftmost gray vertical), the second (middle) quartet resisted to ∼280 pN (middle gray vertical line), and the third quartet resisted to a force up to ∼320 pN (rightmost gray vertical). Notice that the first two drops of the pulling force in the top panel and the first drop in the bottom panel correspond to unstacking of the terminal Ts, which is typical for almost all simulations.
Figure 6
Figure 6
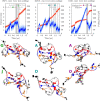
Side-by-side comparison of enforced unfolding of three main GQ systems, i.e., parallel 1KF1, hybrid 2GKU, and antiparallel 143D. Plots at the top show evolution of pulling force (in blue) and end-to-end distance (in red) vs time during very slow pulling simulations. It is clearly visible that parallel 1KF1 unfolded the most willingly, whereas antiparallel basket 143D GQ required significantly higher rupture forces (see Table 1 for details). Major structural events are shown (vertical lines) and labeled (capital letters). The most important pulling intermediates are highlighted (black vertical lines with letters in specific colors, i.e., green for 1KF1, cyan for 2GKU, and magenta for 143D) and shown as structural snapshots under the plots. See the legend in Figure 4 for the color scheme of the intermediate structures. See Supporting Information, Figures S25–S27, for snapshots of all the unfolding intermediates from these particular simulations and complete data from all three independent pulling simulations.
Figure 7
Figure 7
Pulling force vs. time and end-to-end distance vs. time graphs of two very slow zig-zag pulling simulations of the 3 + 1 hybrid 2GKU. G-hairpin (run1, letter “F”) can have a shorter end-to-end distance than G-triplex (run3, letter “E”) when taken in the context of the whole molecule. Notice that both the unfolding pathways proceeded via a very similar G-triplex state (run1, letter “D” and run3, letter “C”). Pulling phases and intended force drops in the very slow zig-zag protocol are highlighted (see Figure 3 and Materials and Methods for details). Important events are labeled by gray capital letters in the graphs and two key structures from each simulation (corresponding to the highlighted letters) are shown as snapshots below the graphs (see the legend of Figure 4 for details about the coloring scheme). Detailed descriptions and snapshots of all intermediates are in the Supporting Information, Table S11 and Figure S19.

Similar articles

Cited by

References

    1. Chambers V. S.; Marsico G.; Boutell J. M.; Di Antonio M.; Smith G. P.; Balasubramanian S. High-Throughput Sequencing of DNA G-Quadruplex Structures in the Human Genome. Nat. Biotechnol. 2015, 33, 877–881. 10.1038/nbt.3295. - DOI - PubMed
    1. Bedrat A.; Lacroix L.; Mergny J.-L. Re-Evaluation of G-Quadruplex Propensity with G4Hunter. Nucleic Acids Res. 2016, 44, 1746–1759. 10.1093/nar/gkw006. - DOI - PMC - PubMed
    1. Rhodes D.; Lipps H. J. G-Quadruplexes and Their Regulatory Roles in Biology. Nucleic Acids Res. 2015, 43, 8627–8637. 10.1093/nar/gkv862. - DOI - PMC - PubMed
    1. Varshney D.; Spiegel J.; Zyner K.; Tannahill D.; Balasubramanian S. The Regulation and Functions of DNA and RNA G-Quadruplexes. Nat. Rev. Mol. Cell Biol. 2020, 21, 459–474. 10.1038/s41580-020-0236-x. - DOI - PMC - PubMed
    1. Lee W. T. C.; Yin Y.; Morten M. J.; Tonzi P.; Gwo P. P.; Odermatt D. C.; Modesti M.; Cantor S. B.; Gari K.; Huang T. T.; et al. Single-Molecule Imaging Reveals Replication Fork Coupled Formation of G-Quadruplex Structures Hinders Local Replication Stress Signaling. Nat. Commun. 2021, 12, 2525.10.1038/s41467-021-22830-9. - DOI - PMC - PubMed

Publication types