. 2023 Nov;60(11):6441-6465.
doi: 10.1007/s12035-023-03456-y. Epub 2023 Jul 17.

Extracellular Vesicle-Serpine-1 Affects Neural Progenitor Cell Mitochondrial Networks and Synaptic Density: Modulation by Amyloid Beta and HIV-1

Affiliations

Extracellular Vesicle-Serpine-1 Affects Neural Progenitor Cell Mitochondrial Networks and Synaptic Density: Modulation by Amyloid Beta and HIV-1

Ibolya E András et al. Mol Neurobiol. 2023 Nov.

Abstract

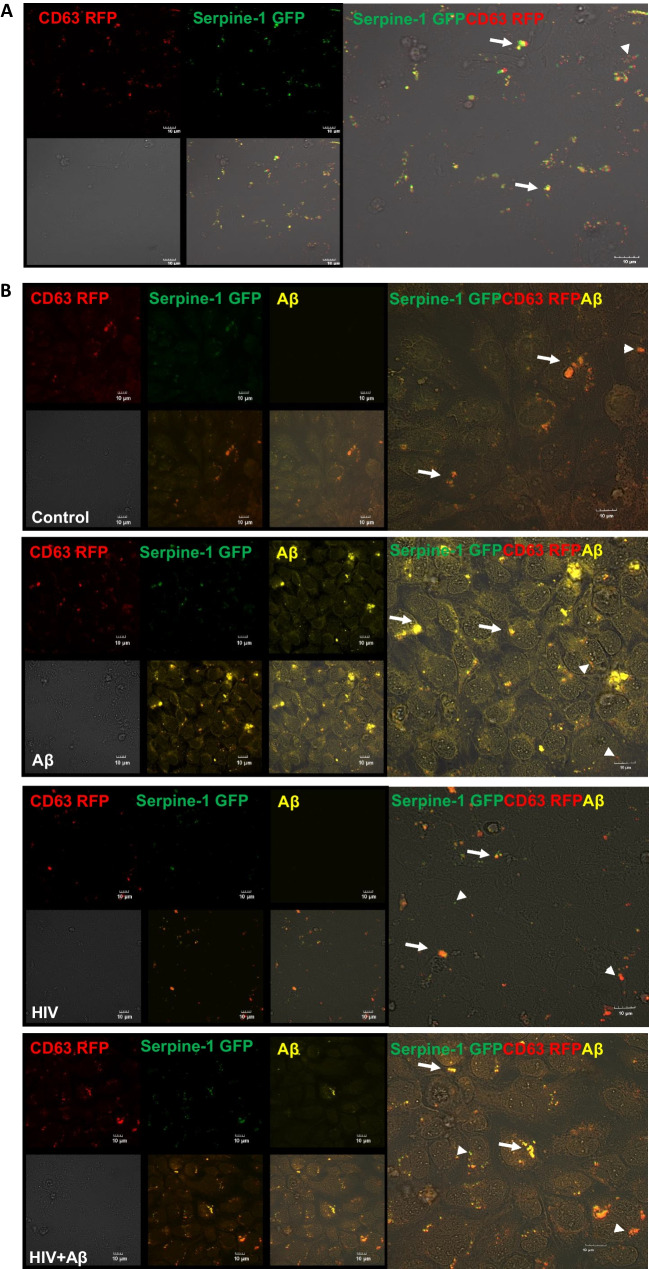
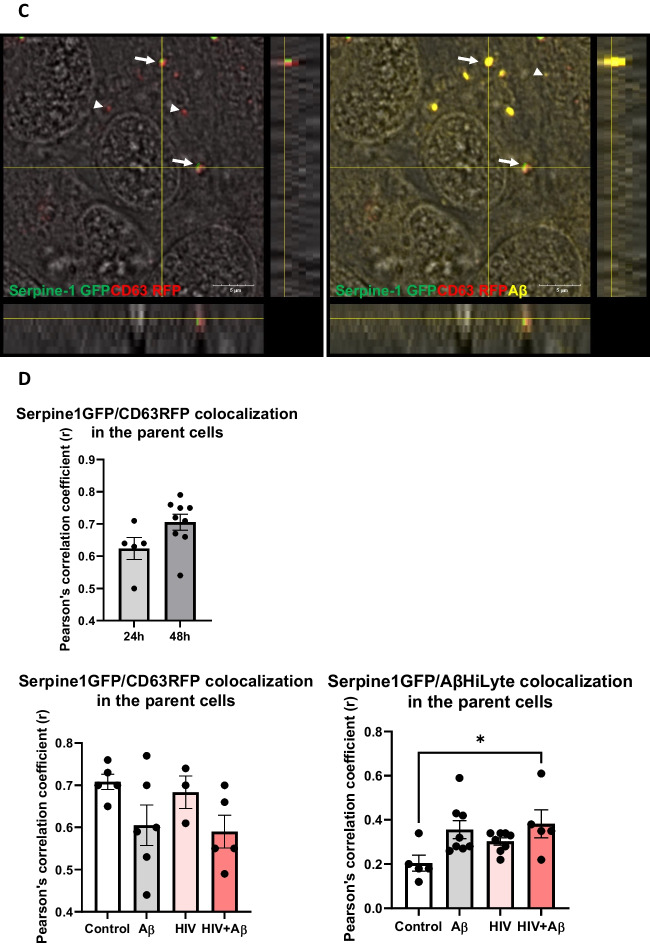
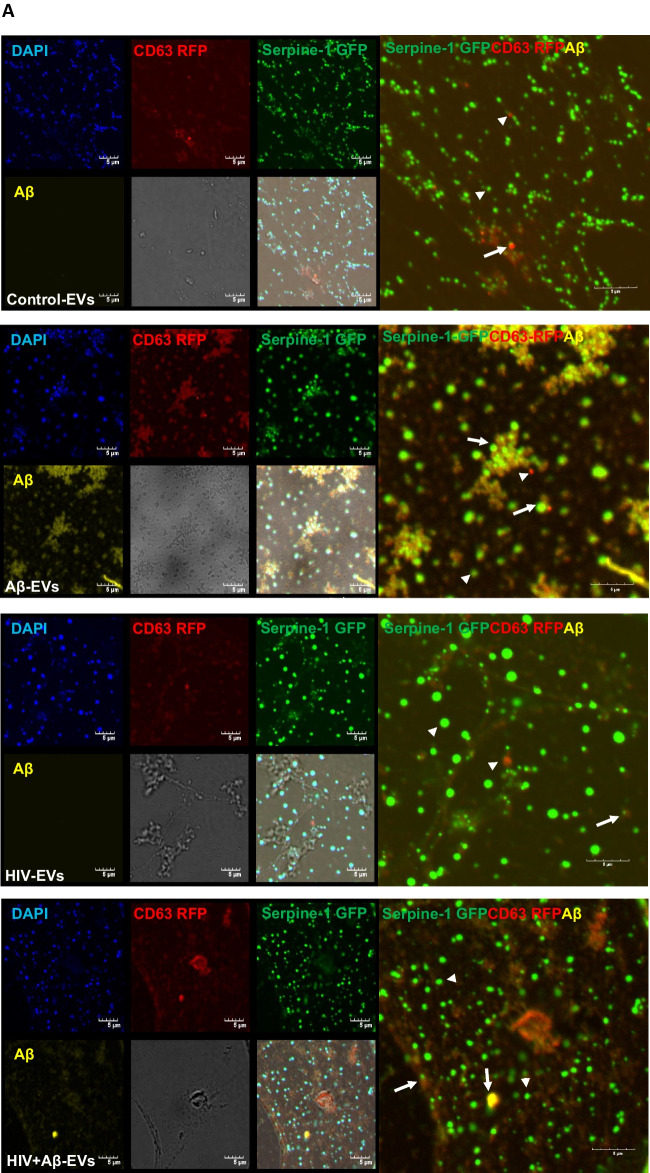
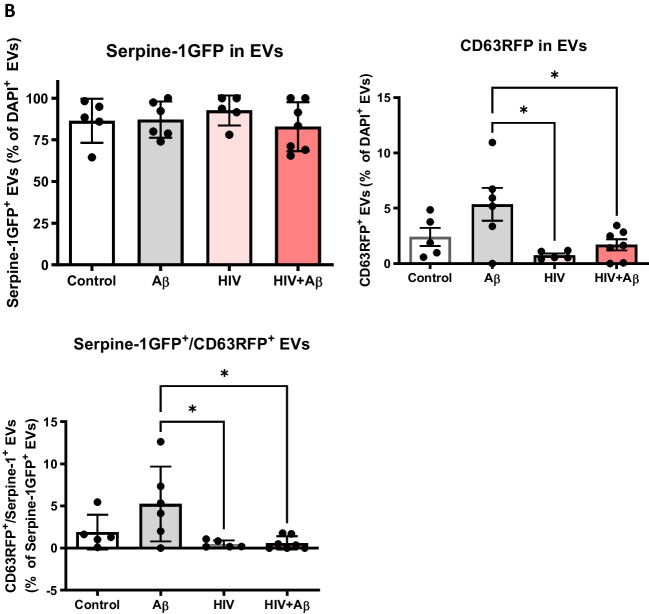
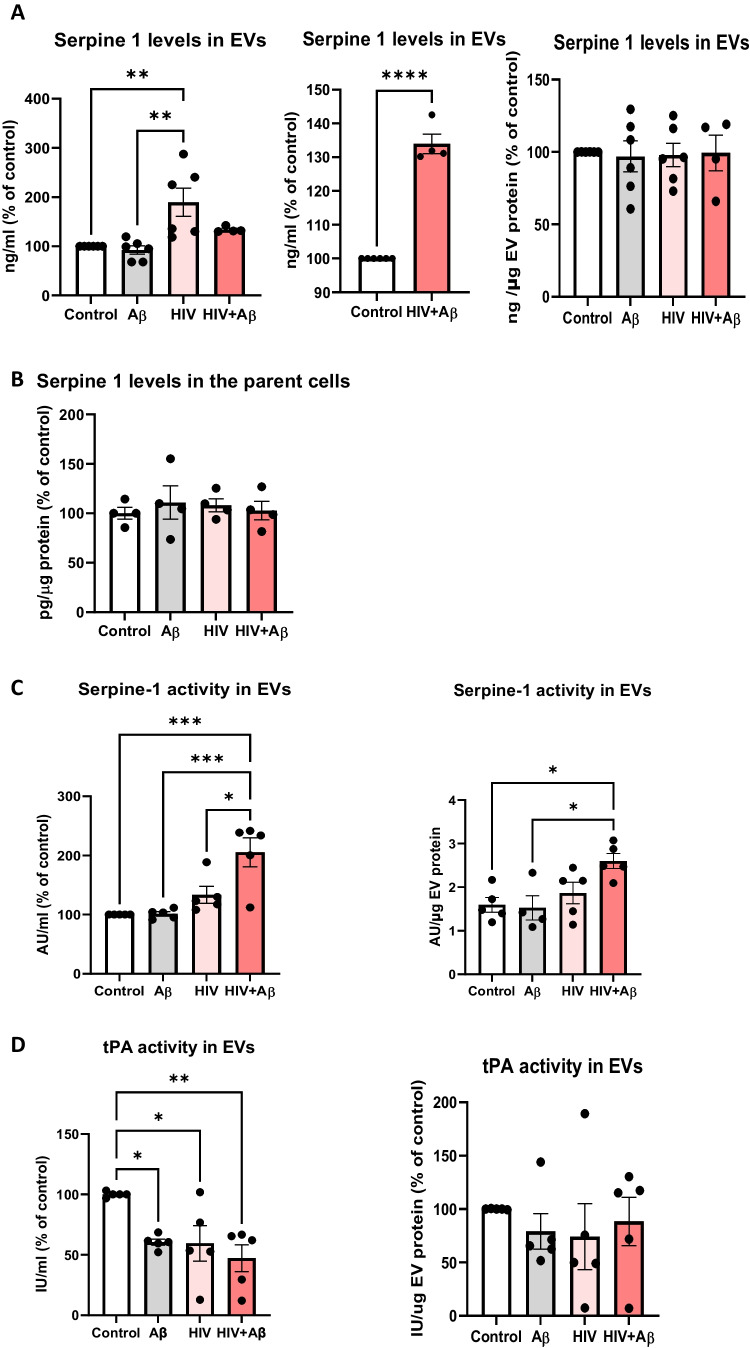
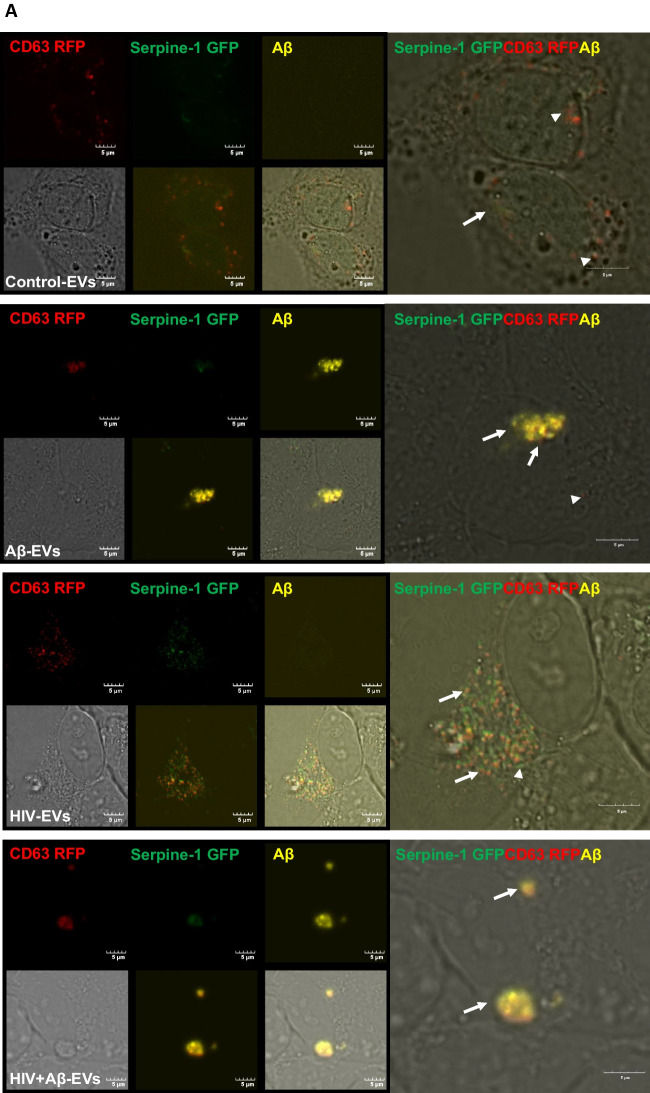
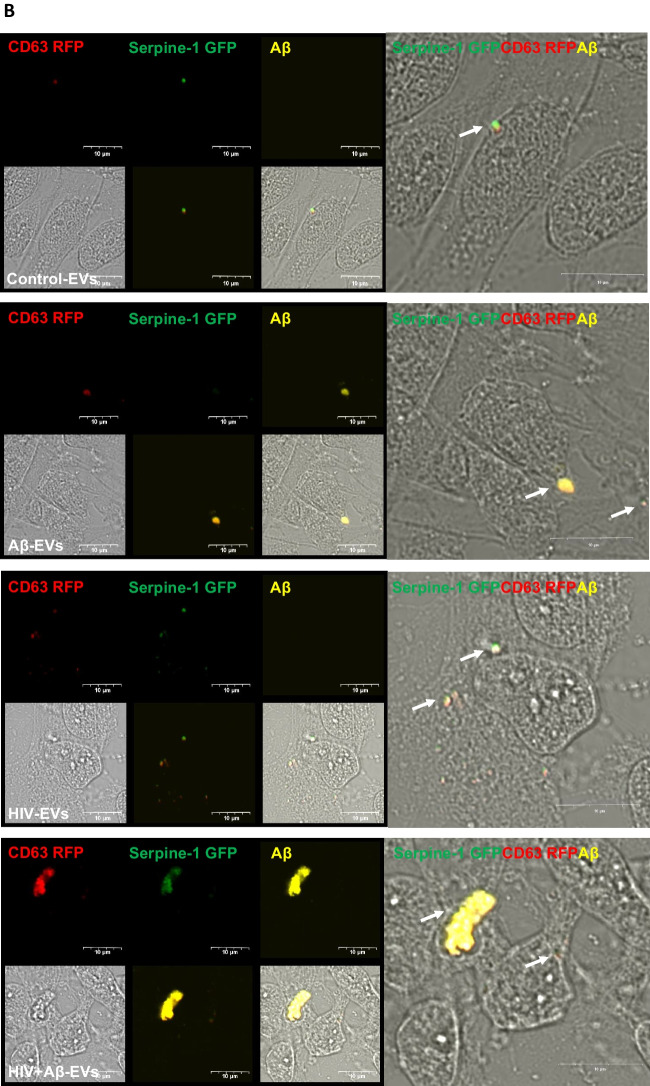
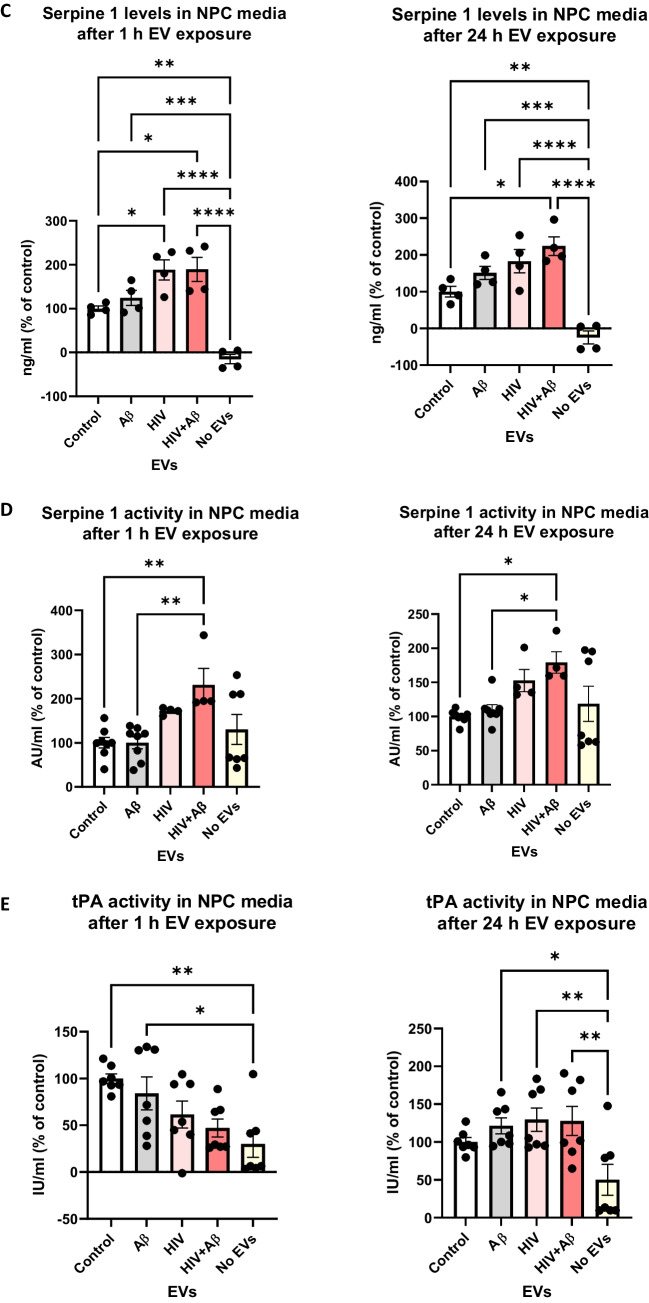
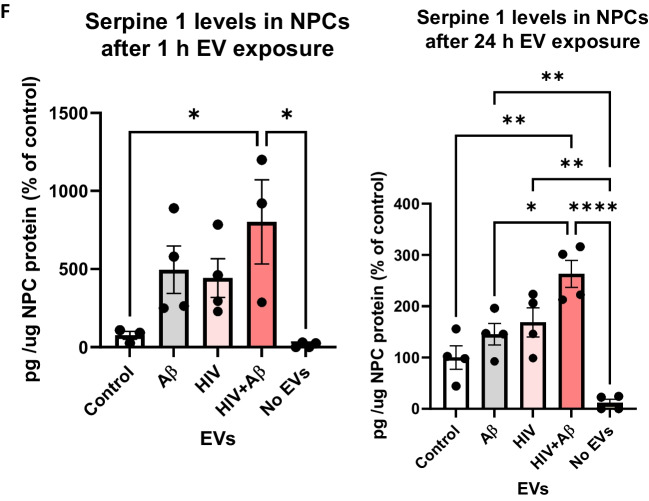
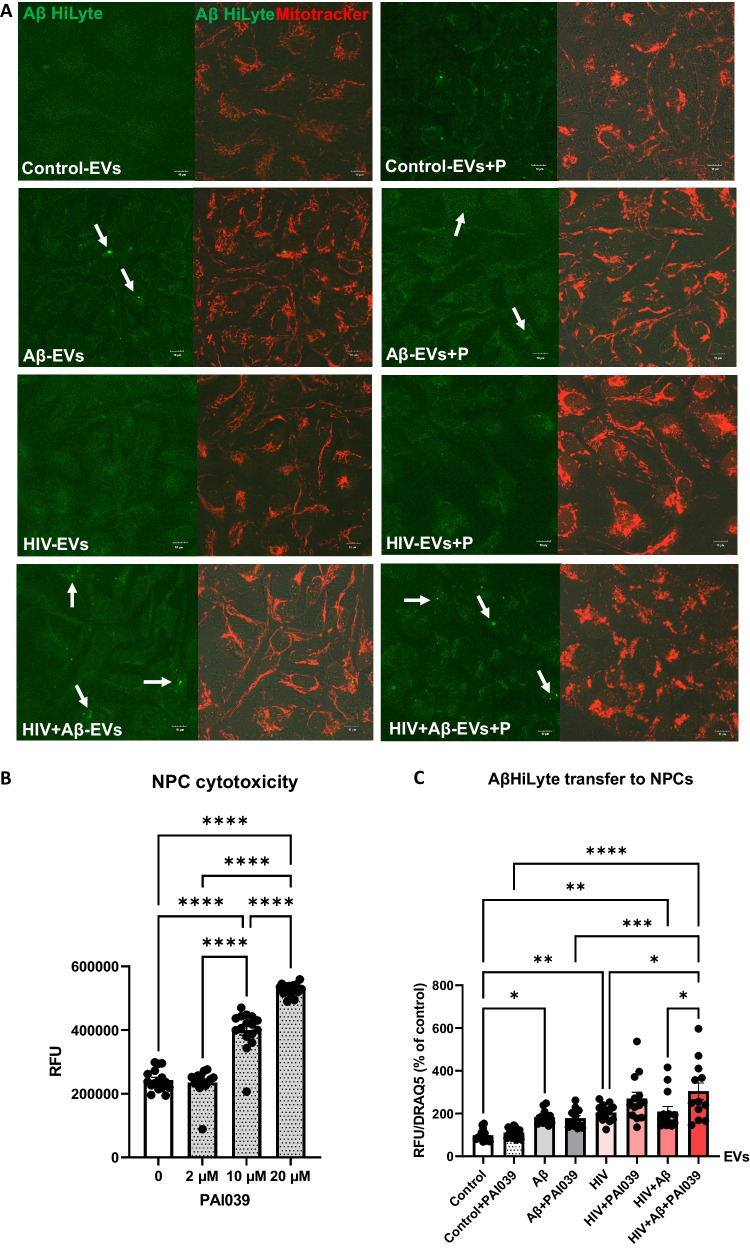
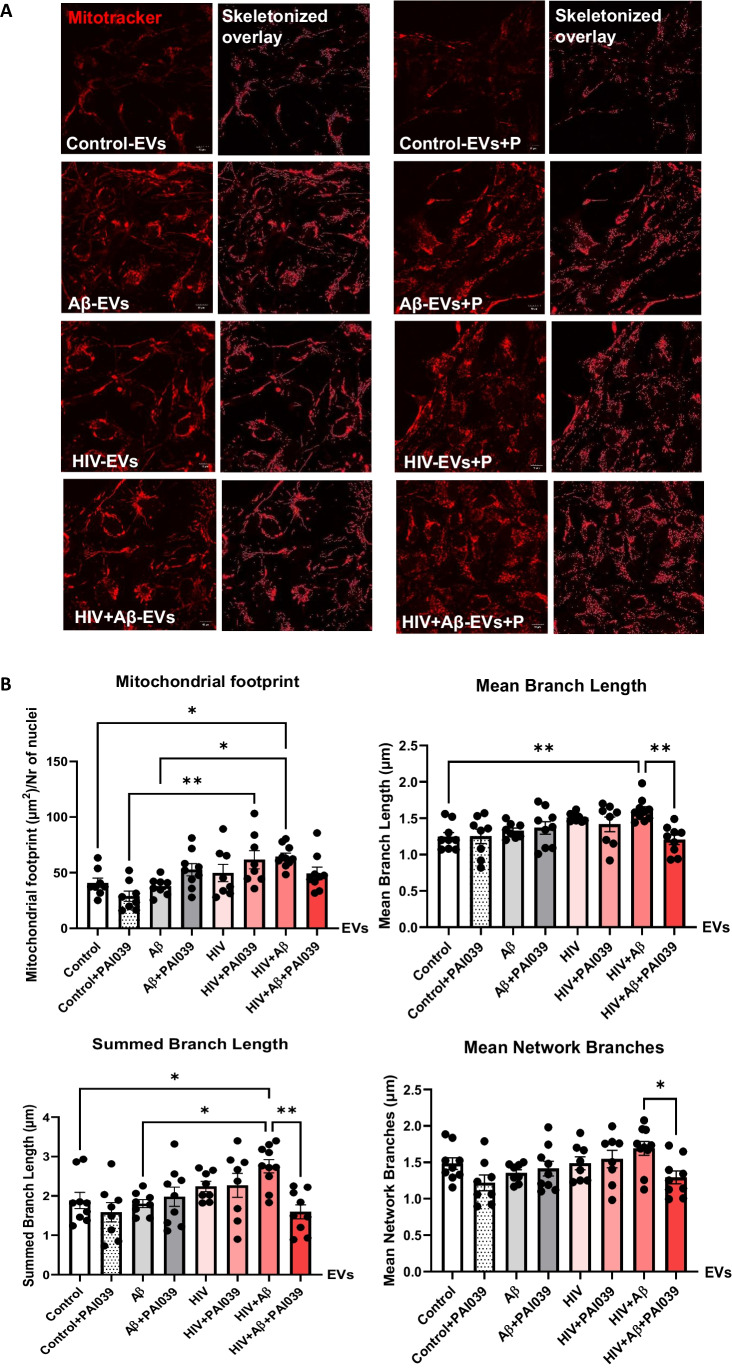
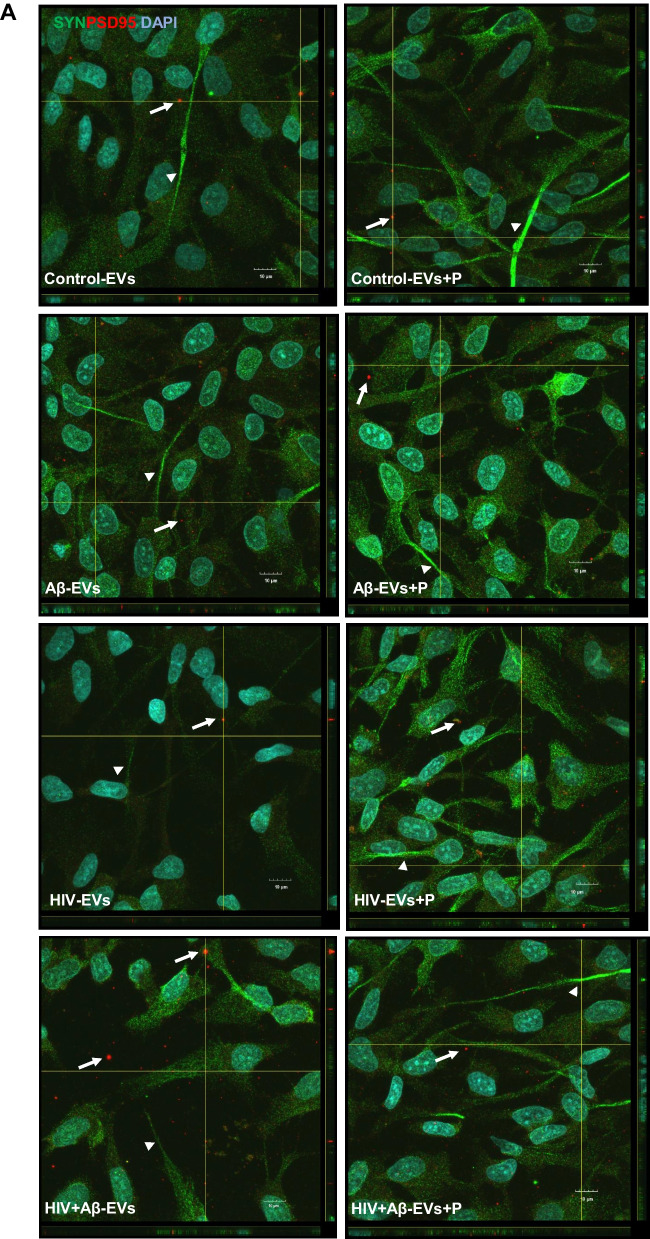
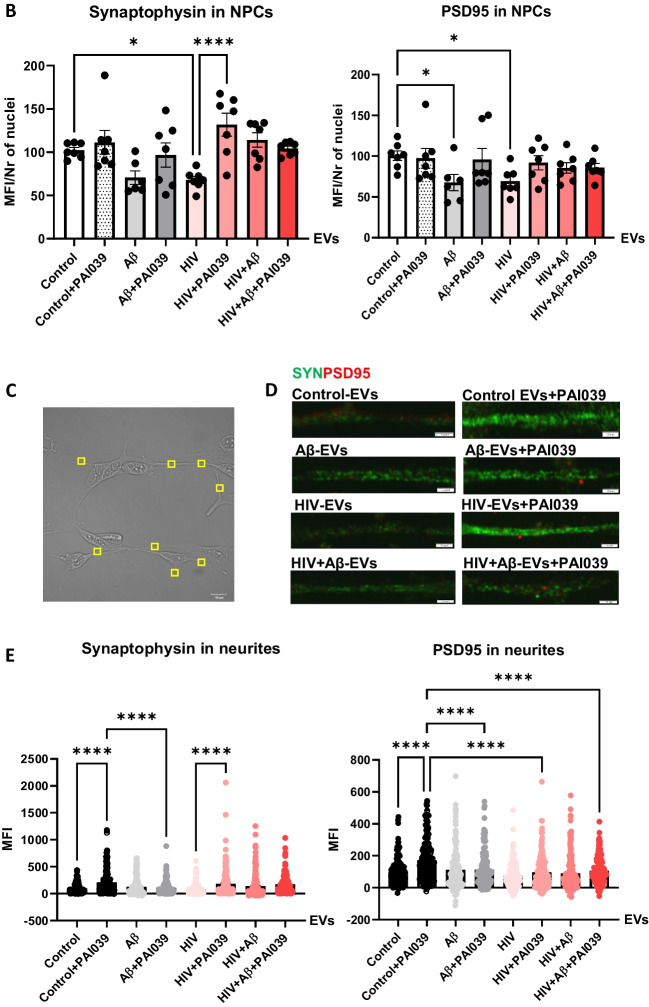
Brain endothelial extracellular vesicles carrying amyloid beta (EV-Aβ) can be transferred to neural progenitor cells (NPCs) leading to NPC dysfunction. However, the events involved in this EV-mediated Aβ pathology are unclear. EV-proteomics studies identified Serpine-1 (plasminogen activator inhibitor 1, PAI-1) as a major connecting "hub" on several protein-protein interaction maps. Serpine-1 was described as a key player in Aβ pathology and was linked to HIV-1 infection as well. Therefore, the aim of this work was to address the hypothesis that Serpine-1 can be transferred via EVs from brain endothelial cells (HBMEC) to NPCs and contribute to NPC dysfunction. HBMEC concentrated and released Serpine-1 via EVs, the effect that was potentiated by HIV-1 and Aβ. EVs loaded with Serpine-1 were readily taken up by NPCs, and HIV-1 enhanced this event. Interestingly, a highly specific Serpine-1 inhibitor PAI039 increased EV-Aβ transfer to NPCs in the presence of HIV-1. PAI039 also partially blocked mitochondrial network morphology alterations in the recipient NPCs, which developed mainly after HIV + Aβ-EV transfer. PAI039 partly attenuated HIV-EV-mediated decreased synaptic protein levels in NPCs, while increased synaptic protein levels in NPC projections. These findings contribute to a better understanding of the complex mechanisms underlying EV-Serpine-1 related Aβ pathology in the context of HIV infection. They are relevant to HIV-1 associated neurocognitive disorders (HAND) in an effort to elucidate the mechanisms of neuropathology in HIV infection.

Keywords: Amyloid beta; Blood–brain barrier; Extracellular vesicles; HIV-1; Neural progenitor cells; Serpine-1.


Conflict of interest statement

The authors declare that they have no competing interests.

Figures

Fig. 1
Fig. 1
Serpine-1 is concentrated in vesicular structures in brain endothelial cells. HBMEC were transfected with the Serpine-1 GFP and CD63 RFP plasmids (A) and 24 h after transfection, cells were exposed to HIV-1 (30 ng p24/ml) and/or 100 nM Aβ (1–40) HiLyte 647 for 48 h (B). A The images represent live imaging of Serpine-1 GFP and CD63 RFP (arrow heads) in the parent HBMEC 24 h after transfection. Scale bar: 10 μm. B Serpine-1 GFP, CD63 RFP, or Aβ HiLyte 647-positive fluorescence (arrow heads) in the fixed parent cells 48 h after vehicle (control), HIV-1, and/or Aβ exposure. Arrows indicate overlapping positive fluorescence of Serpine-1 GFP, CD63 RFP, and/or Aβ HiLyte 647. Scale bar: 10 μm. Representative images from four experiments. C Confocal z-stack imaging of Serpine-1 GFP, CD63 RFP, and Aβ HiLyte 647 colocalization (arrows) in the fixed parent cells 48 h after HIV-1 and Aβ exposure. Scale bar: 5 μm. D Quantification of colocalization of Serpine-1 GFP and CD63 RFP in the live parent cells after transfection (upper graph), unpaired t-test; Colocalization of Serpine-1 GFP and CD63 RFP (lower left graph) and Serpine-1 GFP and Aβ HiLyte 647 (lower right graph) in the fixed parent cells 48 h after HIV-1 and/or Aβ exposure. Values are mean ± SEM, n = 3–9. One- and two-way ANOVA with Tukey’s multiple comparisons test. *Statistically significant at p < 0.05
Fig. 1
Fig. 1
Serpine-1 is concentrated in vesicular structures in brain endothelial cells. HBMEC were transfected with the Serpine-1 GFP and CD63 RFP plasmids (A) and 24 h after transfection, cells were exposed to HIV-1 (30 ng p24/ml) and/or 100 nM Aβ (1–40) HiLyte 647 for 48 h (B). A The images represent live imaging of Serpine-1 GFP and CD63 RFP (arrow heads) in the parent HBMEC 24 h after transfection. Scale bar: 10 μm. B Serpine-1 GFP, CD63 RFP, or Aβ HiLyte 647-positive fluorescence (arrow heads) in the fixed parent cells 48 h after vehicle (control), HIV-1, and/or Aβ exposure. Arrows indicate overlapping positive fluorescence of Serpine-1 GFP, CD63 RFP, and/or Aβ HiLyte 647. Scale bar: 10 μm. Representative images from four experiments. C Confocal z-stack imaging of Serpine-1 GFP, CD63 RFP, and Aβ HiLyte 647 colocalization (arrows) in the fixed parent cells 48 h after HIV-1 and Aβ exposure. Scale bar: 5 μm. D Quantification of colocalization of Serpine-1 GFP and CD63 RFP in the live parent cells after transfection (upper graph), unpaired t-test; Colocalization of Serpine-1 GFP and CD63 RFP (lower left graph) and Serpine-1 GFP and Aβ HiLyte 647 (lower right graph) in the fixed parent cells 48 h after HIV-1 and/or Aβ exposure. Values are mean ± SEM, n = 3–9. One- and two-way ANOVA with Tukey’s multiple comparisons test. *Statistically significant at p < 0.05
Fig. 2
Fig. 2
Serpine-1 is released in EVs from control, Aβ, and/or HIV-1 exposed brain endothelial cells (A) Visualization by confocal microscopy of Serpine-1 GFP (green), CD63 RFP (red), and Aβ (1–40) HiLyte (yellow) (arrow heads) in EVs isolated from media of transfected and treated HBMEC as in Fig. 1. Examples of overlapping fluorescence of Serpine-1 GFP, CD63 RFP, and/or Aβ (1–40) HiLyte associated with EVs are indicated by arrows. DAPI stains the genetic material in EVs. Representative images from three experiments. Scale bar: 5 μm. B Quantification of Serpine-1 GFP-positive, CD63 RFP-positive, and Serpine-1 GFP/CD63 RFP-double positive EVs. Values are mean ± SEM, n = 5–7. One- and two-way ANOVA with Šídák's and Tukey’s multiple comparisons tests. *Statistically significant at p < 0.05
Fig. 2
Fig. 2
Serpine-1 is released in EVs from control, Aβ, and/or HIV-1 exposed brain endothelial cells (A) Visualization by confocal microscopy of Serpine-1 GFP (green), CD63 RFP (red), and Aβ (1–40) HiLyte (yellow) (arrow heads) in EVs isolated from media of transfected and treated HBMEC as in Fig. 1. Examples of overlapping fluorescence of Serpine-1 GFP, CD63 RFP, and/or Aβ (1–40) HiLyte associated with EVs are indicated by arrows. DAPI stains the genetic material in EVs. Representative images from three experiments. Scale bar: 5 μm. B Quantification of Serpine-1 GFP-positive, CD63 RFP-positive, and Serpine-1 GFP/CD63 RFP-double positive EVs. Values are mean ± SEM, n = 5–7. One- and two-way ANOVA with Šídák's and Tukey’s multiple comparisons tests. *Statistically significant at p < 0.05
Fig. 3
Fig. 3
Serpine-1 levels and activity in the released EVs. Non-transfected HBMEC were exposed to HIV-1 (30 ng p24/ml) and/or 100 nM Aβ (1–40) for 48 h, followed by isolation of released EVs from the culture media. Serpine-1 levels in EVs and the parent cells were measured by ELISA. Serpine-1 activity and tPA activity were determined by specific activity assays. A Serpine-1 levels in isolated EVs normalized to cell culture media volume (left and middle graph) or to EV protein content (right graph). B Serpine-1 levels in the parent cells. Values are mean ± SEM, n = 4–8. C Serpine-1 activity in the isolated EVs normalized to cell culture media volume (left graph) or to EV protein content (right graph). D tPA activity in the isolated EVs normalized to cell culture media volume (left graph) or to EV protein content (right graph). Values are mean ± SEM, n = 4–5. One- and two-way ANOVA with Tukey’s multiple comparisons test. *Statistically significant at p < 0.05, **p < 0.01, ***p < 0.001, or ****p < 0.0001
Fig. 4
Fig. 4
Transfer of Serpine-1 from donor HBMEC-derived EVs to recipient neural progenitor cells (NPCs). HBMEC were transfected and treated as in Fig. 1, followed by isolation of EVs from the cell culture media and treatment of NPCs for up to 24 h. All images were performed by confocal microscopy. A Live imaging of Serpine-1 GFP (green), CD63 RFP (red) and Aβ (1–40) HiLyte (yellow) in non-fluorescent NPC cultures (arrow heads) after 1 h exposure to EVs from Control HBMEC, HIV-1 and/or Aβ-treated HBMEC. Scale bar: 5 μm. B Visualization of Serpine-1 GFP (green), CD63 RFP (red) and Aβ (1–40) HiLyte (yellow) in fixed non-fluorescent NPC cultures (arrow heads) after 24 h of EVs exposure. Examples of overlapping fluorescence of Serpine-1 GFP, CD63 RFP and Aβ (1–40) HiLyte in (A) and (B) are indicated by arrows. Scale bar: 10 μm. Representative images from three experiments. C-F Non-transfected HBMEC were treated as in Fig. 3. EVs were isolated from the culture media and employed for NPC treatment for 1 (left panels) or 24 h (right panels). Serpine-1 levels (C), Serpine-1 activity (D), and tPA activity (E) were determined in NPC media as in Fig. 3. F Serpine-1 levels in the recipient NPCs 1 h (left graph) and 24 h (right graph) after EVs exposure Values are mean ± SEM, n = 4–7. One- and two-way ANOVA with Tukey’s multiple comparisons test. *Statistically significant at p < 0.05, **p < 0.01, ***p < 0.001, and ****p < 0.0001
Fig. 4
Fig. 4
Transfer of Serpine-1 from donor HBMEC-derived EVs to recipient neural progenitor cells (NPCs). HBMEC were transfected and treated as in Fig. 1, followed by isolation of EVs from the cell culture media and treatment of NPCs for up to 24 h. All images were performed by confocal microscopy. A Live imaging of Serpine-1 GFP (green), CD63 RFP (red) and Aβ (1–40) HiLyte (yellow) in non-fluorescent NPC cultures (arrow heads) after 1 h exposure to EVs from Control HBMEC, HIV-1 and/or Aβ-treated HBMEC. Scale bar: 5 μm. B Visualization of Serpine-1 GFP (green), CD63 RFP (red) and Aβ (1–40) HiLyte (yellow) in fixed non-fluorescent NPC cultures (arrow heads) after 24 h of EVs exposure. Examples of overlapping fluorescence of Serpine-1 GFP, CD63 RFP and Aβ (1–40) HiLyte in (A) and (B) are indicated by arrows. Scale bar: 10 μm. Representative images from three experiments. C-F Non-transfected HBMEC were treated as in Fig. 3. EVs were isolated from the culture media and employed for NPC treatment for 1 (left panels) or 24 h (right panels). Serpine-1 levels (C), Serpine-1 activity (D), and tPA activity (E) were determined in NPC media as in Fig. 3. F Serpine-1 levels in the recipient NPCs 1 h (left graph) and 24 h (right graph) after EVs exposure Values are mean ± SEM, n = 4–7. One- and two-way ANOVA with Tukey’s multiple comparisons test. *Statistically significant at p < 0.05, **p < 0.01, ***p < 0.001, and ****p < 0.0001
Fig. 5
Fig. 5
Involvement of Serpine-1 in the transfer of Aβ cargo from HBMEC-derived EVs to recipient NPCs. HBMEC were exposed to HIV (30 ng/ml) and/or 100 nM Aβ (1–40) HiLyte 488 for 48 h, followed by isolation of EVs from the cell culture media and treatment of NPCs for 24 h in the presence or absence of PAI039. A Confocal images of recipient NPCs with Aβ HiLyte fluorescence (green) and Mitotracker (red). B Dose-dependent PAI039 cytotoxicity in NPCs. C Quantification of Aβ HiLyte fluorescence in recipient NPCs. NPCs grown on 96-well plates were exposed to HBMEC-derived fluorescent EVs for 24 h. Controls were exposed to non-fluorescent EVs from HBMEC. Selected NPCs were cotreated with the Serpine-1 inhibitor PAI039 (2 μM) and EVs for 24 h. After washing with PBS, Aβ HiLyte fluorescence was measured (Abs/Em 503/528 nm) in a plate reader. The values were normalized to nuclear DRAQ5 fluorescence. Values are mean ± SEM, n = 12–14. One-, two- and three-way ANOVA with Tukey’s multiple comparisons test. *Statistically significant at p < 0.05, **p < 0.01, ***p < 0.001, ****p < 0.0001
Fig. 6
Fig. 6
Mitochondrial network analysis (MiNA) of mitochondrial morphology in EV-exposed NPCs. Non-transfected HBMEC were treated as in Fig. 3. EVs were isolated from the culture media and employed for NPC treatment for 24 h. Selected NPCs were cotreated with PAI039 (2 μM) and EVs for 24 h. A Confocal images of NPCs stained with Mitotracker Deep Red (red) for tracking the mitochondria. MiNA plugin on ImageJ was used to skeletonize the mitochondria. Scale bar: 10 µm. B Quantification of the mitochondrial footprint, mean branch length, total branch length and mean network branches. Values are mean ± SEM, n = 8–10. One-, two- and three-way ANOVA with Tukey’s multiple comparisons test. *Statistically significant p < 0.05, **p < 0.01
Fig. 7
Fig. 7
Impact of HBMEC-derived EVs on synaptic protein expression in NPCs. Non-transfected HBMEC were treated with HIV and/or Aβ and EVs were isolated as in Fig. 3. Then, human NPCs were exposed to HBMEC-derived EVs for 24 h, with selected cultures additionally treated with 2 µM PAI039 (P) as in Fig. 6. A synaptophysin (green; arrow heads) and PSD95 (red; arrows) immunoreactivity as imaged by confocal microscopy. DAPI staining (blue) visualizes the NPC nuclei. The combined z-stack images with maximum intensity projection are representative from three experiments. Scale bar: 10 μm. Individual panels are shown in Supplementary Fig. 2. B Total intensity of synaptophysin (left graph) and PSD95 (right graph) immunoreactivity as quantified from the confocal images. Values are mean ± SEM, n = 7. One-, two- and three-way ANOVA with Šídák's multiple comparisons tests. C Example of a brightfield confocal image with random identical rectangular areas on NPC projections. D Synaptophysin (green) and PSD95 (red) immunoreactivity on representative confocal images of NPC projections. Scale bar: 2 μm. E Intensity of synaptophysin and PSD95 immunoreactivity as quantified from random projection areas. Values are mean ± SEM, n = 160–180. One-, two- and three-way ANOVA with Šídák's and Tukey’s multiple comparisons tests. *Statistically significant at p < 0.05, ****p < 0.0001
Fig. 7
Fig. 7
Impact of HBMEC-derived EVs on synaptic protein expression in NPCs. Non-transfected HBMEC were treated with HIV and/or Aβ and EVs were isolated as in Fig. 3. Then, human NPCs were exposed to HBMEC-derived EVs for 24 h, with selected cultures additionally treated with 2 µM PAI039 (P) as in Fig. 6. A synaptophysin (green; arrow heads) and PSD95 (red; arrows) immunoreactivity as imaged by confocal microscopy. DAPI staining (blue) visualizes the NPC nuclei. The combined z-stack images with maximum intensity projection are representative from three experiments. Scale bar: 10 μm. Individual panels are shown in Supplementary Fig. 2. B Total intensity of synaptophysin (left graph) and PSD95 (right graph) immunoreactivity as quantified from the confocal images. Values are mean ± SEM, n = 7. One-, two- and three-way ANOVA with Šídák's multiple comparisons tests. C Example of a brightfield confocal image with random identical rectangular areas on NPC projections. D Synaptophysin (green) and PSD95 (red) immunoreactivity on representative confocal images of NPC projections. Scale bar: 2 μm. E Intensity of synaptophysin and PSD95 immunoreactivity as quantified from random projection areas. Values are mean ± SEM, n = 160–180. One-, two- and three-way ANOVA with Šídák's and Tukey’s multiple comparisons tests. *Statistically significant at p < 0.05, ****p < 0.0001

Update of

Similar articles

Cited by

References

    1. Xu J, Ikezu T. The comorbidity of HIV-associated neurocognitive disorders and Alzheimer's disease: a foreseeable medical challenge in post-HAART era. J Neuroimmune Pharmacol. 2009;4(2):200–212. doi: 10.1007/s11481-008-9136-0. - DOI - PMC - PubMed
    1. Soontornniyomkij V, et al. Cerebral beta-amyloid deposition predicts HIV-associated neurocognitive disorders in APOE epsilon4 carriers. AIDS. 2012;26(18):2327–2335. doi: 10.1097/QAD.0b013e32835a117c. - DOI - PMC - PubMed
    1. Green DA, et al. Brain deposition of beta-amyloid is a common pathologic feature in HIV positive patients. AIDS. 2005;19(4):407–411. doi: 10.1097/01.aids.0000161770.06158.5c. - DOI - PubMed
    1. Steinbrink F, et al. Cognitive impairment in HIV infection is associated with MRI and CSF pattern of neurodegeneration. Eur J Neurol. 2013;20(3):420–428. doi: 10.1111/ene.12006. - DOI - PubMed
    1. Esiri MM, Biddolph SC, Morris CS. Prevalence of Alzheimer plaques in AIDS. J Neurol Neurosurg Psychiatry. 1998;65(1):29–33. doi: 10.1136/jnnp.65.1.29. - DOI - PMC - PubMed

MeSH terms

Substances