

Intentional deep overfit learning for patient-specific dose predictions in adaptive radiotherapy
- PMID: 37459122
- PMCID: PMC10530457
- DOI: 10.1002/mp.16616
Intentional deep overfit learning for patient-specific dose predictions in adaptive radiotherapy
Abstract
Background: The framework of adaptive radiation therapy (ART) was crafted to address the underlying sources of intra-patient variation that were observed throughout numerous patients' radiation sessions. ART seeks to minimize the consequential dosimetric uncertainty resulting from this daily variation, commonly through treatment planning re-optimization. Re-optimization typically consists of manual evaluation and modification of previously utilized optimization criteria. Ideally, frequent treatment plan adaptation through re-optimization on each day's computed tomography (CT) scan may improve dosimetric accuracy and minimize dose delivered to organs at risk (OARs) as the planning target volume (PTV) changes throughout the course of treatment.
Purpose: Re-optimization in its current form is time-consuming and inefficient. In response to this ART bottleneck, we propose a deep learning based adaptive dose prediction model that utilizes a head and neck (H&N) patient's initial planning data to fine-tune a previously trained population model towards a patient-specific model. Our fine-tuned, patient-specific (FT-PS) model, which is trained using the intentional deep overfit learning (IDOL) method, may enable clinicians and treatment planners to rapidly evaluate relevant dosimetric changes daily and re-optimize accordingly.
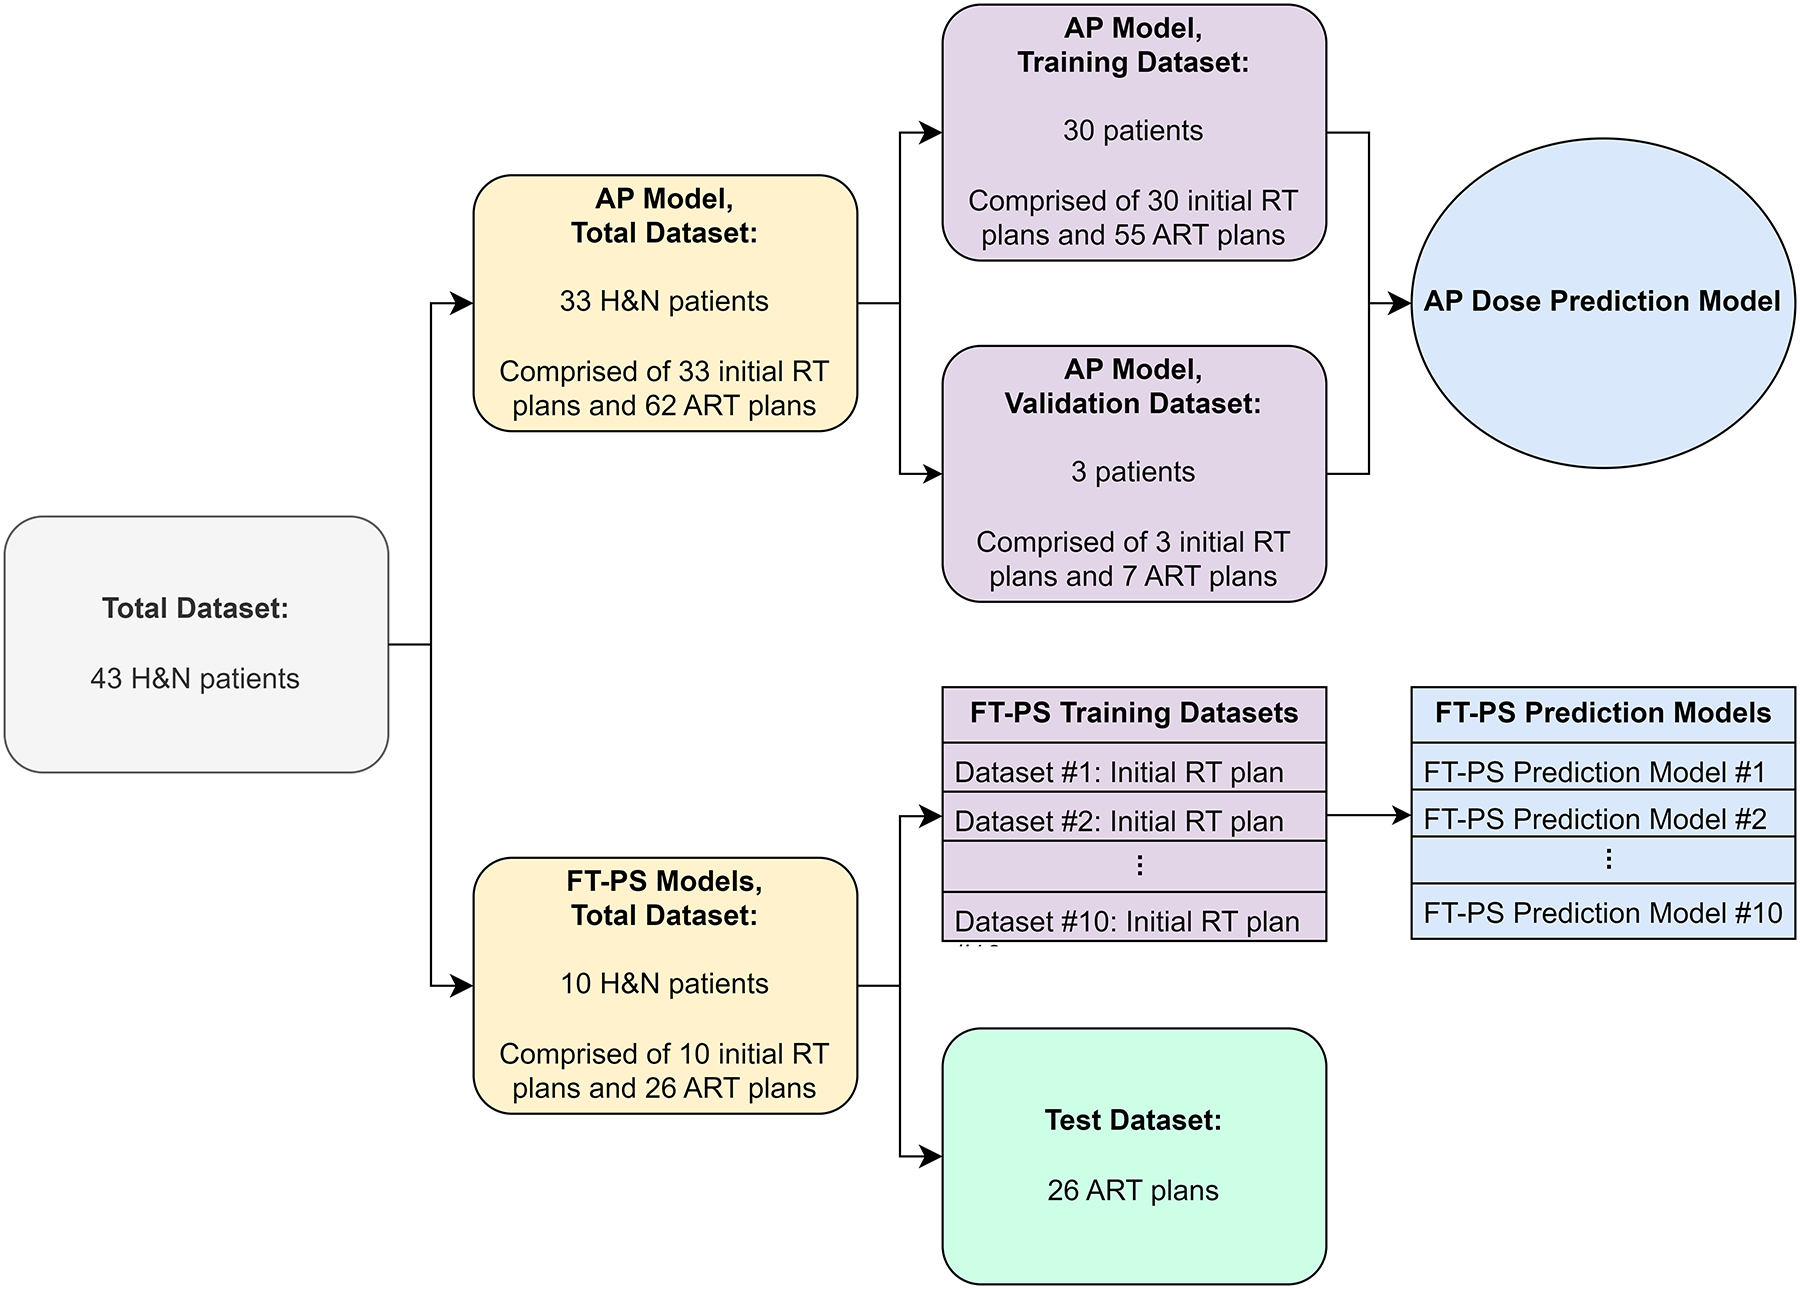
Methods: An adaptive population (AP) model was trained using adaptive data from 33 patients. Separately, 10 patients were selected for training FT-PS models. The previously trained AP model was utilized as the base model weights prior to re-initializing model training for each FT-PS model. Ten FT-PS models were separately trained by fine-tuning the previous model weights based on each respective patient's initial treatment plan. From these 10 patients, 26 ART treatment plans were withheld from training as the test dataset for retrospective evaluation of dose prediction performance between the AP and FT-PS models. Each AP and FT-PS dose prediction was compared against the ground truth dose distribution as originally generated during the patient's course of treatment. Mean absolute percent error (MAPE) evaluated the dose differences between a model's prediction and the ground truth.
Results: MAPE was calculated within the 10% isodose volume region of interest for each of the AP and FT-PS models dose predictions and averaged across all test adaptive sessions, yielding 5.759% and 3.747% respectively. MAPE differences were compared between AP and FT-PS models across each test session in a test of statistical significance. The differences were statistically significant in a paired t-test with two-tailed p-value equal to and 95% confidence interval (CI) equal to [-2.483, -1.542]. Furthermore, MAPE was calculated using each individually segmented structure as an ROI. Nineteen of 24 structures demonstrated statistically significant differences between the AP and FT-PS models.
Conclusion: We utilized the IDOL method to fine-tune a population-based dose prediction model into an adaptive, patient-specific model. The averaged MAPE across the test dataset was 5.759% for the population-based model versus 3.747% for the fine-tuned, patient-specific model, and the difference in MAPE between models was found to be statistically significant. Our work demonstrates the feasibility of patient-specific models in adaptive radiotherapy, and offers unique clinical benefit by utilizing initial planning data that contains the physician's treatment intent.
Keywords: adaptive; artificial intelligence; deep learning; dose prediction; fine-tuning; head and neck cancer; overfit; radiation therapy.
© 2023 The Authors. Medical Physics published by Wiley Periodicals LLC on behalf of American Association of Physicists in Medicine.
Conflict of interest statement
CONFLICTS OF INTEREST
There are no conflicts of interest to disclose.
Figures


References
-
- Barker JL Jr, Garden AS, Ang KK, et al. Quantification of volumetric and geometric changes occurring during fractionated radiotherapy for head-and-neck cancer using an integrated CT/linear accelerator system. International Journal of Radiation Oncology* Biology* Physics. 2004;59(4):960–970. - PubMed
-
- Foroudi F, Wong J, Haworth A, et al. Offline adaptive radiotherapy for bladder cancer using cone beam computed tomography. Journal of medical imaging and radiation oncology. 2009;53(2):226–233. - PubMed
-
- Sonke J-J, Aznar M, Rasch C. Adaptive radiotherapy for anatomical changes. Paper presented at: Seminars in radiation oncology 2019. - PubMed
-
- Veresezan O, Troussier I, Lacout A, et al. Adaptive radiation therapy in head and neck cancer for clinical practice: state of the art and practical challenges. Japanese journal of radiology. 2017;35:43–52. - PubMed
MeSH terms
Grants and funding
LinkOut - more resources
Full Text Sources
