Review
. 2023 Aug 1;211(3):333-342.
doi: 10.4049/jimmunol.2300141.

What's the Catch? The Significance of Catch Bonds in T Cell Activation

Affiliations
Review

What's the Catch? The Significance of Catch Bonds in T Cell Activation

Michael A Faust et al. J Immunol. .

Abstract

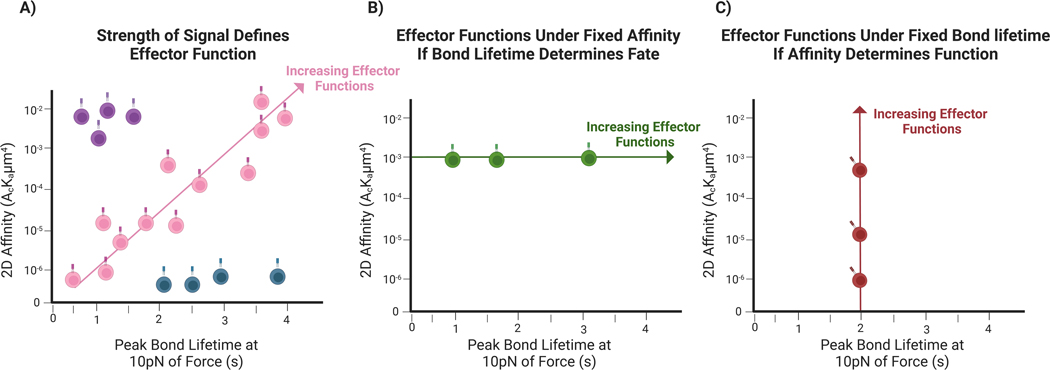
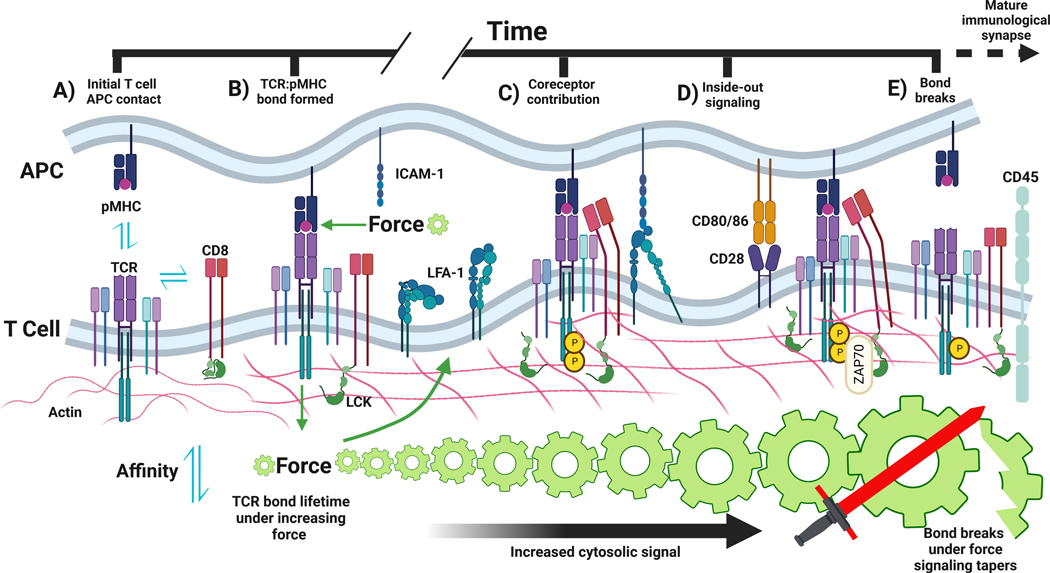
One of the main goals in T cell biology has been to investigate how TCR recognition of peptide:MHC (pMHC) determines T cell phenotype and fate. Ag recognition is required to facilitate survival, expansion, and effector function of T cells. Historically, TCR affinity for pMHC has been used as a predictor for T cell fate and responsiveness, but there have now been several examples of nonfunctional high-affinity clones and low-affinity highly functional clones. Recently, more attention has been paid to the TCR being a mechanoreceptor where the key biophysical determinant is TCR bond lifetime under force. As outlined in this review, the fundamental parameters between the TCR and pMHC that control Ag recognition and T cell triggering are affinity, bond lifetime, and the amount of force at which the peak lifetime occurs.


Conflict of interest statement

Conflict of Interest: The authors declare no conflict of interest.

Figures

Figure 1:
Figure 1:. High-affinity T cell lysis of a pMHC-coated target cell -
A splenic CD8 T cell from a C57Bl/6 mouse at peak expansion (day 8) after infection with lymphocytic choriomeningitis virus (LCMV) applies a strong pulling force against cognate pMHC. A) After confirming high affinity on 2D-MP, the T cell was manually aligned against a human RBC artificially coated with gp33:H2-Db. B) After two minutes, a significant morphological change is observed in the T cell as it samples antigen. C) After only four minutes, the CD8 T cell pulls the RBC from the opposing pipette and lyses the RBC, indicated by the translucency of the RBC.
Figure 2:
Figure 2:. Force magnitude, peak bond lifetime, and affinity may be indicative of T cell effector function -
A) Schematic of correlation between peak bond lifetime at 10 pN of force and TCR effective 2D affinity. Pink line predicts increasing strength of signal and optimal effector functions as it moves to the upper right quadrant of the graph. Thus, TCRs can potentially be categorized into strong and weak agonists. This pink line indicates when bond lifetime and affinity are in lock step with one another in determining functionality. Although affinity and bond lifetime are often paired together there are instances where they do not. In these cases, it is hard to predict T cell functionality biased solely on affinity. For example, there are outlier TCRs (blue lower right quadrant) that may be highly responsive. These TCRs are low affinity but have a higher bond lifetime and may be more indicative of a TCR that is highly autoreactive. Overall, the issue with affinity prediction alone for T cell functionality is that low affinity cells are often present and highly functional with a strong strength of signal. Additional outlier TCRs, that are high affinity TCRs with a weak strength of signal and limited functionality are also commonly found. We posit that bond lifetime and ability to form catch bonds under force is a better predictor of TCR mediated responsiveness in T cells. Essentially, if there was a third axis which represents T cell function, it would more tightly correlate with bond lifetime but rather than affinity. Although affinity, bond lifetime and force magnitude are typically correlated to one another, it is possible that TCRs of similar affinity can have drastically different bond lifetime/strength projecting different T cell effector responses. For example, in B) the green line represents T cells with the same level of affinity but varying bond lifetimes at 10pN of force. In this case longer intact TCR:pMHC bonds correspond with increased effector function. This graph illustrates that in theory the best way to test the effects of bond lifetime under force is to decuple it from affinity, by fixing affinity. Based on current research discussed further in this review it is more likely TCR bond lifetime that predicts projected T cell effector function following activation.
Figure 3:
Figure 3:. TCR:pMHC bond lifetime under force -
A) As an APC and a T cell approach during T cell antigen recognition pMHC and TCR are confined to the dynamic 2D environment of the plasma membrane. Affinity is what initially mediates the likelihood of a TCR:pMHC bond formation, however, after the bond is B) formed force is immediately exerted on the bond. The forces applied on the TCR:pMHC bond are in part due to the fluid motion of the plasma membrane and cytoskeleton application of inward tension. Force in this figure is denoted by green gears, increasing in magnitude for the duration the bond remains intact. C) Shortly after the TCR:pMHC bond is formed coreceptor binds MHC creating a trimolecular interaction facilitating the cytosolic phosphorylation of ITAMs by LCK. D) Prolonged bond lifetime under increased force propels a positive feedback loop that further transduces strength of signal by Zap70 and other molecules downstream of the TCR. This in turn modulates and creates a stronger TCR:pMHC bond and is known as inside-out signaling. Costimulation (CD28) and other adhesion molecules such as LFA-1 bind and further propagate the formation of the immunological synapse and full activation of the T cell although exact timing is unclear. When the synapse is fully mature larger inhibitory molecules such as CD45 are confined to the peripheral supra intramolecular cluster. In addition, it is clear that PD-1 may interact with TCR:pMHC and augment or inhibit signaling. E) the bond lifetime comes to an end and the bond breaks either due to the amplified forces that can no longer be maintained by the TCR:pMHC bond or the bond lifetime comes to an end. The pMHC then may rebind the same TCR, bind a new TCR or be pulled off the membrane by TCR known as trogocytosis.

Similar articles

Cited by

References

    1. Kane LP, Lin J, and Weiss A. 2000. Signal transduction by the TCR for antigen. Curr Opin Immunol 12: 242–249. - PubMed
    1. Huppa JB, Axmann M, Mortelmaier MA, Lillemeier BF, Newell EW, Brameshuber M, Klein LO, Schutz GJ, and Davis MM. 2010. TCR-peptide-MHC interactions in situ show accelerated kinetics and increased affinity. Nature 463: 963–967. - PMC - PubMed
    1. Huang J, Zarnitsyna VI, Liu B, Edwards LJ, Jiang N, Evavold BD, and Zhu C. 2010. The kinetics of two-dimensional TCR and pMHC interactions determine T-cell responsiveness. Nature 464: 932–936. - PMC - PubMed
    1. Kim ST, Takeuchi K, Sun ZY, Touma M, Castro CE, Fahmy A, Lang MJ, Wagner G, and Reinherz EL. 2009. The alphabeta T cell receptor is an anisotropic mechanosensor. J Biol Chem 284: 31028–31037. - PMC - PubMed
    1. Liu B, Chen W, Evavold BD, and Zhu C. 2014. Accumulation of dynamic catch bonds between TCR and agonist peptide-MHC triggers T cell signaling. Cell 157: 357–368. - PMC - PubMed

Publication types

Substances