Randomized Controlled Trial
. 2023 Jul 17;18(7):e0288201.
doi: 10.1371/journal.pone.0288201. eCollection 2023.

Gamified assessment of cognitive performance during moderate hypoxia

Affiliations
Randomized Controlled Trial

Gamified assessment of cognitive performance during moderate hypoxia

Jason M Keeler et al. PLoS One. .

Abstract

Introduction: There is a need for rapid and objective assessment tools to identify people at risk of impaired cognitive function during hypoxia.

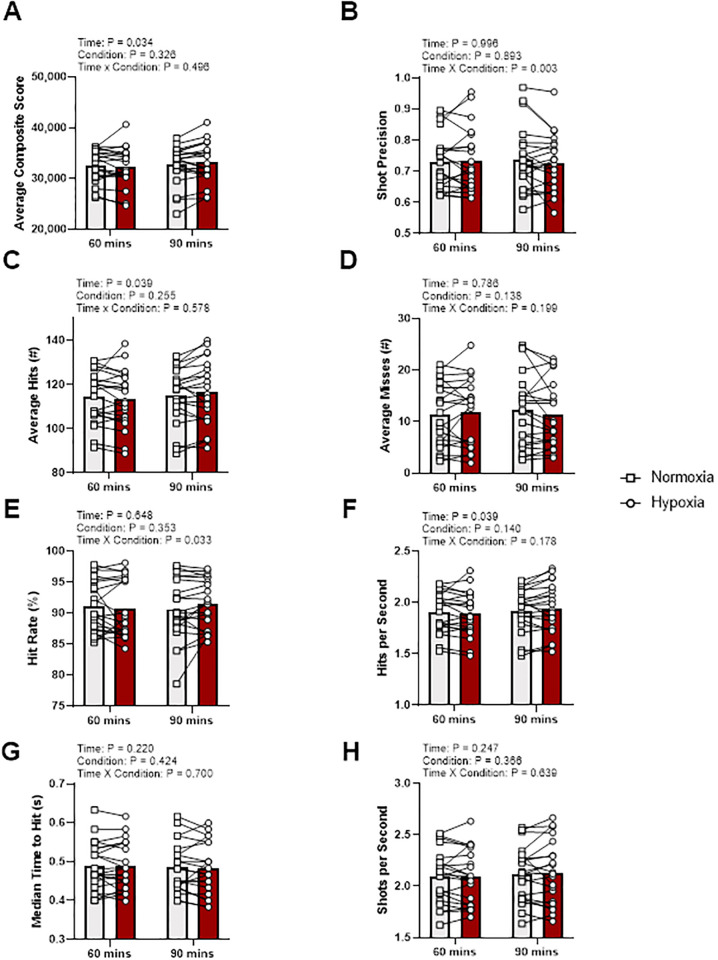
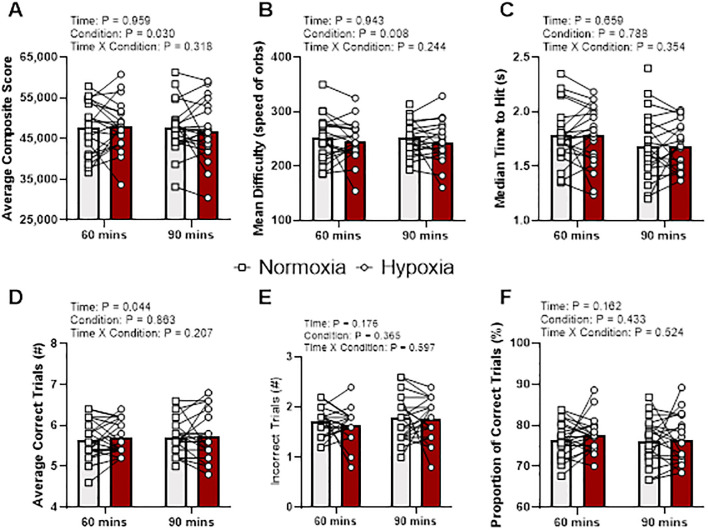
Purpose: To test the hypotheses that performance on gamified cognitive tests examining the cognitive domains of executive function (Gridshot), working memory (Capacity) and spatial tracking (Multitracker) will be reduced during normobaric exposure to moderate normobaric hypoxia.

Methods: Following three consecutive days of practice, twenty-one healthy adults (27 ± 5 y, 9 females) completed five 1-min rounds of the tablet-based games Gridshot, Capacity, and Multitracker (Statespace Labs, Inc.) at Baseline and 60 and 90 min after exposure to 14.0 ± 0.2% (hypoxia) and 20.6 ± 0.3% (normoxia) oxygen. Both conditions were completed on the same day and were administered in a single-blind, block randomized manner. Arterial oxyhemoglobin saturation was estimated via forehead pulse oximetry (SpO2). Data were analyzed using ANCOVA with a covariate of Baseline.

Results: Compared to normoxia (98 ± 1%), SpO2 was lower (p < 0.001) at 60 (91 ± 3%) and 90 (91 ± 2%) min of hypoxia. No condition x time interaction effects were identified for any gamified cognitive tests (p ≥ 0.32). A main effect of condition was identified for Capacity (p = 0.05) and Multitracker (p = 0.04), but not Gridshot (p = 0.33). Post hoc analyses of the composite scores for both Capacity (p = 0.11) and Multitracker (p = 0.73) demonstrated no difference between conditions.

Conclusion: Performance on gamified cognitive tests was not consistently affected by acute normobaric moderate hypoxic exposure.


Conflict of interest statement

I have read the journal’s policy and the authors of this manuscript have the following competing interests: JL is employed by Statespace Labs. DH is a paid consultant for Statespace Labs. ZLS and NLP received funding from Statespace Labs for this work. " This does not alter our adherence to PLOS ONE policies on sharing data and materials.

Figures

Fig 1
Fig 1. Visit 2: Experimental day timeline.
Following baseline measures of body mass, heart rate, and arterial oxygen saturation, participants completed the baseline bout of gamified cognitive tests. Then participants sat in a chair in the environmental chamber and were allowed to watch a documentary between bouts of gamified cognitive tests. The environmental chamber was then set to a hypoxic (FiO2 = 14%) or normoxic (FiO2 = 21%) environment. During the hypoxic condition, participants would enter the environmental chamber at a FiO2 of 21%. Then the oxygen content in the room would be decreased over the first 30 min until it reached a stable FiO2 of 14%. Participants were blinded to order of exposure. The gamified cognitive test bouts were completed after 60 min of exposure to hypoxia or normoxia and again after 90 min of exposure. Following the 90 min assessment, participants were given a 5 min bathroom break and then reentered the chamber. The FiO2 in the calorimeter was changed to the opposite environmental condition. Again, participants completed the gamified cognitive test bouts after 60 min of exposure to the experimental conditions and again after 90 min of exposure. All participant data was upload to the cloud and participants were free to leave the lab.
Fig 2
Fig 2. Gridshot output variables at 60 and 90 min during normoxia and hypoxia.
Gray bars represents normoxia trials and red bars represent hypoxia trials. Data presented as means with individual responses (n = 21). P-values presented from F-tests for main effects and interaction from two-way repeated measures ANCOVA with baseline values serving as the covariate. (A) Composite score: Average composite score per round. (B) Shot precision: Average distance from target center. (C) Average hits: Average hits per round. (D) Average misses: Average misses per round. (E) Hit rate: Percentage of hits to total shots. (F) Hits per second: Average number of hits in one second. (G) Median time to hit: Average median time between two consecutive hits. (H) Shots per second: Average number of shots made per second.
Fig 3
Fig 3. Capacity output variables at 60 and 90 min during normoxia and hypoxia.
Gray bars represents normoxia trials and red bars represent hypoxia trials. Data presented as means with individual responses (n = 21). P-values presented from F-tests for main effects and interaction from two-way repeated measures ANCOVA with baseline values serving as the covariate. (A) Composite score: Average composite score per round. (B) Mean difficulty: Average difficulty during a round. (C) Median time to hit: Average median time between two consecutive hits. (D) Average Correct Trials: Average number of correct trials per round. (E) Average Incorrect Trials: Average number of incorrect trials per round. (F) Proportion of Correct Trials: Average percentage of correct trials within a round.
Fig 4
Fig 4. Multitracker output variables at 60 and 90 min during normoxia and hypoxia.
Gray bars represents normoxia trials and red bars represent hypoxia trials. Data presented as means with individual responses (n = 21). P-values presented from F-tests for main effects and interaction from two-way repeated measures ANCOVA with baseline values serving as the covariate. (A) Composite score: Average composite score per round. (B) Mean difficulty: Average difficulty during a round. (C) Median time to hit: Average median time between two consecutive hits. (D) Average Correct Trials: Average number of correct trials per round. (E) Average Incorrect Trials: Average number of incorrect trials per round. (F) Proportion of Correct Trials: Average percentage of correct trials within a round.

References

    1. McMorris T, Hale BJ, Barwood M, Costello J, Corbett J. Effect of acute hypoxia on cognition: A systematic review and meta-regression analysis. Neuroscience & Biobehavioral Reviews. 2017;74: 225–232. doi: 10.1016/j.neubiorev.2017.01.019 - DOI - PubMed
    1. Shaw DM, Cabre G, Gant N. Hypoxic Hypoxia and Brain Function in Military Aviation: Basic Physiology and Applied Perspectives. Front Physiol. 2021;12: 665821. doi: 10.3389/fphys.2021.665821 - DOI - PMC - PubMed
    1. Taylor L, Watkins SL, Marshall H, Dascombe BJ, Foster J. The Impact of Different Environmental Conditions on Cognitive Function: A Focused Review. Front Physiol. 2016;0. doi: 10.3389/fphys.2015.00372 - DOI - PMC - PubMed
    1. Ernsting J. The effect of brief profound hypoxia upon the arterial and venous oxygen tensions in man. The Journal of Physiology. 1963;169: 292–311. doi: 10.1113/jphysiol.1963.sp007257 - DOI - PMC - PubMed
    1. Virués-Ortega J, Buela-Casal G, Garrido E, Alcázar B. Neuropsychological Functioning Associated with High-Altitude Exposure. Neuropsychol Rev. 2004;14: 197–224. doi: 10.1007/s11065-004-8159-4 - DOI - PubMed

Publication types