. 2023 Nov;19(11):2912-2933.
doi: 10.1080/15548627.2023.2234799. Epub 2023 Jul 17.

Analysis of ATG4C function in vivo

Affiliations

Analysis of ATG4C function in vivo

Isaac Tamargo-Gómez et al. Autophagy. 2023 Nov.

Abstract

ATG4 (autophagy related 4 cysteine peptidase); ATG4A (autophagy related 4A cysteine peptidase); ATG4B (autophagy related 4B cysteine peptidase); ATG4C (autophagy related 4C cysteine peptidase); ATG4D (autophagy related 4D cysteine peptidase); Atg8 (autophagy related 8); GABARAP (GABA type A receptor-associated protein); GABARAPL1(GABA type A receptor-associated protein like 1); GABARAPL2 (GABA type A receptor-associated protein like 2); MAP1LC3A/LC3A (microtubule associated protein 1 light chain 3 alpha); MAP1LC3B/LC3B (microtubule associated protein 1 light chain 3 beta); mATG8 (mammalian Atg8); PE (phosphatidylethanolamine); PS (phosphatydylserine); SQSTM1/p62 (sequestosome 1).

Keywords: Animal models; GABARAP; LC3; autophagy; fibrosarcoma; lymphocyte.


Conflict of interest statement

No potential conflict of interest was reported by the authors.

Figures
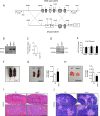
Figure 1.
Figure 1.
Generation and characterization of atg4c-deficient mice. (A) Up, schematic representation of the WT Atg4c locus, with coding exons represented as numbered boxes. Bottom, schematic representation of the mutant allele, showing the insertion of a PGK-Neo cassette between 1 and exon 4, disrupting the transcription of the gene. (B) PCR analysis of genomic DNA from WT, heterozygous and atg4c-null mice. (C) Real-time PCR analysis of RNA of heart tissue from control and atg4c-/-animals showing the absence of full-length Atg4c mRNA expression in knockout mice. (D) Representative immunoblots of ATG4C protein in extracts of brain tissue from control and atg4c-/-animals showing the absence of the protein in mutant mice. (E) Real time PCR analysis of RNA of liver tissue from control and atg4c-/- animals showing the compensation of each ATG4 at the level of mRNA expression in knockout mice. (F) Representative images of wild-type and atg4c-/- mice. (G) Left, representative images of spleens from WT and mutant mice. Right, quantification of the data. (H) Left, representative images of thymus from WT and mutant mice. Right, quantification of the data. Scale bars: 1 cm. Bars represent means ± SEM. (C) and (E), n = 6 mice per genotype. G and H, n = 8 mice per genotype. *P < 0.05, 2-tailed unpaired student’s t test. (I-J) Representative light microscopy images of H&E-stained spleens (I) and thymi (F) from WT and mutant mice. n = 4 mice per genotype. Spleens; scale bar: 100 μm. Thymus; scale bar: 200 μm.
Figure 2.
Figure 2.
Autophagy flux analysis in atg4c-/- MEFs. (A) Representative immunoblots against mATG8 proteins in WT and atg4c-/- MEFs. β-actin was used as sample processing controls. Torin1 was used as autophagy inducer and BafA1 was used to inhibit lysosomal degradation of mATG8-membrane bound forms. (B) Representative immunofluorescence images of endogenous mAtg8s in WT and knockout MEFs. Cells were cultured in full medium as a control, torin1 and BafA1 were used in the same conditions that in western blot analysis. Scale bars: 10 µm. (C) Quantification of the data shown in (B). Bars represent means ± SEM. N > 85 cells per genotype and condition. *P < 0.05, 2-tailed unpaired student’s t test. (D) Left, long-lived protein degradation rates were determined in WT and atg4c-/- MEFs cultured in nutrient-rich, complete medium (CM) plus vehicle control (CM+DMSO) or exposed to amino acid starvation (EBSS) for 4 h in the absence or presence of BafA1. Bars represent means ± SEM (N = 3 independent experiments). Right, BafA1-sensitive degradation of long-lived proteins in WT and atg4c-/- MEFs exposed to amino acid starvation for 4 h. The BafA1-sensitive degradation rates (indicating lysosomal LLPD) were calculated by subtracting the degradation rate measured in BafA1-treated cells, from that measured in DMSO vehicle control-treated cells. Bars represent means ± SEM (N = 3 independent experiments). *P < 0.05, 2-tailed paired student’s t test.
Figure 3.
Figure 3.
Autophagy flux analysis in atg4c-/- mice. Immunoblotting analyses against mATG8 proteins in diaphragm (A), brain (B), spleen (C), heart (D), skeletal muscle (E) and liver (F) tissue extracts from WT and atg4c-/- mice either under fed ad libitum or after 24 h of fasting, in the presence or absence of leupeptin. ACTB/β-actin was used as sample processing controls. N = 3 mice per genotype and condition.
Figure 5.
Figure 5.
Analysis of diaphragm alterations in atg4c-deficient mice. (A) Left, quantification of respiratory frequency in fed and fasted WT and atg4c-null mice. Right, effect of fasting in ventilation rate as measured as % of the average values when mice are fed ad libitum (A). N = 7 WT and 6 atg4c-/- mice (B) Immunoblotting analyses against PRKAA/AMPK protein in diaphragm tissue extracts from WT and atg4c-/- mice either fed ad libitum and upon 24 h of fasting. (C) Densitometry of immunoblots in Figure 6B. Bars represent means ± SEM. (N = 3 mice per genotype and condition). *P < 0.05, 2-tailed unpaired Student’s t-test. (D) Representative images of ATPase-stained diaphragm sections. Serial sections of the diaphragm from a WT and atg4c-/- mice are shown. For ATPase activity, after a pre-incubation at pH 4.6, type I fibers stain dark (*), type IIa fibers stain intermediate (#) and type IIb fibers stain pale (&). (E) Quantification of data shown in (C). The distribution and cross-sectional area (μm2) of individual fiber types were determined for ~ 100 fibers per transverse section of diaphragm from all animals in each group (n = 3 per group). Scale bars: 100 µm. p-values were determined by unpaired student´s t-test, *p < 0.05.
Figure 4.
Figure 4.
Analysis of locomotor activity, respiration and energy expenditure in WT and atg4c-deficient mice. (A). Left, locomotor activity in fed WT and atg4c-null mice during light phase (day) and dark phase (night). Right, graph depicting the area under the curves of locomotor activity chart in each genotype. (B) Equivalent analyses than in (A) after 24 h of fasting, during dark phase. (C) Graph depicting the area under the curves of locomotor activity chart in each genotype during light phase upon fed and fasted regimen. D-E) Analyses of O2 consumption (mL/Kg/h) for the conditions shown in (A and B). (F) Graph depicting the area under the curves of O2 consumption in each genotype during light phase upon fed and fasted regimen. (G and H) Analyses of CO2 production (mL/Kg/h) for the conditions shown in (A and B). (I) Graph depicting the area under the curves of CO2 consumption in each genotype during light phase upon fed and fasted regimen. (J and K) Analyses of energy expenditure (Kcal/Kg/h) for the conditions shown in (A and B). (L) Graph depicting the area under the curves of energy expenditure in each genotype during light phase upon fed and fasting conditions. (M and N) Analyses of respiratory exchange ratio (RER) for the conditions shown in (A and B). O) Graph depicting the area under the curves of RER in each genotype during light phase upon fed and fasted regimen. Data represent mean ± SEM. *p < 0.05. n = 8 WT and 7 mutant mice upon fed regimen and n = 6 mice per genotype upon fasted regimen.
Figure 6.
Figure 6.
atg4c/- mice show alterations in lymphocyte populations. (A and B) Analysis of the expression of each ATG4 in different tissues (A) an in several white cells subpopulations (B) from human samples. Data obtained from https://www.proteinatlas.org. (C) Cell counts of peripheral blood from WT and atg4c-/- mice. Gra, granulocytes; Lym, lymphocyte; Plt, platelet; RBC, red blood cells. N = 8 mice per genotype. Bars represent means ± SEM. (D) Representative FACs analyses of CD19 and CD3 expression in peripheral blood cells from WT and mutant mice. (E) Quantification of CD19+, NK+, CD3+ and CD8+ and CD3 and CD8 subpopulations in blood from WT and atg4c-deficient mice. N = 6 per genotype. Bars represent means ± SEM. (F) Representative images of immunofluorescence analysis of endogenous mATG8 proteins in lymphocytes subpopulation from WT and atg4c-/- mice upon the indicated conditions. Scale bars: 8 μm. (G) Quantification of the data shown in (F). Bars represent means ± SEM. N > 85 cells per genotype and condition. (H) Representative images of immunofluorescence against the endogenous mATG8 proteins in spleen sections from WT and atg4c-/- mice. Scale bars: 10 µm (I) Quantification of the data shown in H. Bars represent means ± SEM. N = 4 mice per genotype. (J) Left, representative images of TUNEL assay in spleen sections from WT and atg4c-/- mice. Right, quantification of the positive nuclei for TUNEL assay per tissue area in WT and atg4c-/- mice. Bars represent means ± SEM. N = 6 mice per genotype. (K) Left, percentage of mice with tumors upon MCA administration. N = 8 mice per genotype. Right, quantification of tumor size from WT and atg4c-/- mice. (L) Left, representative images of immunohistochemistry against CD3 in tumors generated after MCA injection. Scale bars: 200 µm. Right, quantification of the data. Bars represent means ± SEM. N = 4 mice per genotype. (M) Up, representative images of H&E-stained tumor sections from WT and atg4c-/- tumors. Scale bars: 400 µm. Bottom, representative images of gomori-stained tissue sections from WT and atg4c-/-tumors. Scale bars: 400 µm. *P < 0.05, 2-tailed unpaired student’s t test.
Figure 7.
Figure 7.
Autophagy analyses in atg4c atg4d DKO cells and mice. (A) Immunoblotting analyses against mATG8 proteins in heart, liver and muscle tissues from WT, atg4d−/− and atg4c atg4d DKO mice under basal conditions and upon 24 h of fasting. ACTB/β-actin was used as sample processing controls. (B) Autophagic flux analyses in WT, atg4d-/-, atg4c-/- and atg4c atg4d DKO MEFS cultured in rich medium (control) of starved during 4 h either in the presence or absence of bafilomycin A1.
Figure 8.
Figure 8.
Combined deficiency of Atg4c and Atg4c leads to increased defects in LC3B delipidation than those present in atg4d-/- cells. (A) schematic representation of the different possible autophagosome-related structures containing mKeima-LC3B. (B) Representative images for MEFs stably expressing Keima-LC3B, cultured in the indicated conditions (Starvation stands for serum and amino-acids starvation: EBSS for 3 h) (C) Representative images showing the fluorescence intensity ratio from both mKeima-LC3B signals (E x 586-Em620)/(Ex440-Em620). Scale bars: 10 μm, 3 μm in insets. (D) Quantification of mKeima-LC3B ratio from (E x 586-Em620)/(Ex440-Em620) signals. Each point value represents the average ratio of mKeima-LC3B positive structures of a single cell. n ≥ 60 cells per genotype and treatment. (E) Schematic strategy of the SNAP-tag®/LC3B assay developed to specifically monitor LC3B present at the cytosolic leaflet of the autolysosomal membrane. Right, schematic representation of the expected results for either normal or defective LC3 delipidation. (F) Representative pictures of MEFs stably expressing SNAP-PhosSTOP™/LC3B and double-stained with MIL (green) and Alexa Fluor 594®-conjugated anti-LAMP1 antibody (red) in the indicated conditions. Graphs show intensity profiles for fluorescent signals along the direction indicated in the insets (a-w). Scale bars: 10 μm. (G) quantification of the data depicted in (F). The percentage of LAMP1-positive dots which are also positive for MIL labeling is shown. Measurements were done with more than 45 cells per genotype and treatment. p-values were determined by unpaired student´s t-test, *p < 0.05.
Figure 9.
Figure 9.
Sequence and phylogenetic analyses of ATG4 proteins. (A) Amino acid sequence of yeast, D. melanogaster, C. elegans, human and mouse ATG4 proteins. The multiple alignment was performed with the ClustalX program. Gaps are indicated by hyphens. The analysis of the alignment was performed with jalview (version 2.2). Coloring was applied according to both amino-acid identity percentage and conservation (threshold value = 7.5). Amino-acids highlighted in red represent conserved residues with 100% of identity among all depicted species. Amino-acids highlighted in orange represent residues with a high degree of similarity involving only conservative substitutions. Amino-acids highlighted in yellow show residues in which a high degree of similarity is found, even when non-conservative substitutions occur in some species. Dark blue and dark green represent residues with 100% of identity in the ATG4AB and ATG4C ATG4D subfamilies, respectively. Light blue and light green represent residues which high degree of conservation (involving only conservative substitutions) in the ATG4AB and ATG4C ATG4D subfamilies, respectively. (B) Phylogenetic tree of the ATG4 family. Amino acid sequences of the different A. thaliana, C. elegans, D. melanogaster, human and mouse ATG4 proteins were aligned using the Phylip program package (version 3.6). Numbers represent reliability values after bootstrapping the data. Percentage of identity between the different ATG4s members: ATG4A vs ATG4B: 57%; ATG4A vs ATG4C: 30%; ATG4A vs ATG4D: 32.76%; ATG4B vs ATG4C: 28.38%; ATG4B vs ATG4D: 30.73 and ATG4C vs ATG4D: 46.39%.

References

    1. Deretic V, Saitoh T, Akira S.. Autophagy in infection, inflammation and immunity. Nat Rev Immunol. 2013. Oct;13(10):722–737. doi: 10.1038/nri3532 - DOI - PMC - PubMed
    1. Rubinsztein DC, Marino G, Kroemer G. Autophagy and aging. Cell. 2011. Sep 2;146(5):682–695. - PubMed
    1. Levine B, Kroemer G. Biological functions of autophagy genes: a disease perspective. Cell. 2019. Jan 10;176(1–2):11–42. - PMC - PubMed
    1. Klionsky DJ, Abdelmohsen K, Abe A, et al. Guidelines for the use and interpretation of assays for monitoring autophagy (3rd edition). Autophagy. 2016;12(1):1–222. doi: 10.1080/15548627.2015.1100356 - DOI - PMC - PubMed
    1. Ichimura Y, Kirisako T, Takao T, et al. A ubiquitin-like system mediates protein lipidation. Nature. 2000. Nov 23;408(6811):488–492. - PubMed

Publication types