. 2023 Jul 25;120(30):e2301538120.
doi: 10.1073/pnas.2301538120. Epub 2023 Jul 17.

Immunization with lytic polysaccharide monooxygenase CbpD induces protective immunity against Pseudomonas aeruginosa pneumonia

Affiliations

Immunization with lytic polysaccharide monooxygenase CbpD induces protective immunity against Pseudomonas aeruginosa pneumonia

Fatemeh Askarian et al. Proc Natl Acad Sci U S A. .

Abstract

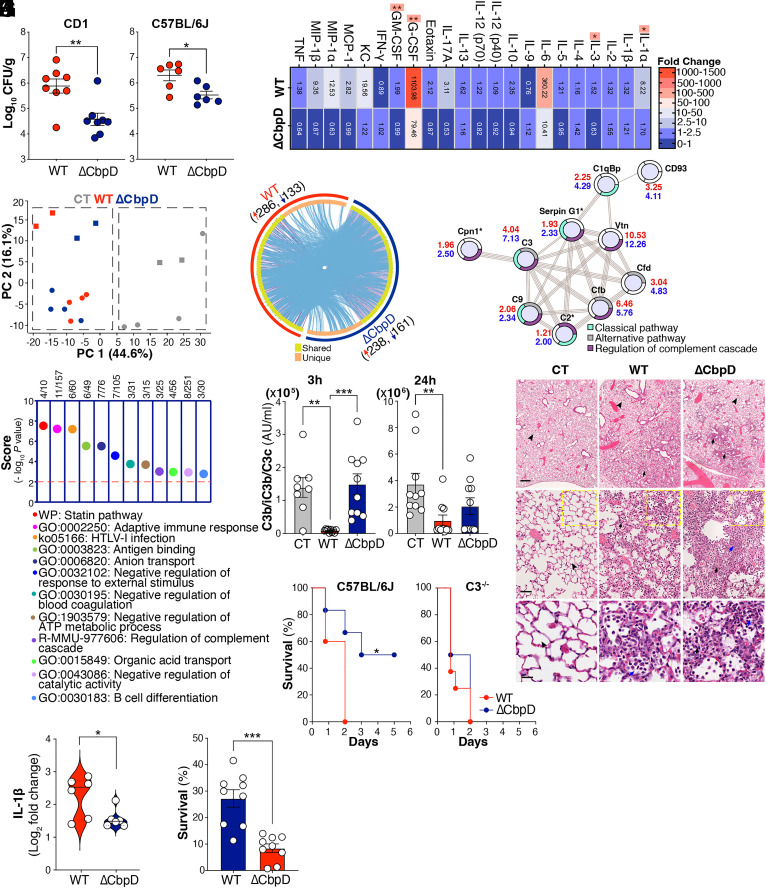
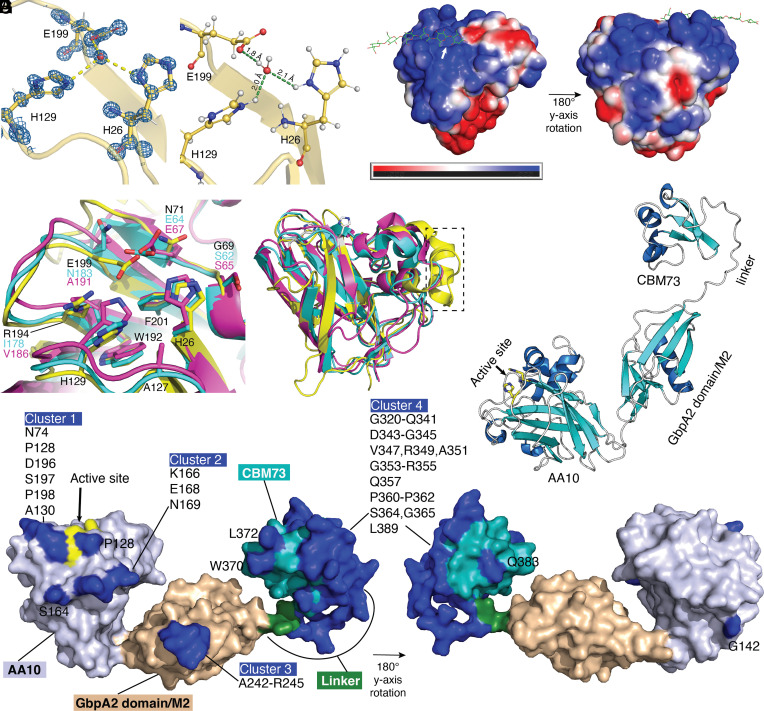
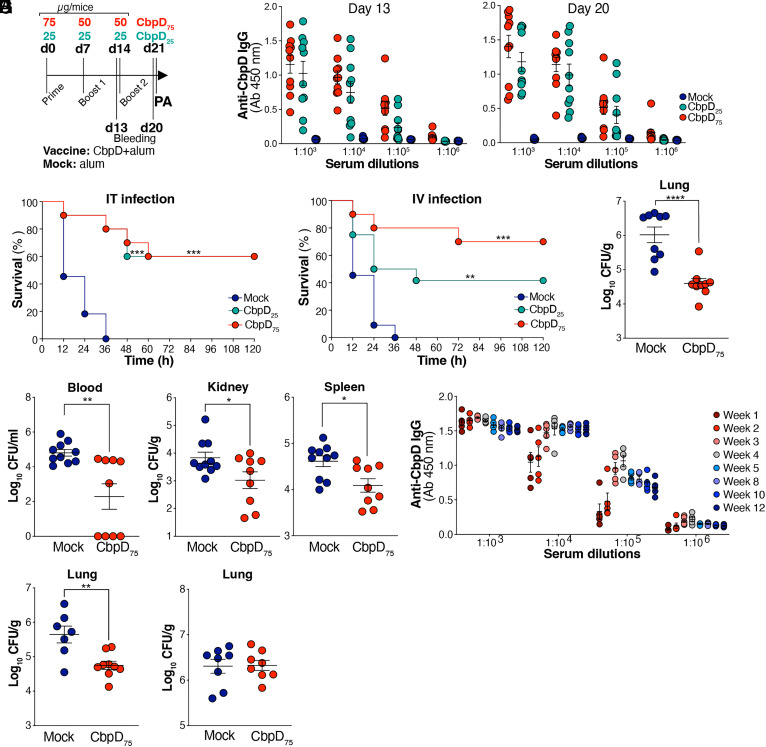
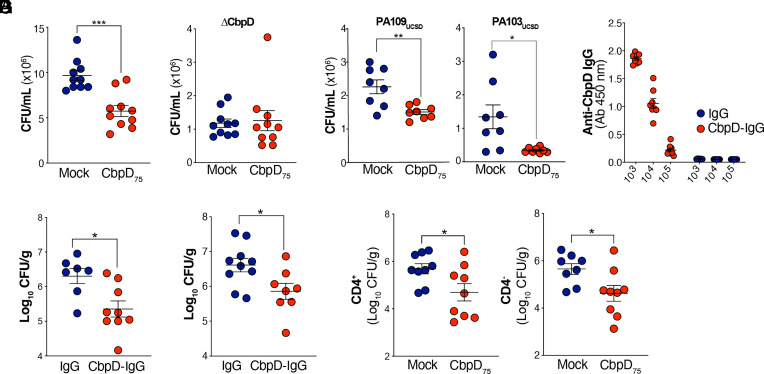
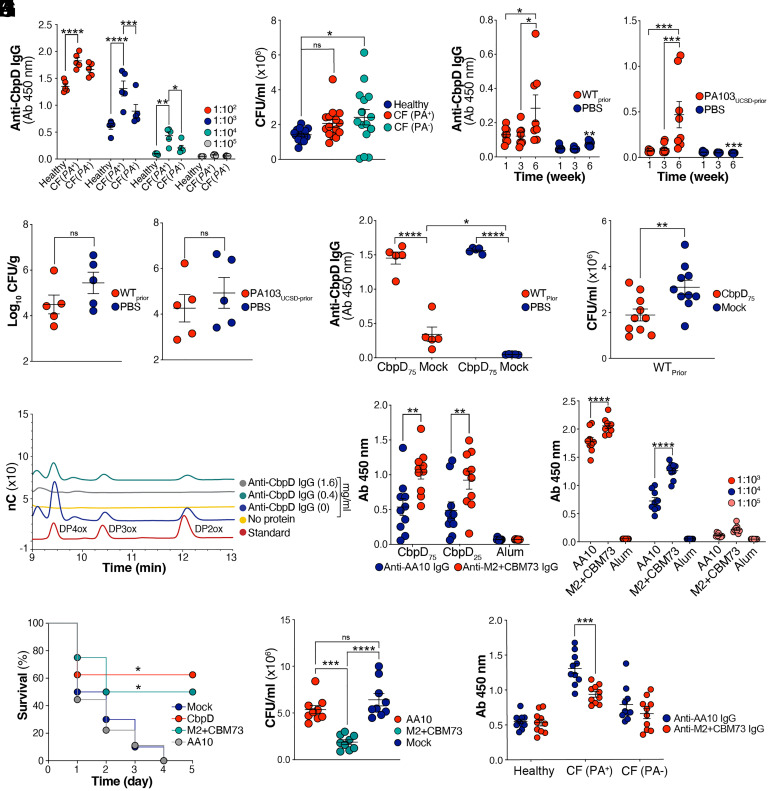
Pseudomonas aeruginosa (PA) CbpD belongs to the lytic polysaccharide monooxygenases (LPMOs), a family of enzymes that cleave chitin or related polysaccharides. Here, we demonstrate a virulence role of CbpD in PA pneumonia linked to impairment of host complement function and opsonophagocytic clearance. Following intratracheal challenge, a PA ΔCbpD mutant was more easily cleared and produced less mortality than the wild-type parent strain. The x-ray crystal structure of the CbpD LPMO domain was solved to subatomic resolution (0.75Å) and its two additional domains modeled by small-angle X-ray scattering and Alphafold2 machine-learning algorithms, allowing structure-based immune epitope mapping. Immunization of naive mice with recombinant CbpD generated high IgG antibody titers that promoted human neutrophil opsonophagocytic killing, neutralized enzymatic activity, and protected against lethal PA pneumonia and sepsis. IgG antibodies generated against full-length CbpD or its noncatalytic M2+CBM73 domains were opsonic and protective, even in previously PA-exposed mice, while antibodies targeting the AA10 domain were not. Preexisting antibodies in PA-colonized cystic fibrosis patients primarily target the CbpD AA10 catalytic domain. Further exploration of LPMO family proteins, present across many clinically important and antibiotic-resistant human pathogens, may yield novel and effective vaccine antigens.

Keywords: crystallography; mouse models; plytic polysaccharide monooxygenase; pneumonia; vaccine antigen.


Conflict of interest statement

The authors declare no competing interest.

Figures

Fig. 1.
Fig. 1.
CbpD virulence role in a murine pneumonia model. (A) Female CD-1 and C57BL/6J mice were inoculated IT with 1×10⁶ CFU PA WT or ΔCbpD per mouse. Bacterial loads in the lung (CFU/g) were enumerated 24 h postinfection. Data are plotted as the mean ± SEM, representing 8 (CD-1) and 6 (C57BL/6J) mice per group, and were analyzed by the two-tailed t test (CD-1: P = 0.0030; C57BL/6J: P = 0.0143). (B) Categorical heatmap of cytokines, chemokines, and growth factors in the serum of CD-1 mouse 24 h post IT infection (as described in A). The samples were examined using the Bio-Plex ProTM mouse cytokine assay. Data depict mean fold-change of the cytokine values in WT- or ΔCbpD-infected relative to mock-infected mice (10 mice/group). The data were analyzed by the multiple unpaired t test and the FDR-adjusted P value (or q value) was determined using the two-stage step-up method of Benjamini, Krieger, and Yekutieli. Significant differences between WT and ΔCbpD are indicated by asterisks (*). IL-1α: q = 0.0181, IL-3: q = 0.0181, G-CSF: q = 0.0052, GM-CSF: q = 0.0054. (C) Principal component analysis (PCA) of identified proteins showing segregation of lung proteomes into infected (WT and ΔCbpD) and uninfected groups; quantified proteins are plotted in two-dimensional principal component space by PC1= 44.6% and PC2= 16.1%. Each circle represents one mouse/biological replicate. One mouse sample per treatment was utilized as a technical replicate for each TMT group and depicted using square (n = 5 mice/group) (D) Dimension and overlap of differentially expressed proteins (π score ≥ 2) in the lung proteome of WT (red arc)- and ΔCbpD (dark blue arc)-infected relative to mock-infected mice. The dark orange arc and purple lines reflect the regulated proteins shared in both datasets; light orange color represents regulated proteins unique to WT and ΔCbpD-infected vs. control mice; blue lines indicate the ontology term overlap among the significantly regulated proteins; plot generated with Metascape. (E) Dot plot of enrichment score (−log10 P value ≥ 2) showing pathways and cellular processes enriched in the lung proteome (Dataset S4) of ΔCbpD-infected mice. Enrichment analysis was performed using the list of up-regulated proteins belonging to the unique category by Metascape; the P value was calculated based on cumulative hypergeometric distribution. (F) STRING network analysis showing connection of regulated proteins (π score ≥ 2) associated with complement activation in the lung proteome of WT- and/or ΔCbpD-infected mice vs. control (Datasets S2–S4). The π score values are depicted next to the nodes in red (WT) and blue (ΔCbpD). Regulated proteins unique to ΔCbpD-infected versus control mice are marked with asterisks. Proteins without any interaction partners within the network are omitted from the graphics. GO:0006958: Complement activation, classical pathway (cyan), GO:0006957: Complement activation, alternative pathway (gray), MMU:977606: Regulation of complement cascade (purple). (G) Quantification of soluble complement factor C3b in EDTA-treated murine blood 3 h and 24 h post IT infection with WT or ΔCbpD (as described in A); mock (PBS)-infected mice included as control (CT). Results are given in complement arbitrary units (AU) per mL; data are plotted as mean ± SEM, representing 10 CD-1 mice/group. Data were analyzed by two-way ANOVA (Tukey’s multiple comparisons). (Left) (3 h) CT vs WT: P = 0.0025, CT vs. ΔCbpD: P = 0.9893, WT vs. ΔCbpD: P = 0.0009; (Right) (24 h) CT vs. WT: P = 0.0075, CT vs. ΔCbpD: P = 0.1162, WT vs. ΔCbpD: P = 0.3876. (H) Wild-type C57BL/6J (n = 5 to 6 mice/group) and C3 knock-out (C3−/−) mice (n = 8 mice/group) were inoculated IT with 3×10⁶ CFU PA WT or ΔCbpD per mouse. Survival is represented by Kaplan–Meier survival curves and was analyzed with the log-rank (Mantel–Cox) test. (Left): P = 0.0445, (Right): P = 0.3464. (I) Representative hematoxylin and eosin–stained sections of spleen tissues from infected (WT or ΔCbpD) and uninfected mice (n = 5 mice/group) were collected 24 h post IT infection (as described in A), analyzed by light microscopy. Arrowheads indicate normal alveolar structure characterized by patent airspaces lined by a thin border of alveolar epithelium with no inflammatory cells. Arrows show areas of the lung with an infiltration of neutrophils (black) and macrophages (blue) in the alveoli and the interstitium leading to loss of the pulmonary surface. (The scale bar represents 500, 50, and 20 µm in the Upper, Middle, and Lower, respectively.) (J) Mean fold change values of IL-1β in the lung proteome of ΔCbpD and WT infected compared to mock-infected (control) mice (as described in A); data are plotted as the mean (log2 fold change) ± SEM, representing 5 CD-1 mice/group (one mouse sample/treatment was utilized as technical replicate in each TMT group) and analyzed by the two-tailed t test. P = 0.004. (K) Survival of PA WT and ΔCbpD upon incubation with freshly isolated human neutrophils. Bacterial survival was calculated relative to inoculum in percentage (%). Data are plotted as the mean ± SEM, representing three experiments performed in triplicate, and analyzed by the two-tailed t test (P = 0.0001). Each data point represents an individual mouse, and the significant differences are marked with asterisks (*): *P ≤ 0.05; **P ≤ 0.01; ***P ≤ 0.001; ****P ≤ 0.0001.
Fig. 2.
Fig. 2.
Structural analysis of CbpD. (A) Electron density and protonation state of the LPMO domain. σA-weighted 2mFo-DFc map contoured at 1.0 σ showing the histidine brace motif. (B) Protonation state of the histidine side chains of the active site at pH 7.3, calculated by H++ (56) to be fully protonated. (C) APBS-calculated surface potential for the CbpD LPMO domain, based on the protonated model generated by H++ for pH 7.3. The cellulose substrate (green) from the Lentinus similis LPMO9A (PDB ID: 5ACI) (57) was used to mark the putative substrate–binding region, and the active site is indicated by a white arrow. (D) Comparison of the active sites of CbpD (yellow; PDB ID: 8C5N, this work), GbpA from Vibrio cholerae (purple; PDB ID: 2XWX) and EfCBM33 from Enterococcus faecalis (cyan; PDB ID: 4ALE). Amino acids are labeled and color-coded, unless identical in all three proteins (in which case they are labeled by the residue number of CbpD, in black). (E) Superimposition of the three structures from panel (D) in cartoon representation. A dashed rectangle indicates the additional α-helix and loop that extend the putative substrate–binding site of CbpD. (F) Ab initio model of full-length CbpD, generated using Alphafold2 (UniProt entry Q02I11 from the Alphafold database). The three domains of CbpD and the linker region connecting the second domain [referred to as (‘GbpA2/M2’ domain) and third domain (‘CBM73’ domain) are labeled. An arrow points to the active site of the AA10 domain, where the two histidine residues are shown in stick representation. (G) Surface representation of the CbpD structure predicted with Alphafold2, showing the AA10 LPMO domain (light purple; active site histidines colored yellow and indicated by arrow], the GbpA2/M2 domain (wheat), the linker connecting domains 2 and 3 (forest green), and the CBM73 domain (teal). The potential discontinuous structural epitopes predicted using Discotope 2.0 (58) are colored blue and labeled.
Fig. 3.
Fig. 3.
CbpD-immunized mice are protected against PA infectious challenge. (A) The timeline depicts the immunization of CD-1 mice with CbpD plus alum (CbpD) or alum alone (Mock), bleeding and PA WT challenge. (B) Total serum anti-CbpD IgG levels following CbpD immunization with 0 µg/mouse (mock, alum), 25 µg/mouse (CbpD25) or 75 µg/mouse (CbpD75). The serum was collected on days 13 and 20 postprime (as described in A). The data are plotted as the mean ± SEM, representing 10 mice per group. (C) CbpD25 (n = 10), CbpD75 (n = 10), and mock (alum)-immunized (n = 11) CD-1 mice were inoculated IT with 3×10⁶ CFU/mouse PA WT at day 21 of the vaccination schedule (as described in A). Survival is represented by Kaplan–Meier survival curves and was analyzed by the log-rank (Mantel–Cox) test. CbpD25 vs. Mock: P = 0.0001, CbpD75 vs. Mock: P = 0.001. (D) CbpD25- (n = 12 mice), CbpD75- (n = 10 mice) and mock (alum)-immunized (n = 11 mice) CD-1 mice were inoculated IV with 2 ×10⁷ CFU/mouse PA WT at day 21 postprime. Survival is represented by Kaplan–Meier survival curves and was analyzed by the log-rank (Mantel–Cox) test. CbpD25 vs. Mock: P = 0.0091, CbpD75 vs. Mock: P = 0.0002. (E) CbpD75- (n = 9) and mock (alum)-immunized (n = 9) CD-1 mice were IT infected with 1×10⁶ PA WT per mice at day 21 postprime. The bacterial burden in the lung (CFU/g) was enumerated 24 h postinfection. The data are plotted as the mean ± SEM, representing 9 to 10 mice per group, and were analyzed by the unpaired t test. P < 0.0001. (F) CbpD75- (n = 9) and mock (alum)-immunized (n = 10) CD-1 mice were enumerated 4 h post IV infection with 2 ×10⁷ CFU WT PA per mice at day 21 postprime. Bacterial load in blood (CFU/mL) and tissues (CFU/g) was enumerated 24 h postinfection. The data are plotted as the mean ± SEM, representing 9 to 10 mice per group, and were analyzed by the unpaired t test. Blood: P = 0.0029; spleen: P = 0.0112; kidney: P = 0.0348. (G) Dynamics of changes in the titers of CbpD-IgG in CD-1 murine sera in the period from 1 to 12 wk postprime immunization. The timeline of the immunization is described in A. CbpD-IgG titers in the mock-immunized group are shown in SI Appendix, Fig. S3C. The data are plotted as the mean ± SEM, representing five mice per group. (H) CbpD75- (n = 9) and mock (alum)-immunized (n = 7) CD-1 mice were enumerated 24 h post IT infection with 0.5 ×10⁶ PA103UCSD per mice at day 21 postprime. Bacterial load in the lung (CFU/g) was enumerated 24 h postinfection. The data are plotted as the mean ± SEM, representing seven to nine mice per group, and were analyzed by the unpaired t test. P = 0.0032. (I) CbpD75- (n = 8) and mock (alum)-immunized (n = 8) CD-1 mice were enumerated 24 h post IT infection with 2 ×10⁶ CFU ΔCbpD per mice at day 21-post prime, respectively. Bacterial load in the lung (CFU/g) was enumerated 24 h postinfection. The data are plotted as the mean ± SEM, representing eight mice per group, and were analyzed by the unpaired t test. Each data point represents an individual mouse, and the significant differences are marked with asterisks (*): *P ≤ 0.05; **P ≤ 0.01; ***P ≤ 0.001; ****P ≤ 0.0001.
Fig. 4.
Fig. 4.
Opsonophagocytic and protective activities of anti-CbpD IgG. (A) Opsonophagocytic killing of WT PA by freshly purified human neutrophils at MOI = 15 in the presence of 5% immunized murine sera (collected at day 20 postprime). The assay lasted 30 min. Data are plotted as the mean ± SEM, representing 10 mice per group, and were analyzed by the unpaired t test. P = 0.0002. (B and C) Opsonophagocytic killing of (B) ΔCbpD (n = 10 mice), (C) PA109UCSD (n = 8 mice), and PA103UCSD (n = 8 mice) at MOI = 5 by freshly isolated human neutrophils in the presence of 5% fully immunized murine sera (collected at day 20 postprime). The assay lasted 30 min. The data are plotted as mean ± SEM, representing 8 to 10 mice per group, and analyzed by the unpaired t test. PA109UCSD P = 0.0036, PA103UCSD P = 0.0140. (D and E) Anti-CbpD IgG (70 µg/mouse, n = 8 mice) or mouse IgG (70 µg/mouse, n = 7 mice) was IV transferred to naive CD-1 mice. The recipient mice were IT challenged with 1 × 10⁶ CFU/mouse WT PA 16 h after adoptive transfer. (D) The serum was collected 16 h post adoptive transfer for anti-CbpD IgG titer analysis. (E) The recipient mice were IT challenged with 1 × 10⁶ WT PA 16 h post adoptive transfer. Lungs were collected 24 h postinfection for enumeration. Data are plotted as the mean ± SEM of two experiments, representing seven to nine mice per group. (F) Two doses of antibodies including 200 µg/mouse (16 h prior infection) and 100 µg/mouse (30 min postinfection) µg/mouse anti-CbpD IgG (n = 8 mice) or mouse IgG (n = 10 mice) were IV transferred to naive CD-1 mice. The recipient mice were IT challenged with 2.5 × 10⁶ CFU/mouse WT PA. The lung was collected 24 h postinfection for enumeration. The data are plotted as the mean ± SEM of two experiments, representing 8 to 10 mice per group. (G) CbpD-immunized (CbpD75) and mock-immunized (alum) CD-1 mice were treated IV with anti-CD4 or isotype control (n = 9 mice/group) 48 h and 24 h prior PA challenge. Next, 24 h post CD4 cells depletion, mice were inoculated IT with 1×10⁶ CFU/mouse PA WT. The bacterial load in the lung (CFU/g) was enumerated 24 h postinfection. Representative flow plots are presented in SI Appendix, Fig. S4A. The data are plotted as the mean ± SEM, representing nine mice/group and were analyzed with the unpaired t test. Anti-CD4: P = 0.0311, Isotype control: P = 0.0246. Each data point represents an individual mouse, and the significant differences are marked with asterisks (*): *P ≤ 0.05; **P ≤ 0.01; ***P ≤ 0.001; ****P ≤ 0.0001.
Fig. 5.
Fig. 5.
Immunization with CbpD elicits neutralizing antibodies. (A) Total plasma anti-CbpD IgG levels in healthy human individuals and cystic fibrosis (CF) patients who were colonized (PA+) or noncolonized (PA-) with PA at the time of blood collection. Data are plotted as the mean ± SEM, representing 5 individuals per group. Data were analyzed by two-way ANOVA (Dunnett’s multiple comparisons test). 102: CF (PA+) vs. Healthy: P = <0.0001; 103: CF (PA+) vs. Healthy: P = <0.0001, CF (PA+) vs. CF (PA-) A: P = 0.0001; 104: CF (PA+) vs. Healthy: P = 0.0017, CF (PA+) vs. CF (PA-): P = 0.0360. (B) Opsonophagocytic killing of WT PA at MOI = 7 by freshly isolated human neutrophils in the presence of 5% human plasma obtained from healthy individuals or CF patients (as described in A). The assay lasted 30 min. Data are plotted as the mean ± SEM, representing five individuals per group that were analyzed in triplicate and examined by the unpaired t test. Healthy vs. CF (PA-): P = 0.0319. (C) CD-1 mice were IT challenged with PA once per week for 6 wk (6×). Serum anti-CbpD IgG levels were measured (dilution: 1:103) at week 1, 3, and 6 postinfection at week 0 with WT (Left, WTPrior) or PA103UCSD (Right, PA103UCSD-Prior). Mock-infected mice (PBS) served as control. The data are plotted as the mean ± SEM, representing 8 mice per group. Data were analyzed by two-way ANOVA (Tukey’s multiple comparisons test). WT: week (1 vs. 6): P = 0.0240; week (3 vs. 6): P = 0.0157; PA103UCSD: week (1 vs. 6): P = 0.0004, week (3 vs. 6): P = 0.0009. (D) The lung bacterial burden in the mice that were recurrently exposed to WT PA (WTPrior) or PA103UCSD-Prior and PBS (Mock-infected mice) as described in C. The mice were mock-immunized (alum) (as described in Fig. 3A) and rechallenged IT with a sublethal dose of 1 ×10⁶ WT PA or 0.5 ×10⁶ PA103UCSD. Bacterial load was enumerated 24 h postinfection. The data are plotted as the mean ± SEM, representing 5 individuals per group. Data were analyzed by the two-tailed paired t test. (E) Total anti-CbpD IgG in sera (dilution: 1:103) from immunized (CbpD75)- and mock-immunized mice that were recurrently exposed to WT PA (as described in C). The data are plotted as the mean ± SEM, representing five mice per group. Data were analyzed by two-way ANOVA (Tukey’s multiple comparisons test). WTPrior P = < 0.0001, PA103UCSD-Prior P = <0.0001. (F) Opsonophagocytic killing by freshly isolated human neutrophils in the presence of 5% immunized (CbpD75)- and mock-immunized mice that were recurrently exposed to WT PA (as described in C). The assay lasted 30 min at MOI = 5. Data are plotted as the mean ± SEM of two experiments, representing five mice per group. Data were analyzed by the unpaired t test. P = 0.0075. (G) HPLC analysis of reaction products emerging from a mixture of copper-saturated recombinant CbpD, β-chitin, ascorbate as reducing agent (in all samples), and mouse anti-CbpD IgG, in buffer (20 mM Tris-HCl pH 7.0), for 3 h at 37 °C under shaking. The degrees of polymerization (DP) of chitooligosaccharide aldonic acids in a standard sample are depicted. The reactions without 1 mM ascorbate, which resulted in generation of no oxidized product is shown in SI Appendix, Fig. S3H. (H) Total serum anti-AA10 IgG and anti-M2+CBM73 IgG levels (dilution: 1:103) following CbpD immunization with 0 µg/mouse regimen (mock, alum), 25 µg/mouse regimen (CbpD25), and 75 µg/mouse regiment (CbpD75) as described in Fig. 3A. Serum was collected on day 20 postprime and recombinant AA10 and M2+CBM73 were immobilized on an ELISA plate. Data are plotted as the mean ± SEM, representing 10 mice per group, and analyzed by two-way ANOVA (Tukey’s multiple comparisons test). CbpD75 P = 0.0018; CbpD25 P = 0.0078. (I) Total serum anti-AA10 IgG and anti-M2+CBM73 IgG level following immunization with truncated variants of CbpD (25 µg/mouse regimen) as described in Fig. 3A. The serum was collected on day 20 postprime and recombinant CbpD were immobilized on an ELISA plate. The data are plotted as the mean ± SEM, representing nine mice per group. Data were analyzed by two-way ANOVA (Tukey’s multiple comparisons test). 1:103 P = < 0.0001; 1:104 P = < 0.0001. (J) CbpD- (n = 8 mice, 25 µg/mouse regimen), AA10- (n = 9 mice, 25 µg/mouse regimen), M2+CBM73 (n = 8 mice, 25 µg/mouse regimen), and mock (alum)-immunized (n =10 mice) were inoculated IT with 2 ×10⁶ CFU/mouse PA WT. Survival is represented by Kaplan–Meier survival curves and analyzed by the log-rank (Mantel–Cox) test. CbpD vs. Mock: P = 0.0130, M2+CBM73 vs. Mock: P = 0.0360. (K) Opsonophagocytic killing of WT PA by freshly purified human neutrophils at MOI = 12 in the presence of 5% immunized mouse sera (collected at day 20 postprime). The assay lasted 30 min. Data are plotted as the mean ± SEM, representing nine mice per group, and were analyzed by two-way ANOVA (Tukey’s multiple comparisons test). AA10 vs. M2+CBM73: P = 0.0008; Mock vs. M2+CBM73: P = < 0.0001. (L) Total plasma anti-AA10 and M2+CBM73 IgG levels in healthy human individuals and cystic fibrosis (CF) patients (dilution: 1:102) who were colonized (PA+) or noncolonized (PA-) with PA at the time of blood collection. Recombinant AA10 and M2+CBM73 were immobilized on an ELISA plate. The data are plotted as the mean ± SEM of two independent ELISA, representing five individuals per group. Data were analyzed by two-way ANOVA (Šídák’s multiple comparisons test). AA10 vs. M2+CBM73 CF (PA+): P = 0.0002. Each data point represents an individual mouse/human, and the significant differences are marked with asterisks (*): *P ≤ 0.05; **P ≤ 0.01; ***P ≤ 0.001; ****P ≤ 0.0001.

References

    1. Folkesson A., et al. , Adaptation of Pseudomonas aeruginosa to the cystic fibrosis airway: An evolutionary perspective. Nat. Rev. Microbiol. 10, 841–851 (2012). - PubMed
    1. Rossi E., et al. , Pseudomonas aeruginosa adaptation and evolution in patients with cystic fibrosis. Nat. Rev. Microbiol. 19, 331–342 (2021). - PubMed
    1. Cystic Fibrosis Foundation, “Cystic fibrosis foundation patient registry 2020 annual data report” (Cystic Fibrosis Foundation Patient Registry, Bethesda, MD, 2021).
    1. Almagro P., et al. , Pseudomonas aeruginosa and mortality after hospital admission for chronic obstructive pulmonary disease. Respiration 84, 36–43 (2012). - PubMed
    1. Finch S., McDonnell M. J., Abo-Leyah H., Aliberti S., Chalmers J. D., A comprehensive analysis of the impact of Pseudomonas aeruginosa colonization on prognosis in adult bronchiectasis. Ann. Am. Thorac. Soc. 12, 1602–1611 (2015). - PubMed

Publication types