. 2023 Jul 25;120(30):e2220296120.
doi: 10.1073/pnas.2220296120. Epub 2023 Jul 17.

Cytoskeleton remodeling mediated by circRNA-YBX1 phase separation suppresses the metastasis of liver cancer

Affiliations

Cytoskeleton remodeling mediated by circRNA-YBX1 phase separation suppresses the metastasis of liver cancer

Boqiang Liu et al. Proc Natl Acad Sci U S A. .

Erratum in

Abstract

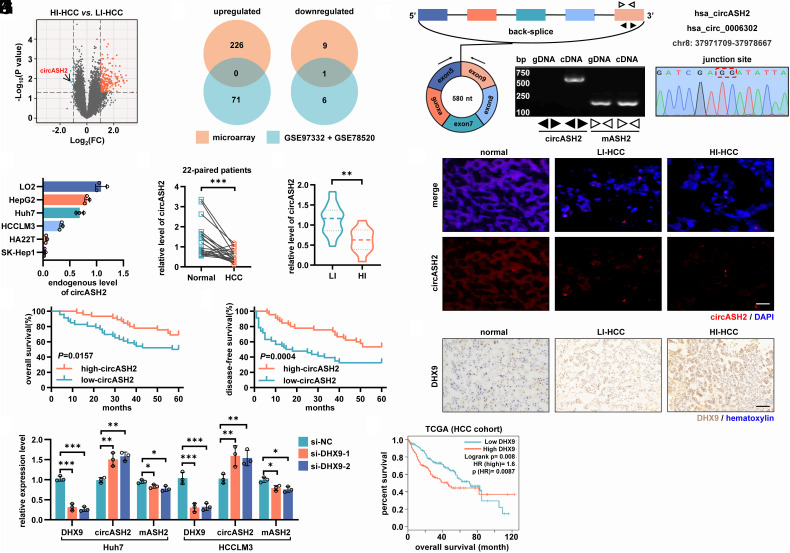
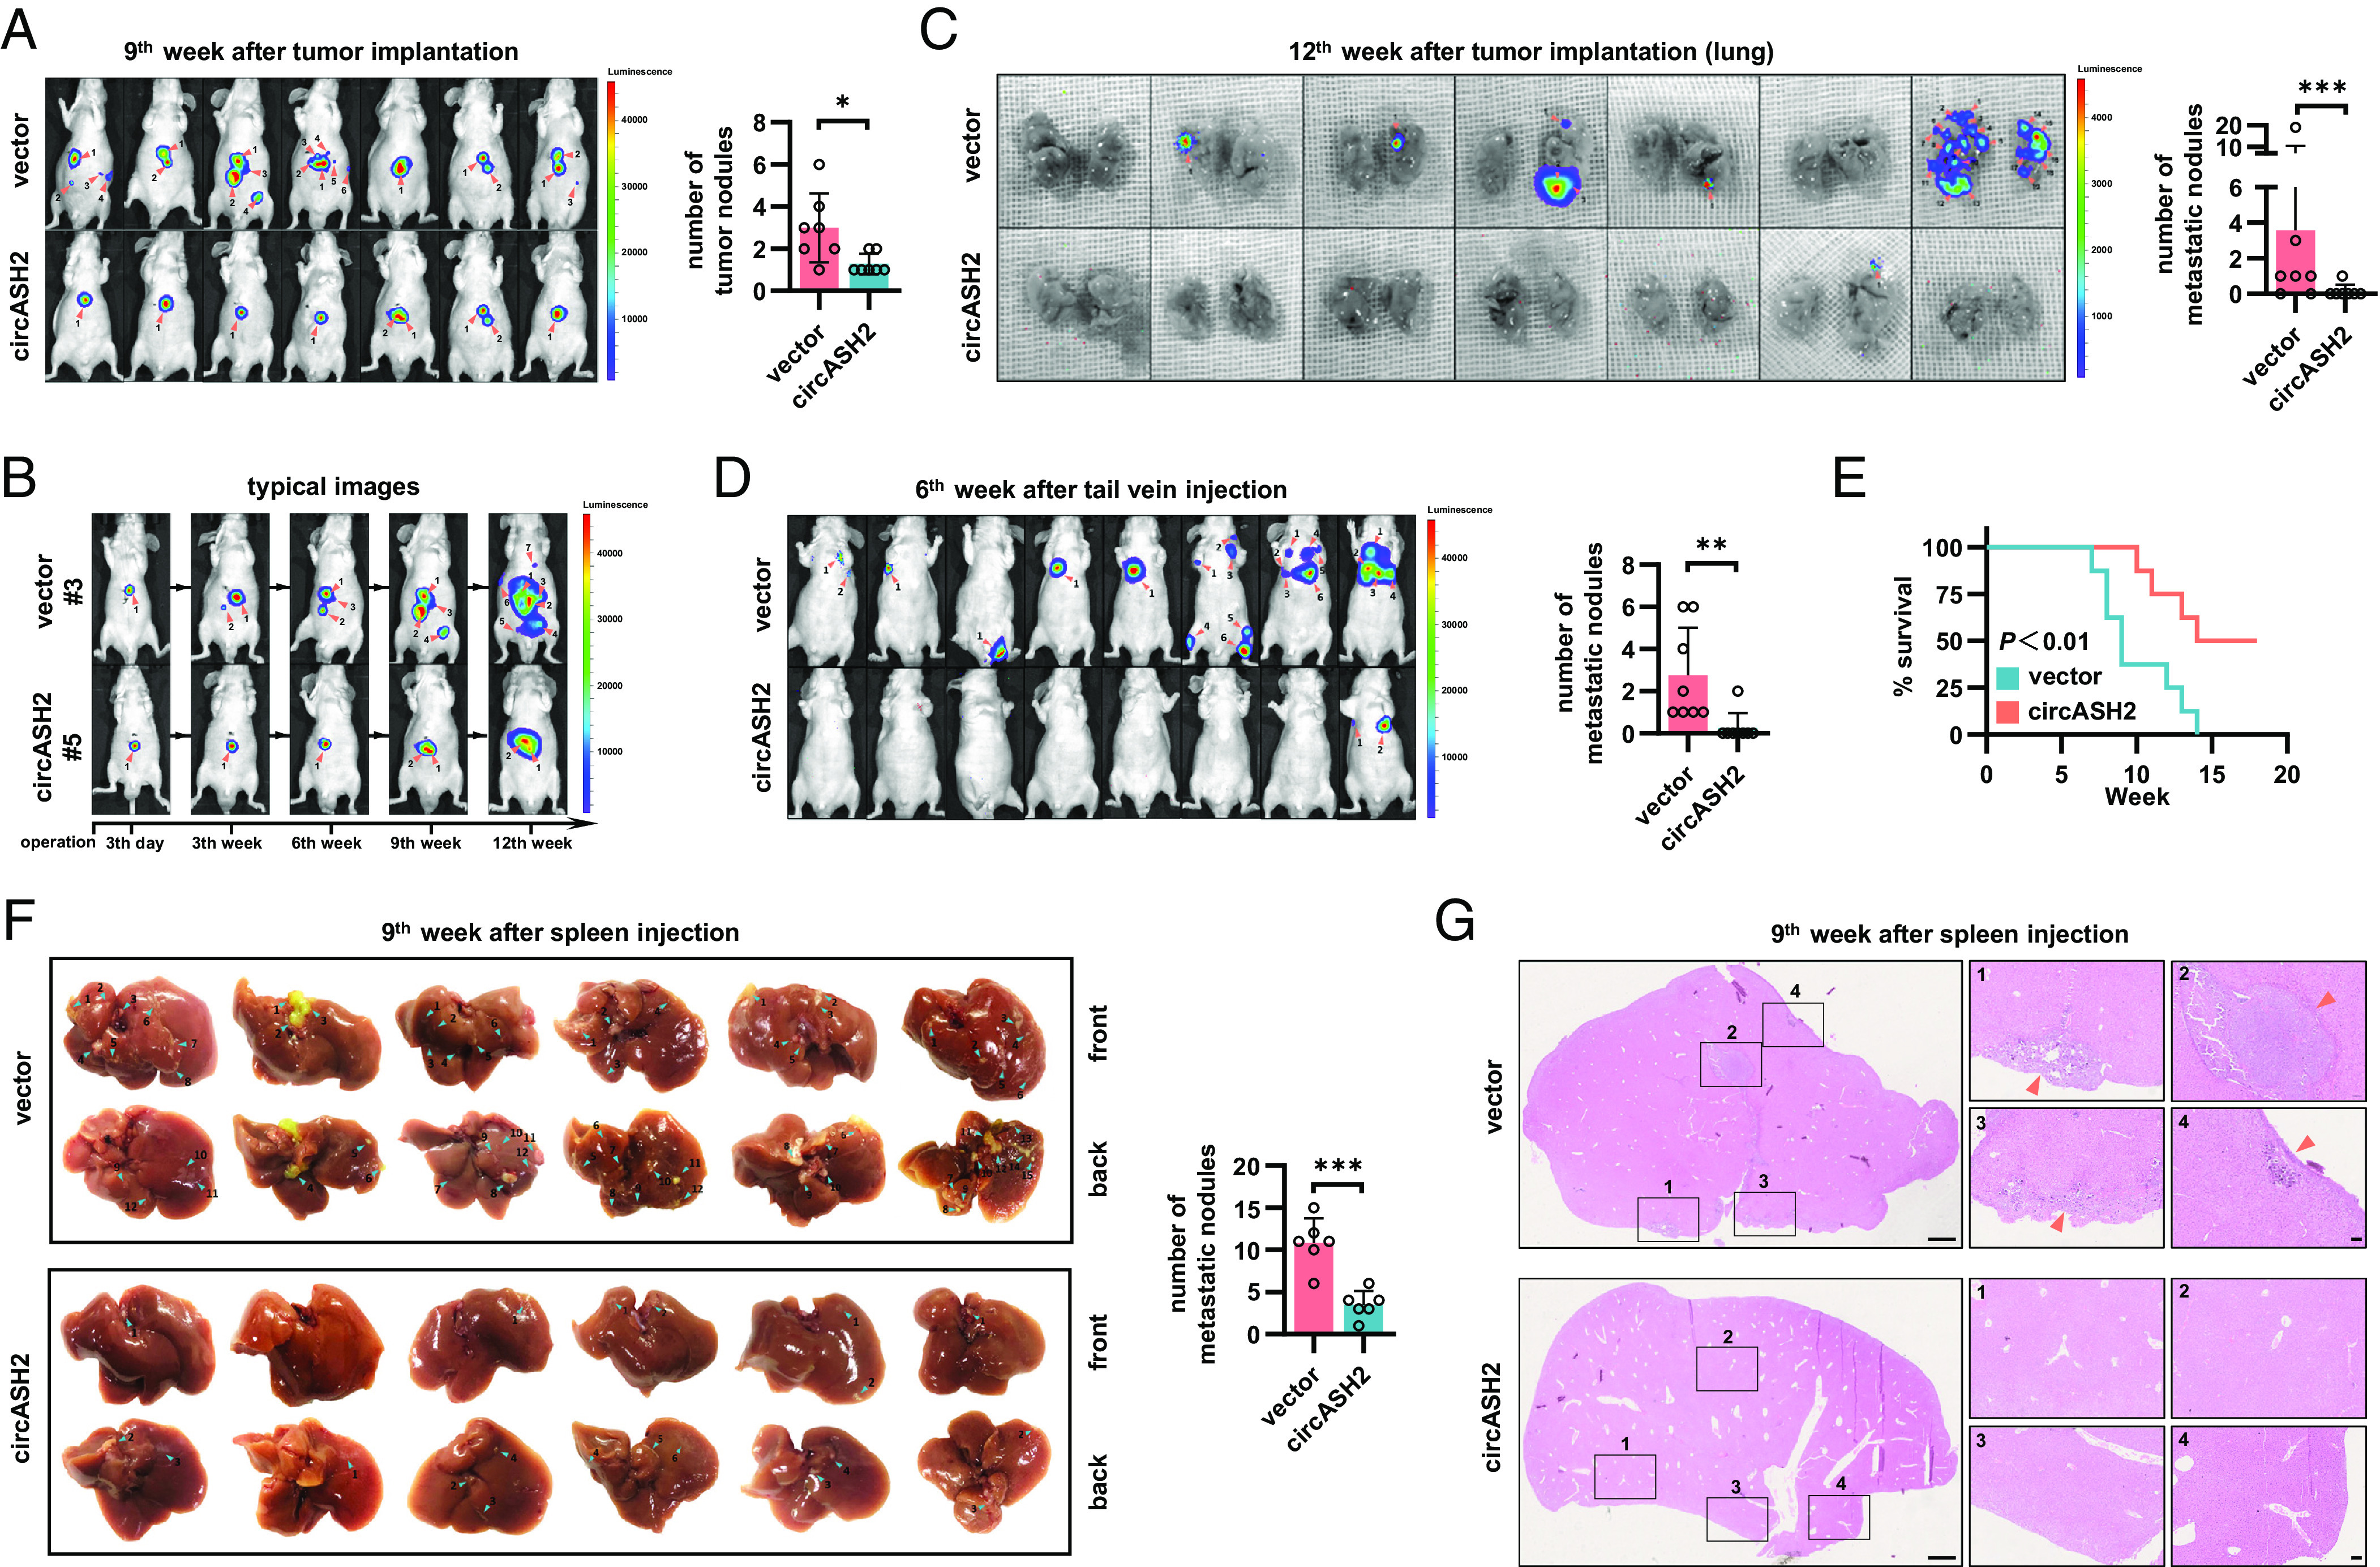
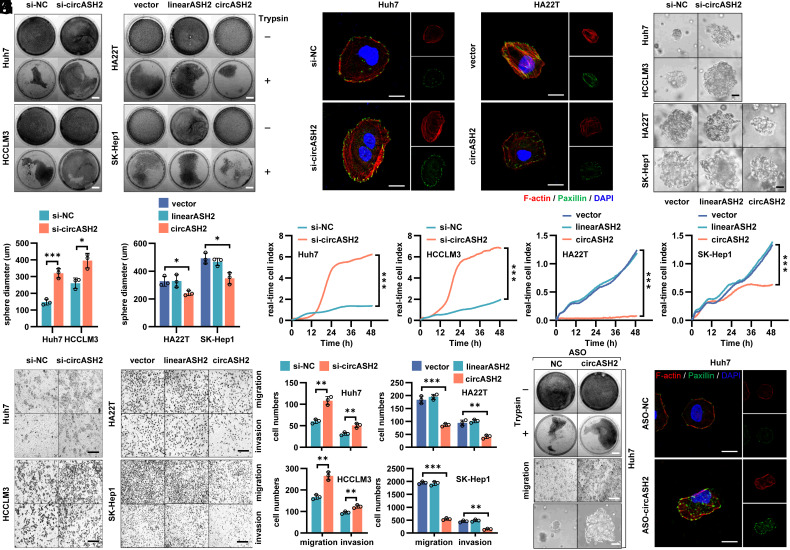
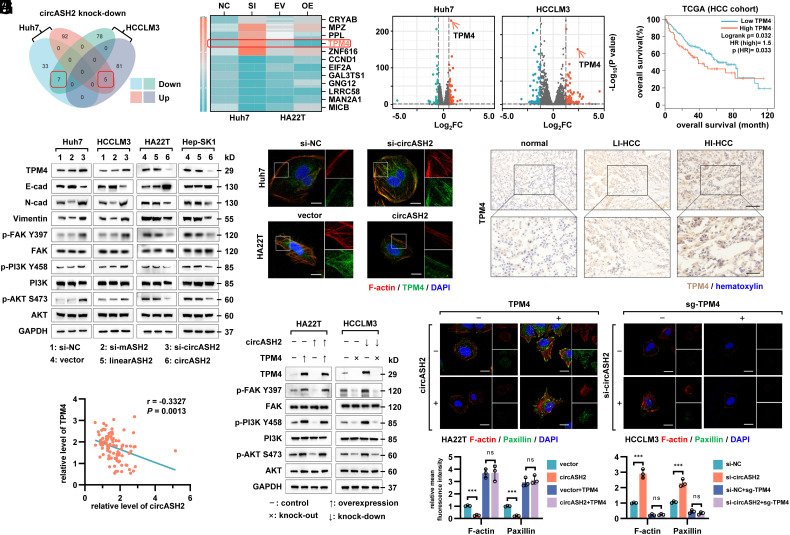
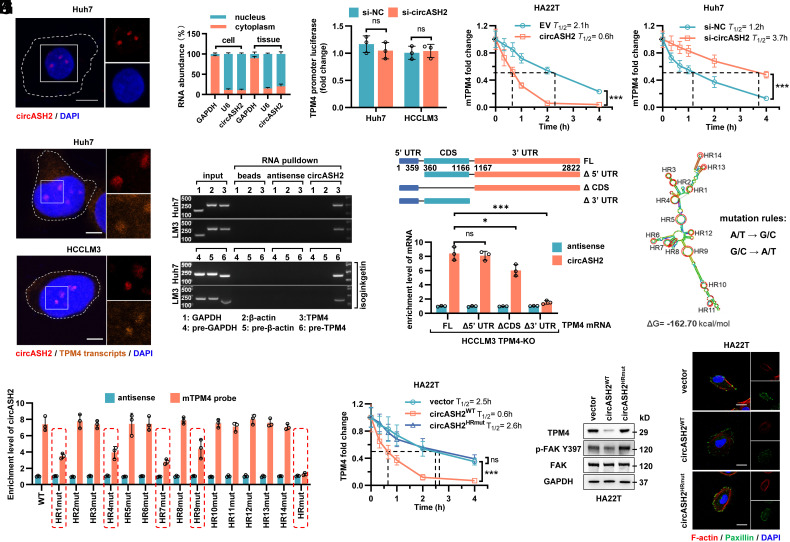
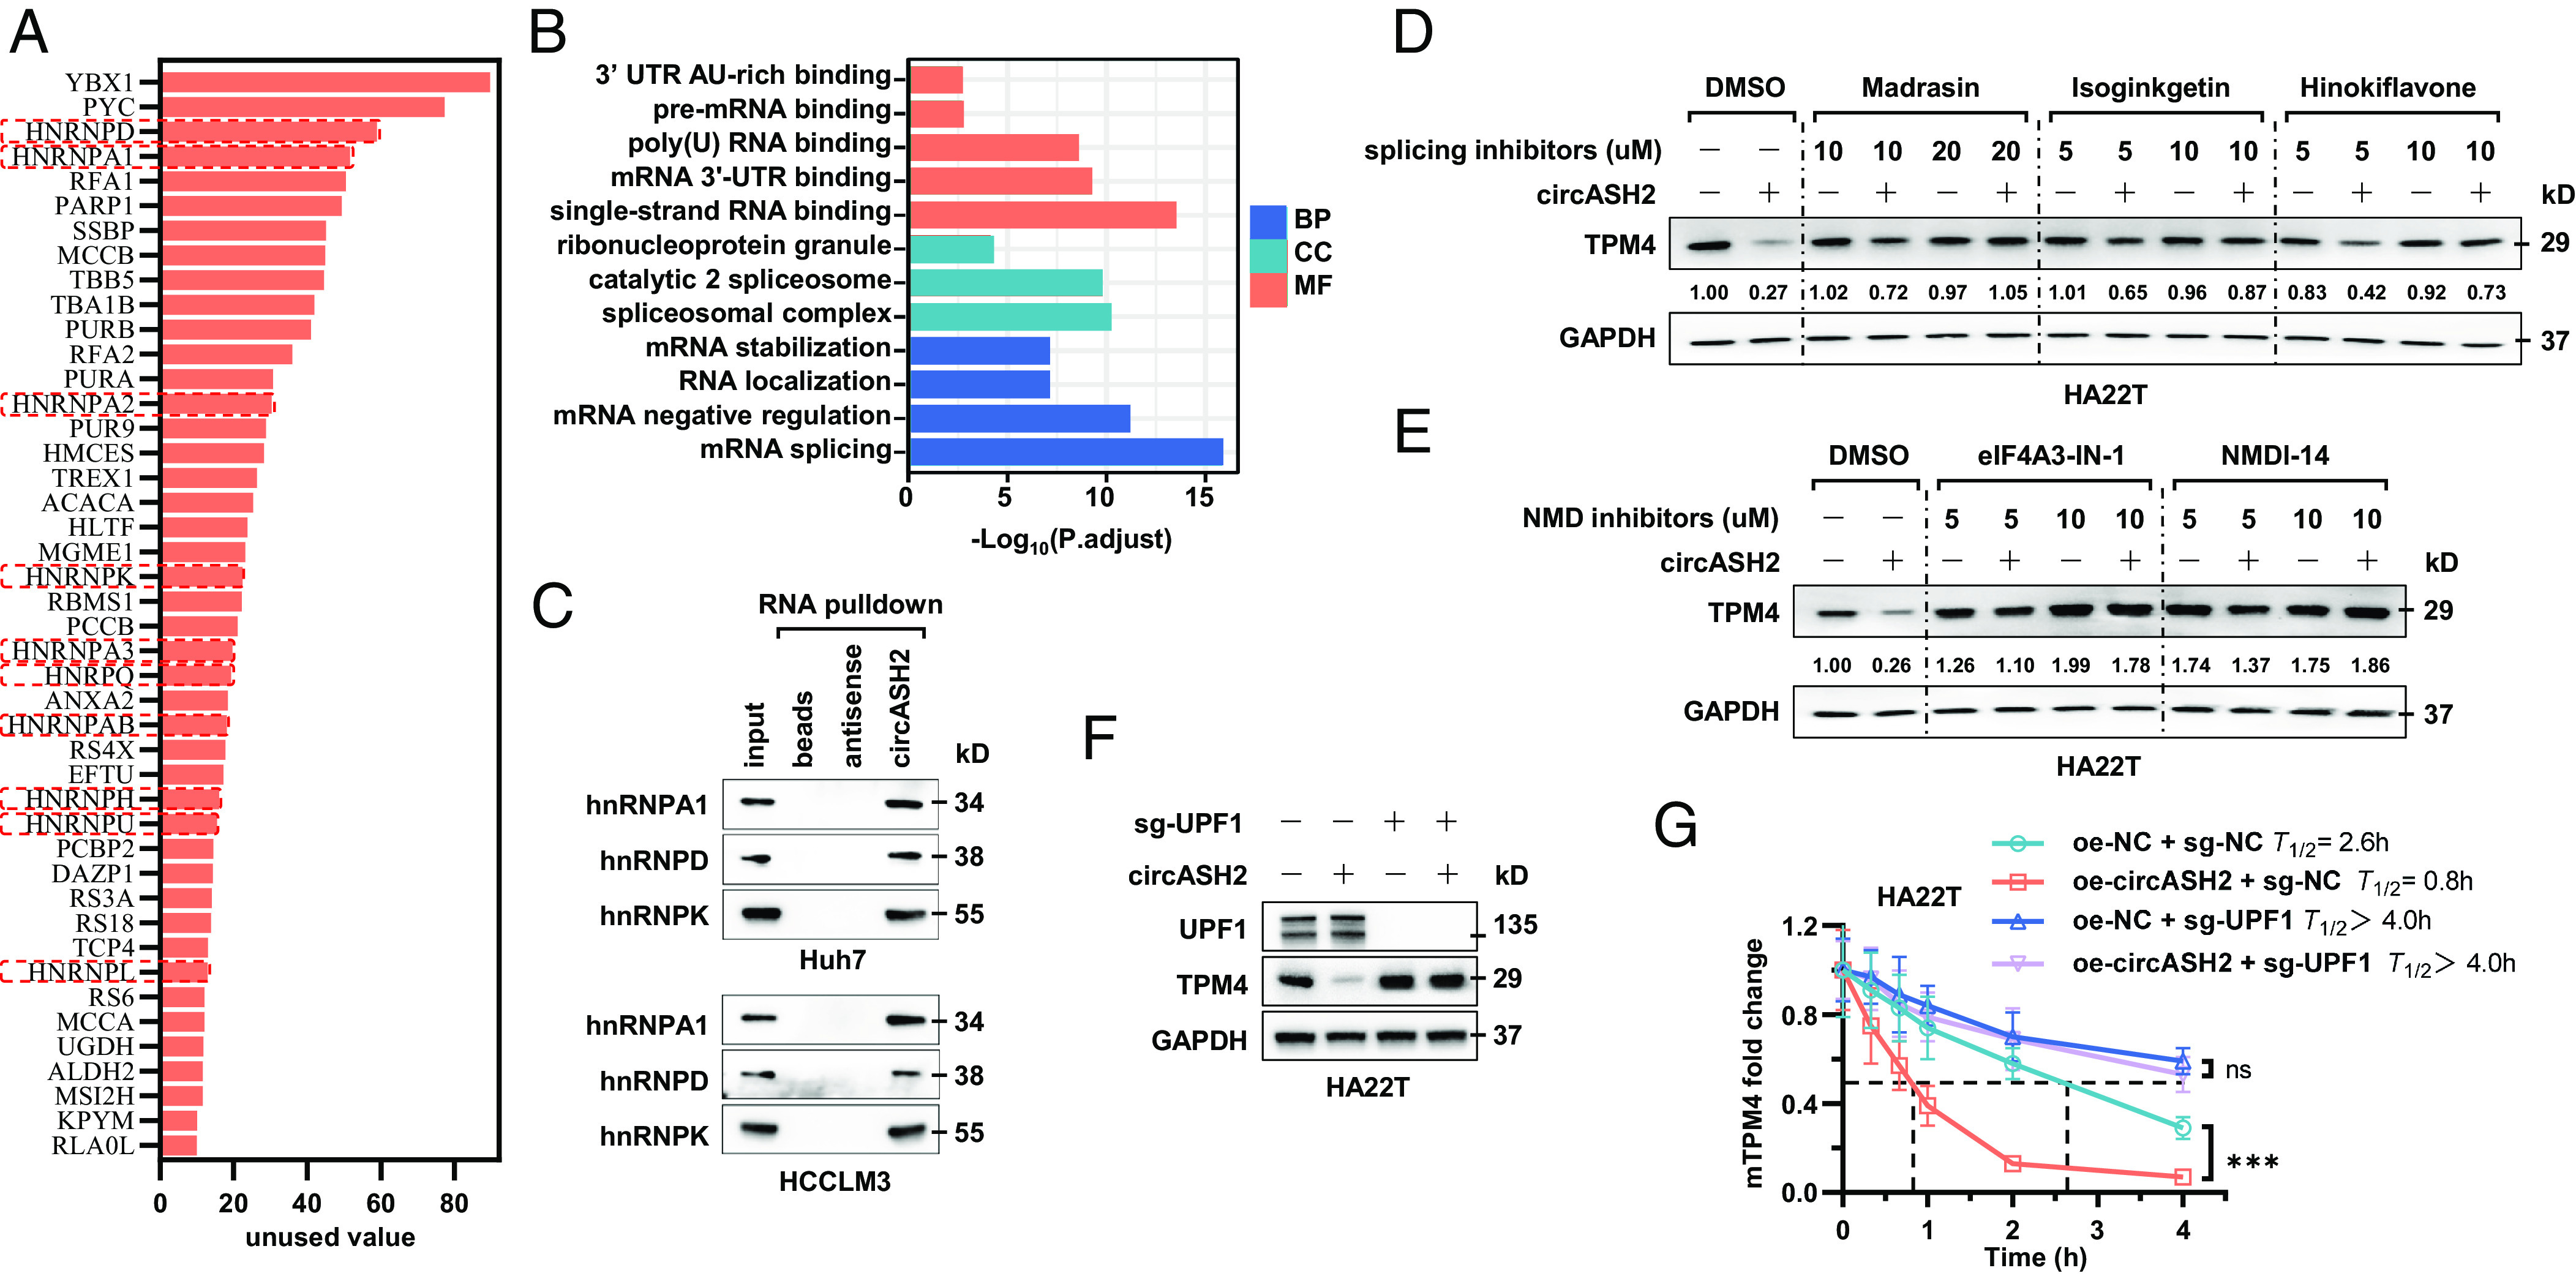
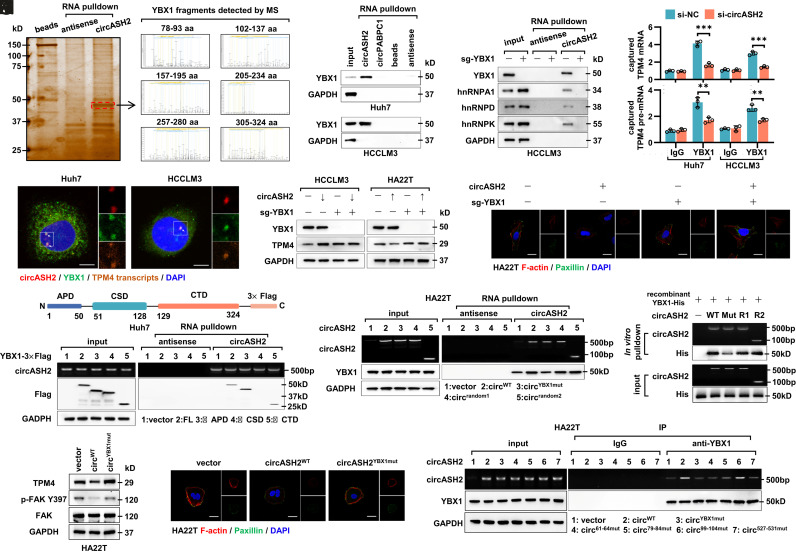
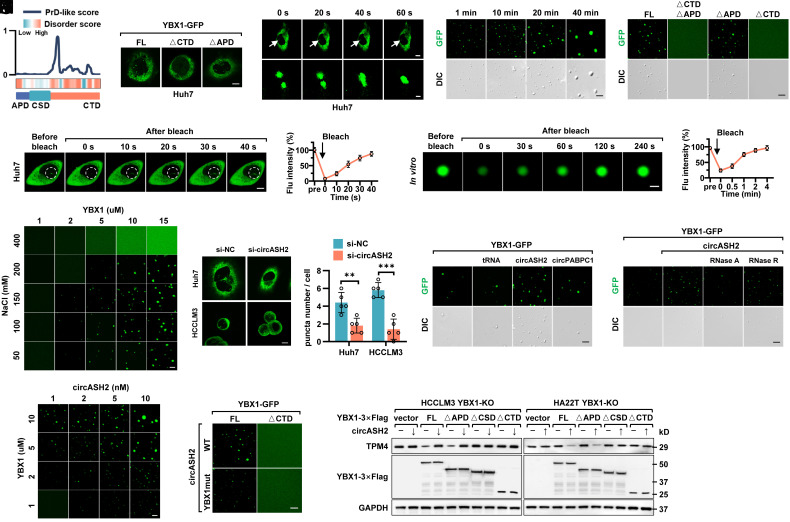
Metastasis, especially intrahepatic, is a major challenge for hepatocellular carcinoma (HCC) treatment. Cytoskeleton remodeling has been identified as a vital process mediating intrahepatic spreading. Previously, we reported that HCC tumor adhesion and invasion were modulated by circular RNA (circRNA), which has emerged as an important regulator of various cellular processes and has been implicated in cancer progression. Here, we uncovered a nuclear circRNA, circASH2, which is preferentially lost in HCC tissues and inhibits HCC metastasis by altering tumor cytoskeleton structure. Tropomyosin 4 (TPM4), a critical binding protein of actin, turned out to be the major target of circASH2 and was posttranscriptionally suppressed. Such regulation is based on messenger RNA (mRNA)/precursormRNA splicing and degradation process. Furthermore, liquid-liquid phase separation of nuclear Y-box binding protein 1 (YBX1) enhanced by circASH2 augments TPM4 transcripts decay. Together, our data have revealed a tumor-suppressive circRNA and, more importantly, uncovered a fine regulation mechanism for HCC progression.

Keywords: circASH2; cytoskeleton; liquid–liquid phase separation; mRNA decay; metastasis.


Conflict of interest statement

The authors declare no competing interest.

Figures

Fig. 1.
Fig. 1.
The microarray analysis identified circASH2 as a metastasis-suppressive role and regulated by DHX9 in HCC. (A) circRNA microarray analysis of 5 HI and 5 LI HCC tissues. Differentially expressed circRNAs (|log2(fold-change)|≥ 1, P < 0.05) were highlighted (up-regulated in HI: orange points; down-regulated in HI: green points). circASH2 is denoted by a black arrow. (B) A Venn diagram showing differentially expressed circRNAs within our microarray data and GSE78520 + GSE97332 dataset. (C) Genomic loci and validation of circASH2. The unique backspliced junction fragment of circASH2 (divergent primers) was detected in Huh7 cells by RT-qPCR and validated by Sanger sequencing. (D) Endogenous level of circASH2 in several human HCC cell lines (HepG2, Huh7, HCCLM3, HA22T, and SK-Hep1) and a human liver cell line (LO-2). (E and F) The expression of circASH2 was measured by RT-qPCR in 22-paired matched HCC and nontumor tissues (E, cohort 1, ***P < 0.001, paired Student’s t test), and 32 HI/LI HCC tissues (F, cohort 2, **P < 0.01, unpaired Student’s t test). (G) Representative RNA FISH images of circASH2 (red, 40 nM, 55 °C, 2 h) in nontumor tissues, LI HCC tissues, and HI HCC tissues. The nuclei were labeled with DAPI (blue, 1:100, R.T., 5 min). (Scale bars, 100 μm.) (H and I) Kaplan–Meier curves showing overall survival (H) and disease-free survival (I) of 91 HCC patients (cohort 3) followed up to 60 mo. Patients were separated by the median expression level of circASH2, using the Gehan–Breslow test. (J) The expression levels of DHX9, circASH2, and mASH2 were detected by RT-qPCR after being treated with DXH9 siRNAs in Huh7 and HCCLM3 cells (mean ± SD, *P < 0.05, **P < 0.01, ***P < 0.001, one-way ANOVA test). (K) Representative IHC images of DHX9 (brown, 1:200, 4 °C, 2 h) in nontumor tissues, LI HCC tissues, and HI HCC tissues. The nuclei were labeled with hematoxylin (blue, R.T., 5 min). (Scale bars, 200 μm.) (L) Kaplan–Meier curves showing overall survival of HCC patients from the TCGA cohort. Patients were separated by the median expression level of DHX9, using the Gehan–Breslow test.
Fig. 2.
Fig. 2.
circASH2 suppresses HCC metastasis in vivo. (A, Left) In vivo image system (IVIS) images of HA22T tumors in the 9th week after transplantation (both local growth and metastases are marked with orange arrows, n = 7). (Right) Tumor foci are quantified (mean ± SD, **P < 0.01, unpaired Student’s t test). (B) Typical images of HA22T tumors (#3 mouse in the control group and #5 the mouse in the circASH2 group) at the indicated time (both local growth and metastases are marked with orange arrows). (C, Left) IVIS images showing pulmonary metastasis in mice scarified in the 12th week (metastases are marked with orange arrows, n = 7). (Right) Pulmonary metastases are quantified (mean ± SD, ***P < 0.001, unpaired Student’s t test). (D, Left) IVIS images of HA22T tumors in the 6th week after rapid tail vein injection (metastases are marked with orange arrows, n = 8). (Right) Tumor foci are quantified (mean ± SD, **P < 0.01, unpaired Student’s t test). (E) Kaplan–Meier curves showing overall survival of 16 mice with indicated HA22T tumors followed up to 18 wk (**P < 0.01, Gehan–Breslow test). (F, Left) Liver images of HA22T tumors in the 9th week after spleen injection (intrahepatic metastases are marked with blue arrows, n = 6). (Right) Intrahepatic metastases are quantified (mean ± SD, ***P < 0.001, unpaired Student’s t test). (G) Typical HE staining images of HA22T tumors in the 9th week after spleen injection. Left: (Scale bar, 1 mm.) Right: (Scale bar, 100 μm.)
Fig. 3.
Fig. 3.
circASH2 impairs the cytoskeleton assembly in HCC. (A) Trypsin digestion assay on 4 HCC cell lines with circASH2 overexpression [linearASH2 (580 bp) as a negative control] or knockdown. Cells without (−) or with (+) trypsinization were fix-stained with crystal violet (0.1%, R.T., 5 min) and photographed. (Scale bars, 1 cm.) (B) Cytoskeleton formation in Huh7 cells with circASH2 knockdown and HA22T cells with circASH2 overexpression was shown by phalloidin staining of F-actin (red, 1:200, R.T., 10 min) and immunofluorescence of paxillin (green, 1:200, R.T., 1 h), while DAPI was used to stain the nucleus. (Scale bar, 10 μm.) (C and D) In vitro 3D invasion assays were performed using 4 HCC cell lines with circASH2 overexpression or knockdown. The representative pictures are shown (C), and the diameter of the sphere was measured and analyzed (D, *P < 0.05, ***P < 0.001, unpaired Student’s t test or one-way ANOVA test). (Scale bar, 100 μm.) (E) Real-time capture of 4 HCC cell lines (circASH2 overexpression or knockdown) migration was performed on the xCELLigence System and Real-time Cell Analysis (RTCA) Dual Purpose (DP) Instrument over 48 h. Data were processed by RTCA Software 2.0 (***P < 0.001, two-way ANOVA test). (F and G) Transwell assays with 4 HCC cell lines (circASH2 overexpression or knockdown). Representative fields of the porous membranes are shown (F, scale bar, 100 μm), and cell numbers per field are quantified (G, means ± SD, **P < 0.01, and ***P < 0.001, unpaired Student’s t test or one-way ANOVA test). (H) Trypsin digestion assay on Huh7 cells with circASH2 knockdown (ASO-circASH2). Cells without (−) or with (+) trypsinization were fix-stained with crystal violet and photographed. (Scale bars, 1 cm.) (I) Transwell migration assays with circASH2 knockdown (ASO-circASH2) Huh7 cells. Representative fields of the porous membranes are shown. (Scale bar, 100 μm.) (J) 3D invasive ability of circASH2 knockdown (ASO-circASH2) Huh7 cells was measured, and the representative pictures are shown. (Scale bar, 100 μm.) (K) Cytoskeleton formation in Huh7 cells with circASH2 knockdown (ASO-circASH2) was shown by phalloidin staining of F-actin (red) and immunofluorescence of paxillin (green), while DAPI was used to stain the nucleus. (Scale bar, 10 μm.)
Fig. 4.
Fig. 4.
TPM4 is repressed by circASH2 and functionally relevant. (A) A Venn diagram showing differentially expressed genes in circASH2 knock-down HCC cells (Huh7 and HCCLM3) compared with the control group. The overlapped gene numbers are highlighted with red boxes. (B) A heatmap showing the expression levels of 12 candidates detected by RT-qPCR after overexpressing or silencing circASH2. TPM4 is highlighted with a red box. (C) A volcano map showing overall changes in gene expression (up-regulated in the si-circASH2 group: orange points; down-regulated in the si-circASH2 group: green points), and TPM4 was one of the most up-regulated genes both in circASH2 knock-down Huh7 and HCCLM3 cells (denoted by orange arrows). (D) Kaplan–Meier curves showing overall survival of HCC patients from the TCGA cohort. Patients were separated by the expression level of TPM4, using the Gehan–Breslow test. (E) HCC cells with circASH2 overexpression or knockdown were analyzed for TPM4 expression and other related signaling by immunoblotting with the indicated antibodies (1:1,000, 4 °C, overnight). GAPDH was used as an internal reference. (F) Representative fluorescence images showing the expression levels and locations of TPM4 (green, 1:200, R.T., 1 h) and F-actin (red) after circASH2 overexpression or knockdown, while DAPI (blue) was used to stain the nucleus. (Scale bar, 10 μm.) (G) Representative IHC images of TPM4 (brown, 1:250, 4 °C, 2 h) in nontumor tissues, LI HCC tissues, and HI HCC tissues. The nuclei were labeled with hematoxylin (blue). (Scale bars, 200 μm.) (H) Correlations between expression levels of circASH2 and TPM4 in HCC tissues (cohort 3). RNA levels were determined using RT-qPCR and normalized to GAPDH. The r values and P values were calculated using Pearson correlation analysis. (I and J) Reexpression of TPM4 markedly abolished circASH2-mediated inhibition on the cytoskeleton, while knockout of TPM4 largely revoked the function of circASH2 (I) Immunoblots with indicated antibodies; (J, Up) Representative fluorescence images of the cytoskeleton, (scale bar, 10 μm.) (Down) Quantitative analysis on the fluorescence photos by mean fluorescence intensity (means ± SD, ***P < 0.001, one-way ANOVA test).
Fig. 5.
Fig. 5.
circASH2 promotes mRNA decay by physically connecting TPM4 transcripts. (A) Subcellular localization of circASH2 (red) in Huh7 cells revealed by FISH. Nuclei were labeled with DAPI (blue). (Scale bars, 10 μm.) (B) RT-qPCR detection of circASH2 from the indicated compartments of Huh7 cells and HCC tissues (n = 3). GAPDH mRNA and U6 RNA were used as reference RNAs from the cytoplasm and nucleus, respectively. (C) Dual-luciferase reporter assay of the TPM4 promoter (−2,000~0 bp) in si-NC and si-circASH2 HCC cells (n.s., not significant, unpaired Student’s t test). The firefly luciferase activity is normalized to the Renilla luciferase activity (firefly luciferase/Renilla luciferase) and presented as relative luciferase activity. (D) RT-qPCR detection of TPM4 mRNA in circASH2 overexpression or knockdown HCC cells treated with 2 μg/mL actinomycin D for the indicated times. The dashed line shows the half-life of TPM4 mRNA (mean ± SD, ***P < 0.001, two-way ANOVA test). (E) Representative FISH images of circASH2 (red) and TPM4 transcripts (orange, 40 nM, 55 °C, 2 h) showing a marked colocalization of them in Huh7 and HCCLM3 cells. DAPI (blue) was used to stain the nucleus. (Scale bars, 10 μm.) (F) The circRNA pulldown assay confirmed that circASH2 could bind with TPM4 mRNA and TPM4 pre-mRNA (treated with 10 μM isoginkgetin for 48 h). mRNA/pre-mRNA of GAPDH and β-actin were used as a negative control. (G, Top) Cartoon depicting the structure and sequence of TPM4 mRNA (including full-length transcript and 3 different truncations). (Bottom) TPM4-knockout HCCLM3 cells were reconstituted with TPM4FL, TPM4Δ5′UTR, TPM4ΔCDS, and TPM4Δ3′ UTR, respectively. RT-qPCR was used to detect the circASH2-enriched TPM4 mRNA levels in indicated cells (means ± SD, *P < 0.05, ***P < 0.001 and n.s., not significant, unpaired Student’s t test). (H) The predicted secondary structure and HR (1 to 14, denoted by red circles) of circASH2 was made by Mfold 2.3 software. Meanwhile, a schematic illustration of circASH2 mutations used in this study is shown. I. HA22T carrying indicated circASH2 plasmids (WT or HRmut) were used for detection of circASH2-TPM4 mRNA interaction. The enrichment level of circASH2 coisolated by TPM4 mRNA pulldown was detected by RT-qPCR. (J) RT-qPCR detection of TPM4 mRNA in indicated HA22T cells treated with 2 μg/mL actinomycin D for the indicated times. The dashed line shows the half-life of TPM4 mRNA (mean ± SD, ***P < 0.001 and n.s., not significant, two-way ANOVA test). (K) Endogenous TPM4 level and FAK activation in HA22T cells expressing WT or HRmut circASH2 were analyzed by immunoblots. GAPDH was used as an internal reference. (L) The state of cytoskeleton in indicated HA22T cells was shown by phalloidin staining of F-actin (red) and immunofluorescence of paxillin (green), while DAPI was used to stain the nucleus. (Scale bar, 10 μm.)
Fig. 6.
Fig. 6.
circASH2/hnRNP complex accelerates mRNA degradation via nonsense-mediated decay. (A) A diagram showing potential circASH2-binding proteins identified by MS (listed in the order of unused value). hnRNPs are highlighted with red boxes. (B) Gene ontology (GO) analysis of circASH2-interacting proteins, including molecular function (MF), biological process (BP), and cellular component (CC). (C) Three representative hnRNPs (hnRNPA1, hnRNPD, and hnRNPK) were confirmed as circASH2-binding proteins by immunoblot analysis in Huh7 and HCCLM3 cells. (D) HA22T cells overexpressing circASH2 or control vector were treated with Dimethylsulfoxide (DMSO), Madrasin (10 to 20 μM), isoginkgetin (5 to 10 μM), or hinokiflavone (5 to 10 μM) for 48 h. The endogenous TPM4 level was probed, while GAPDH was used as an internal reference. (E) HA22T cells overexpressing circASH2 or control vector were treated with DMSO, eIF4A3-IN-1 (5 to 10 μM), NMDl-14 (5 to 10 μM) for 48 h. The endogenous TPM4 level was probed, while GAPDH was used as an internal reference. (F) UPF1 was depleted in HA22T cells, and circASH2-induced downregulation of endogenous TPM4 was assessed by immunoblot analysis. GAPDH was used as an internal reference. (G) RT-qPCR detection of TPM4 mRNA at the indicated times in indicated HA22T cells treated with 2 μg/mL actinomycin D. The dashed line shows the half-life of TPM4 mRNA (mean ± SD, ***P < 0.001 and n.s., not significant, two-way ANOVA test).
Fig. 7.
Fig. 7.
circASH2/hnRNP-induced TPM4 mRNA degradation is YBX1-dependent. (A, Left) circASH2-binding proteins purified by circASH2 pulldown were separated by sodium dodecyl sulfate polyacrylamide gel electrophoresis (SDS-PAGE) and visualized by silver staining. The indicated protein bands (denoted by the red box) were cut from gel and used for mass spectrometry (MS) analysis. (Right) Several YBX1 peptide fragments were identified by MS. (B) Detection of endogenous YBX1 following circASH2 pulldown from Huh7 and HCCLM3 cells, while circPABPC1 was used as a negative control. (C) Immunoblot analysis showed that YBX1 KO impeded the interaction between circASH2 and hnRNPs (represented by hnRNPA1, hnRNPD, and hnRNPK) in HCCLM3 cells. (D) RT-qPCR was applied for detection of endogenous TPM4 transcripts immunoprecipitated with YBX1 (1:100, 4 °C, overnight), while circASH2 knockdown can weaken the efficiency (**P < 0.01, and ***P < 0.001, unpaired Student’s t test). (E) circASH2 FISH (red), TPM4 transcripts FISH (orange), and anti-YBX1 immunofluorescence (green, 1:200, R.T., 1 h) staining showing colocalization of these three molecules (arrowheads) in Huh7 and HCCLM3 cells. Nuclei were labeled with DAPI (blue). (Scale bars, 10 μm.) (F) HCC cells with or without YBX1 KO were transduced with the circASH2 vector (HA22T) or si-circASH (HCCLM3). TPM4 expression was determined by immunoblot analysis, while GAPDH was used as an internal reference. (G) Cytoskeleton formation of indicated HCC cells was shown by phalloidin staining of F-actin (red) and immunofluorescence of paxillin (green), while DAPI was used to stain the nucleus. (Scale bar, 10 μm.) (H, Top) Cartoon depicting the structure and sequence of YBX1-3×Flag. (Bottom) Huh7 cells were transduced with YBX1FL-3×Flag, YBX1ΔAPD-3×Flag, YBX1ΔCSD-3×Flag, and YBX1ΔCTD-3×Flag, respectively. Immunoblot analysis was used to detect the YBX1-3×Flag enriched by circASH2 pulldown. (I) HA22T cells were transduced with circASH2WT, circASH2YBX1mut (mutation in the YBX1-binding site), or 2 random-mutant circASH2 (the mutation sites were distant from the YBX1 binding site), respectively. Immunoblot analysis was used to detect endogenous YBX1 enriched by circASH2 pulldown. (J) For the in vitro binding assay, 2 ng recombinant YBX1-His was incubated with circASH2WT, circASH2YBX1mut, or 2 random-mutant circASH2 (purified from HA22T cells overexpressing different types of circASH2 and immobilized on 20 µL beads), respectively. After coincubation, the beads were magnetically separated and washed 5 times with wash buffer. circASH2-bound YBX1-His was detected by immunoblots. (K) The endogenous TPM4 level and FAK activation in HA22T cells expressing circASH2WT or circASH2YBX1mut were determined by immunoblot analysis. (L) Cytoskeleton formation in indicated HA22T cells was shown by phalloidin staining of F-actin (red) and immunofluorescence of paxillin (green), while DAPI was used to stain the nucleus. (Scale bar, 10 μm.) (M) HA22T cells were transduced with circASH2WT, circASH2YBX1mut, circASH261-64mut, circASH279-84mut, circASH299-104mut, and circASH2527-531mut, respectively. RT-qPCR was used to detect the circASH2 enriched by anti-YBX1 immunoprecipitation.
Fig. 8.
Fig. 8.
Intranuclear YBX1 undergoes LLPS enhanced by circASH2 and is indispensable for circASH2 signals. (A) Intrinsically disordered region (IDR) prediction of YBX1. (Top) Predictions of prion-like domains (PrLDs) and disordered regions. (Bottom) Schematic illustration of YBX1 structural domains. (B) Huh7 cells transfected with YBX1FL-GFP, YBX1△CTD-GFP, or YBX1△APD-GFP were analyzed by confocal microscopy. Representative pictures are shown. (Scale bar, 10 μm.) (C) Time-series fluorescence microscopy analysis of YBX1-GFP puncta in Huh7 cells. The Bottom row shows a zoom-in view of two fusing puncta. [Scale bar, 10 μm (Top) and 2 μm (Bottom).] (D, Left) Representative micrographs of YBX1-GFP puncta before and after photobleaching in Huh7 cells. (Scale bar, 10 μm.) (Right) Quantification of fluorescence intensity recovery in the bleached region of YBX1 puncta. (E) Small droplets fused into larger ones over time in vitro. (Scale bar, 5 μm.) (F) Phase separation assay of truncation mutants of YBX1 in vitro. The YBX1FL-GFP and YBX1△APD-GFP phase separated into liquid-like droplets, whereas YBX1△CTD+APD-GFP and YBX1△CTD-GFP failed. (Scale bar, 5 μm.) (G, Left) Representative micrographs of YBX1-GFP puncta before and after photobleaching in vitro. (Scale bar, 2 μm.) (Right) Quantification of fluorescence intensity recovery in the bleached region of YBX1 puncta. (H) Representative fluorescent images of phase separation behaviors of different concentrations of purified YBX1-GFP in different concentrations of NaCl (with 5% PEG8000). (Scale bar, 5 μm.) (I, Left) Representative fluorescent images of YBX1-GFP in control and circASH2-silenced HCC cells. (Scale bar, 10 μm.) (Right) Quantification of YBX1-GFP puncta number in control and circASH2-silenced HCC cells (mean ± SD, **P < 0.01 and ***P < 0.001, unpaired Student’s t test). (J) In vitro phase separation of purified YBX1-GFP with or without addition of 50 ng/μL different kinds of RNAs. circPABPC1 and tRNA were used as a negative control. (Scale bar, 5 μm.) (K) In vitro phase separation of purified YBX1-GFP with 50 ng/μL circASH2 with or without addition of 20U RNaseA or 20U RNaseR. (Scale bar, 5 μm.) (L) In vitro phase separation assay showing that circASH2 promotes YBX1 LLPS in a dose-dependent manner. (Scale bar, 5 μm.) (M) In vitro phase separation assay showing that circASH2WT facilitates YBX1WT-GFP, instead of YBX1△CTD-GFP, phase separation, whereas circASH2YBX1mut loses the function. (Scale bar, 5 μm.) (N) YBX1-KO HCC cells (HCCLM3 and HA22T) were reconstituted with YBX1FL, YBX1△APD, YBX1△CSD, and YBX1△CTD, respectively. Immunoblots were used to detect the endogenous TPM4 level in the indicated cells.

References

    1. Sung H., et al. , Global cancer statistics 2020: GLOBOCAN estimates of incidence and mortality worldwide for 36 cancers in 185 countries. CA Cancer J. Clin. 71, 209–249 (2021). - PubMed
    1. Llovet J. M., et al. , Hepatocellular carcinoma. Nat. Rev. Dis. Primers 7, 6 (2021). - PubMed
    1. Stuelten C. H., Parent C. A., Montell D. J., Cell motility in cancer invasion and metastasis: Insights from simple model organisms. Nat. Rev. Cancer 18, 296–312 (2018). - PMC - PubMed
    1. Seetharaman S., Etienne-Manneville S., Cytoskeletal crosstalk in cell migration. Trends Cell Biol. 30, 720–735 (2020). - PubMed
    1. Hohmann T., Dehghani F., The cytoskeleton-A complex interacting meshwork. Cells 8, 362 (2019). - PMC - PubMed

Publication types